0%

Ecommerce Personalisation: A Complete Guide

What This Guide Covers

Who this is for:
Ecommerce business owners, digital commerce leaders, marketing executives, product managers, and technology decision-makers who are evaluating ecommerce personalisation platforms to increase conversion rates, improve customer lifetime value, reduce acquisition costs, and deliver data-driven shopping experiences at scale.

Search intent:
Commercial investigation and platform evaluation. This guide is written for decision-makers who already understand the importance of ecommerce personalisation and are comparing technologies before investing. Rather than explaining the fundamentals of personalisation, it focuses on evaluating implementation models, AI capabilities, pricing, total cost of ownership, integration complexity, and measurable ROI to help businesses choose the right solution for their ecommerce growth strategy.

What you will walk away with:
A comprehensive guide to ecommerce personalisation in 2026, including the business case for implementation, core strategy components, funnel-specific use cases, comparison of leading personalisation platforms, pricing across SMB, mid-market, and enterprise tiers, ROI benchmarks, implementation risks, vendor evaluation criteria, and a practical framework for selecting and deploying the right ecommerce personalisation platform based on your business size, technology stack, and long-term growth objectives.

Introduction

ecommerece

Ecommerce personalisation is no longer a differentiation play. Instead, it has become a revenue baseline. 89% of businesses report positive ROI from personalisation, and McKinsey data shows a 10 to 30% improvement in marketing ROI for companies that execute it at scale. As a result, generic shopping experiences, the same homepage, the same product grid, and the same email for every visitor, cost businesses revenue through higher cart abandonment and lower customer lifetime value.

It is positioned for C-level decision-makers evaluating whether to build, buy, or scale a personalisation capability in 2026. The framing throughout is cost versus value, not feature lists.

This guide covers the business case, pricing realities, platform comparisons, and vendor selection criteria for ecommerce personalisation in 2026.

What Is Ecommerce Personalisation?

Ecommerce personalisation is the automated delivery of individualized shopping experiences, product recommendations, dynamic content, pricing, and messaging, based on behavioural, transactional, and demographic data. The engine is software. The output is a shopping environment that adjusts in real time to who is browsing, what they have purchased before, and what similar customers have done. It operates without manual curation at the individual level.

ecommerece

How It Differs from Product Customisation

Product customisation is buyer-controlled: the customer selects a colour, engraves a name, or configures a spec. Ecommerce personalisation is system-controlled: the platform adapts the experience before the customer makes any explicit choice, based on inferred or declared preferences. The distinction matters for budget allocation; customisation is a product decision; personalisation is a data and technology decision. In B2B contexts, the data models differ significantly: buying cycles are longer, purchasing is committee-driven, and account-level rather than individual-level signals drive the most relevant personalisation logic.

Why Ecommerce Personalisation Matters for Revenue Growth

The financial case for personalisation is well documented. Therefore, the real question in 2026 is not whether it works but which implementation model delivers the strongest return.

Impact on Conversion Rates and AOV

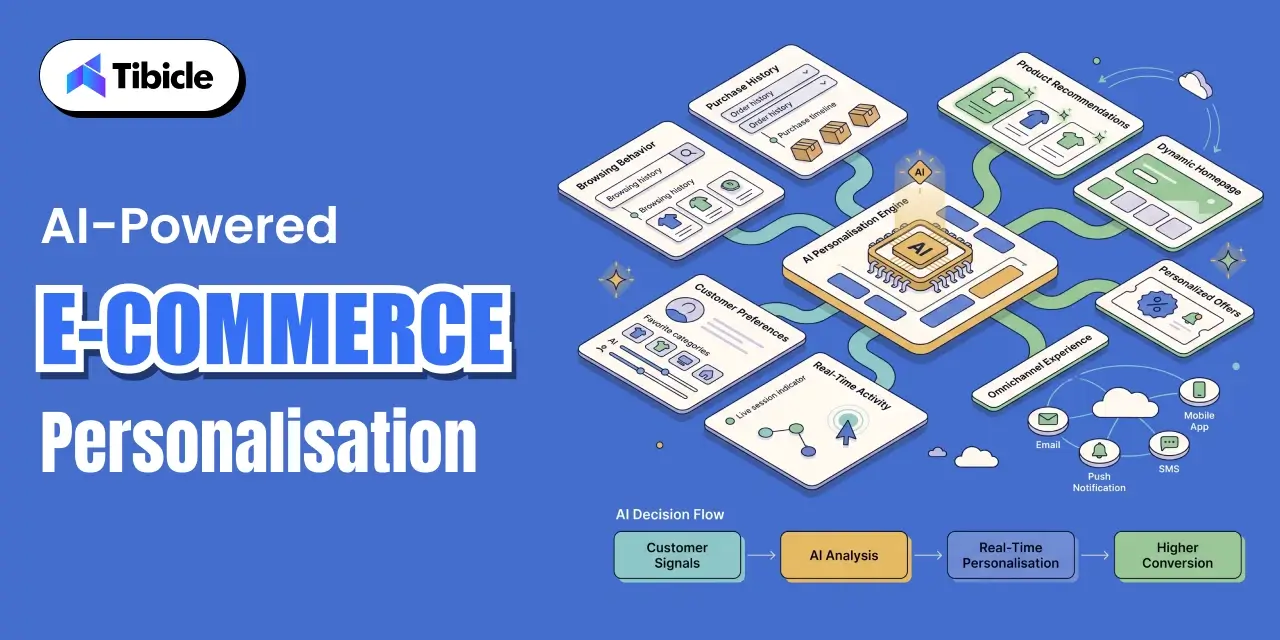
Product recommendations alone drive up to 31% of ecommerce revenue across mature implementations. At the session level, AI product recommendations increase average order value by up to 369% in high-engagement sessions, reflecting what happens when the right product reaches the right customer at the right moment in the purchase flow, rather than when a generic bestsellers grid occupies that real estate. These are not marginal improvements. They are structural revenue differences between personalised and non-personalised commercial environments.

Reduction in Customer Acquisition Cost

Personalisation reduces customer acquisition cost by up to 50%, according to McKinsey research. The mechanism: relevant experiences improve conversion rates at every funnel stage, which reduces the cost-per-acquisition from paid channels. First-party data strategies, collecting and activating data directly from customer interactions rather than purchasing third-party audiences, deliver a 2.9x revenue increase compared to cohorts still relying on third-party data models. As third-party cookie deprecation continues, the gap between operators with mature first-party data infrastructure and those without it widens every quarter.

Core Components of an Ecommerce Personalisation Strategy

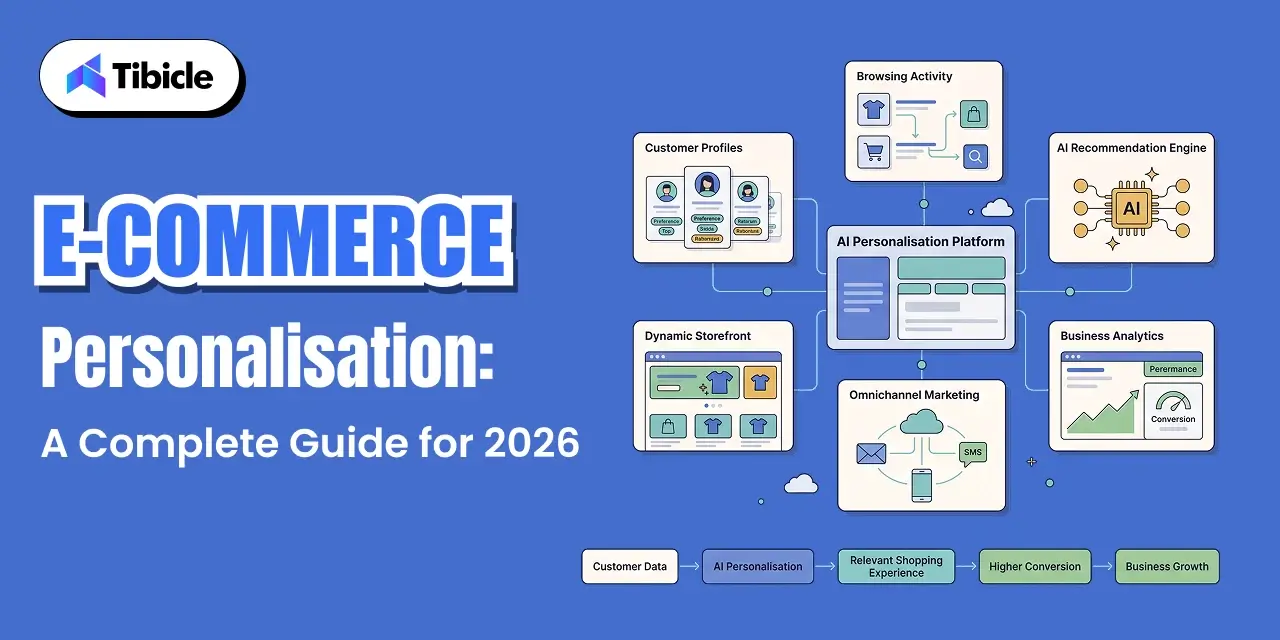
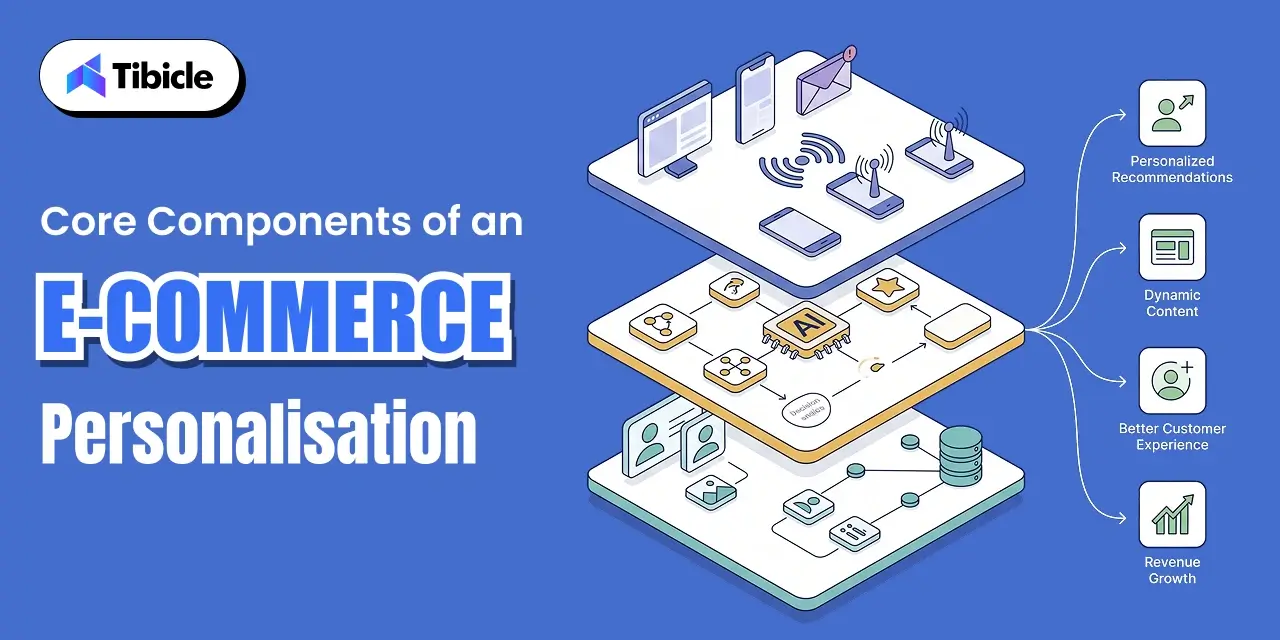
A personalised shopping experience at scale is built on three interdependent layers. Weakness in any one of them limits the output of the others.

ecommerece

Data Infrastructure and First-Party Data

The deprecation of third-party cookies has made zero-party data, data customers share voluntarily through quizzes, preference centers, and account profiles, and first-party behavioural data the primary inputs for personalisation engines. A customer data platform unifies these sources into a single customer profile. Without this foundation, personalisation engines operate on incomplete signals. 

AI and Machine Learning Layer

92% of businesses now use AI-driven personalisation in some form. Additionally, the AI layer handles tasks that manual segmentation simply : real-time personalisation of product recommendations based on session behaviour, dynamic pricing adjustments informed by demand signals, and predictive commerce that surfaces products a customer is statistically likely to want before they have searched for them. The accuracy of this layer is a direct function of data volume and model training quality, which is why platform selection and data infrastructure decisions are inseparable.

Omnichannel Orchestration

Likewise, personalisation that operates only on the website misses many valuable customer touchpoints. Omnichannel personalisation coordinates individualised experiences across email, web, push notifications, SMS, and social channels from a unified data model. Cross-channel brands see 6.5x more purchases per user than single-channel operators, a figure that reflects the compounding effect of consistent, relevant messaging across every surface a customer encounters.

Ecommerce Personalisation Use Cases by Funnel Stage

The specific capability that delivers the highest ROI depends on where the largest revenue leak sits in the current funnel. Each stage has a distinct set of personalisation levers.

Acquisition: Personalised Landing Pages and Retargeting

Behavioural targeting at the acquisition stage uses traffic source, device type, referral keyword, and prior session data to serve landing page variants that match the visitor’s inferred intent. A visitor arriving from a branded search query sees a different commercial proposition than one arriving from a generic category keyword, and conversion rates reflect that difference.

Consideration: Dynamic Product Recommendations and Search

Dynamic content at the consideration stage surfaces relevant products based on browse history, category affinity, and collaborative filtering signals. Personalised search, where results are ranked by individual relevance rather than global popularity, is one of the highest-leverage interventions available, particularly for large-catalog retailers where the default search experience buries relevant items under top-sellers.

Conversion: Cart Recovery and Checkout Optimisation

$260 billion in lost orders are recoverable through better checkout personalisation, according to Baymard Institute research. Cart abandonment personalisation, triggered emails, browser push notifications, and SMS recovery sequences with session-specific product references directly target that recoverable figure. Conversion rate optimisation at checkout also includes personalised payment method display, address pre-fill, and delivery option prioritisation based on past purchase behaviour.

Retention: Post-Purchase Flows and Loyalty Triggers

Post-purchase personalisation extends the commercial relationship beyond the transaction. Replenishment reminders timed to product consumption cycles, cross-sell sequences based on purchase category affinity, and loyalty milestone triggers all operate on first-party data the brand already holds. Operators running structured personalised recovery campaigns report a 56% repeat purchase rate, a benchmark that illustrates the compounding value of treating retention as a personalisation problem, not a discounting problem.

Ecommerce Personalisation Tools Comparison

The ecommerce personalisation tools market spans from $39 a month SMB solutions to $100,000+ a year enterprise platforms. The capability gap between tiers is significant, and choosing the wrong tier in either direction is expensive. Use this table as a first-pass filter before engaging vendors.

ToolBest ForAI CapabilityPricing ModelIntegration Depth
Dynamic YieldEnterprise on-site personalisationAdvanced MLCustom/enterpriseDeep (multi-platform)
KlaviyoEmail + SMS personalisationPredictive analyticsTiered (usage-based)Strong (Shopify, BigCommerce)
BloomreachFull-stack commerce experienceLoomi AI engineCustomCRM, CDP, search
NostoMid-market product recommendationsExperience AITieredShopify, Magento
InsiderOmnichannel journey orchestrationSirius AICustom (~$48K-$100K/yr)12+ channels
Adobe TargetEnterprise testing + personalisationAdobe SenseiEnterprise customAdobe ecosystem
PersonizelySMB on-site personalisationRules + basic AI$39-$59/mo (starting)Shopify, WordPress

Pricing Insights: What Ecommerce Personalisation Actually Costs

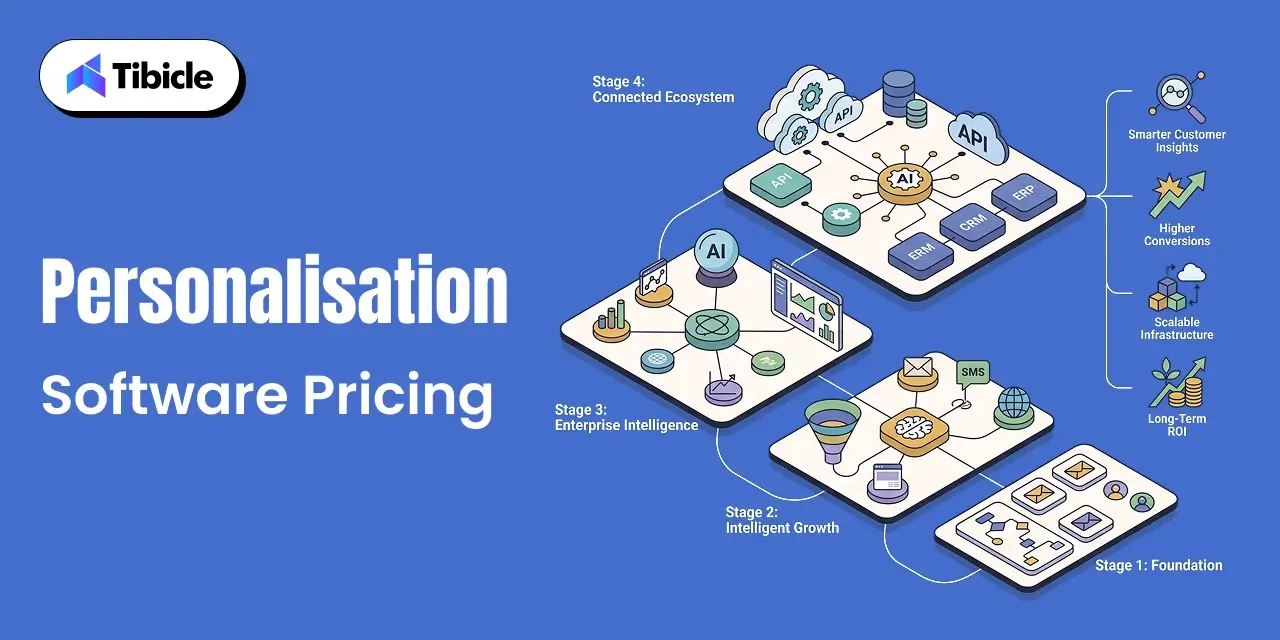
Personalisation platform pricing spans three distinct tiers, each with different capability ceilings and total cost of ownership implications. The sticker price is rarely the complete picture.

ecommerece Personalisation

SMB Tier ($39 to $500 per Month)

Tools at this tier, Personizely, Klaviyo’s entry plans, Nosto’s lower tiers, cover rule-based segmentation and basic e-commerce personalisation tools functionality. AI capability is limited. Suitable for single-channel operators with under $5M in annual revenue and relatively simple personalisation requirements.

Mid-Market Tier ($1,000 to $5,000 per Month)

Platforms like Bloomreach and Dynamic Yield at this tier deliver ML-driven recommendations, multi-channel support, and the integration depth needed to pull from CRM, CDP, and delivery platform data simultaneously. This is where the ROI case becomes compelling for operators with meaningful traffic volume and catalog complexity.

Enterprise Tier ($48,000 to $100,000+ per Year)

Insider, Adobe Target, and Salesforce Commerce Cloud operate at this level. Full-stack personalisation, dedicated implementation support, and contract structures that include onboarding and ongoing optimisation resource are standard. The pricing reflects platforms built for operators where personalisation is infrastructure, not a feature.

Hidden Costs to Account For

When planning an ecommerce personalisation strategy, the platform licence is only one part of the investment. Businesses should also budget for integrating systems such as the CDP, CRM, ecommerce platform, and email tools. In addition, building a reliable data infrastructure requires identity resolution and well-designed data pipelines.

Effective personalisation also requires creating multiple versions of content for different customer segments, which increases creative production efforts. Finally, achieving long-term success depends on continuous optimisation through testing, monitoring, and performance analysis rather than a one-time implementation.

ROI Benchmarks: Measuring the Business Impact

The ROI data on ecommerce personalisation is consistent across multiple independent sources and operator segments. Companies with advanced personalisation capabilities see $20 return per $1 spent. A Forrester study on Optimizely customers found 446% three-year ROI, with AI-powered personalisation reaching full ROI within 4 to 6 months of implementation. Personalised email campaigns generate 122% higher ROI compared to generic sends to the same contact list.

Metrics That Matter for Executive Reporting

Four KPIs translate personalisation performance into board-level language:

1) Revenue per visitor – the cleanest measure of whether personalisation is moving commercial outcomes

2) Recommendation-driven revenue share – percentage of total revenue attributable to personalised product surfaces

3) CAC reduction rate – improvement in cost-per-acquisition from paid channels as conversion rates increase

4) Customer lifetime value uplift – personalisation correlates with 33% higher CLV; track this at 6 and 12-month cohort intervals

Risks and Challenges in Ecommerce Personalisation

Three risk categories account for the majority of personalisation programmes that underperform their ROI projections.

Data Privacy and Compliance Exposure

GDPR, CCPA, and expanding regional consent requirements have changed the legal baseline for personalisation data collection. Consent-based data models are not optional infrastructure; they are a compliance requirement. Platforms that haven’t migrated away from third-party cookie dependency carry compounding legal and operational risk as cookie deprecation extends across browsers.

Over-Personalisation and Customer Pushback

However, personalisation has limits. If it becomes too intrusive, customer trust quickly declines. 76% of consumers report frustration when personalisation is irrelevant or feels intrusive, suggesting that getting it wrong erodes trust faster than not personalising at all. The failure mode is using data signals the customer hasn’t intentionally shared, or surfacing recommendations that reveal how much behavioural data is being tracked.

Integration Complexity and Vendor Lock-In

CDP dependency, siloed data across legacy tools, and non-portable data formats create switching costs that extend well beyond the contract exit fee. Evaluate data portability clauses and API openness before signing. The platforms with the deepest native integration typically create the deepest lock-in, and that trade-off needs to be explicit in the vendor selection decision.

Vendor Selection Checklist for Ecommerce Personalisation

Use this scorecard when evaluating any ecommerce personalisation strategy platform. Score each vendor against these criteria before shortlisting.

CriteriaWeightWhat to Verify
AI / ML capability depthHighDoes it generate predictive recommendations or apply static rules?
CRM and commerce stack integrationHighNative connectors vs. middleware dependency
Data residency and privacyHighGDPR, CCPA compliance; consent-based data model
Implementation timelineMediumSelf-service (hours), managed (days), enterprise (weeks to months)
Attribution model transparencyMediumSame-session vs. multi-day attribution clarity
ScalabilityMediumPerformance against traffic spikes and large catalog size
Support and onboarding qualityMediumDedicated CSM, structured onboarding, SLA response times
Total cost of ownershipHighLicense + integration + content production + ongoing headcount

Ultimately, any vendor that provides vague answers on data residency, attribution models, or total cost of ownership should not progress beyond the shortlist. These are not edge-case questions; they are the variables that determine whether the investment pays back.

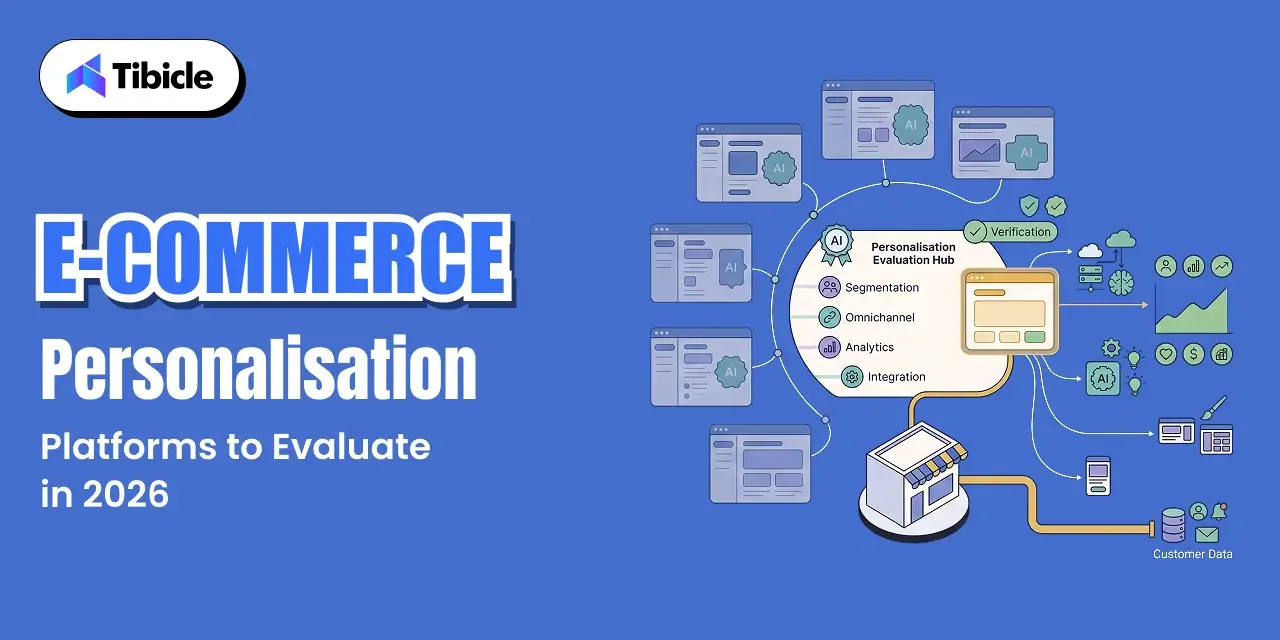
Top Ecommerce Personalisation Platforms to Evaluate in 2026

Shortlisted by use case. Selection should be driven by the scorecard criteria above, not brand recognition or analyst positioning.

ecommerece Personalisation

  1. Dynamic Yield – best for enterprise A/B testing and on-site personalisation at scale
  2. Bloomreach – best for unified commerce search combined with AI-driven product recommendations
  3. Klaviyo – best for email and SMS-first personalisation with strong Shopify and BigCommerce integration
  4. Insider – best for omnichannel journey orchestration across 12+ channels
  5. Nosto – best for mid-market product discovery on Shopify and Magento
  6. Algolia – best for AI-powered personalised search and catalog relevance
  7. Personizely – best for SMB on-site personalisation on a budget without enterprise overhead

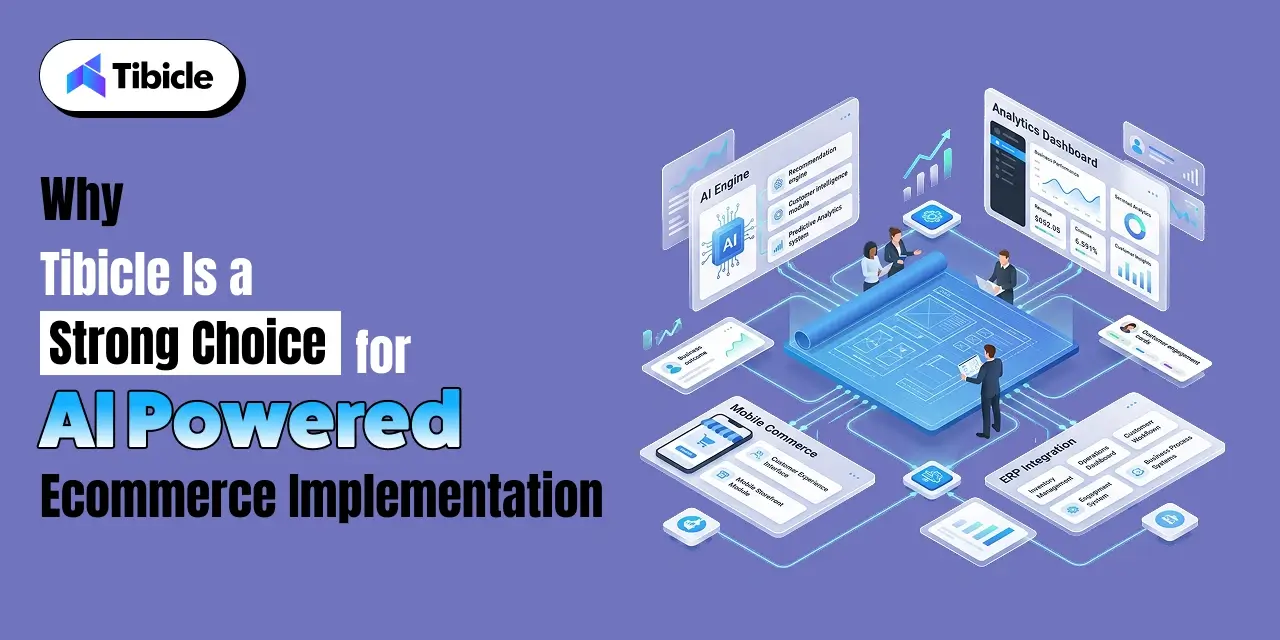
Why Tibicle Is a Strong Choice for Ecommerce Personalisation Implementation

Platform selection is the first decision. However, successful implementation is what ultimately determines ROI. Implementation is where ecommerce personalisation programmes succeed or fail. Tibicle operates as an implementation and technology partner, not a product vendor for ecommerce businesses at the stage where off-the-shelf configuration isn’t sufficient.

The integration complexity challenges covered earlier in this guide- CDP dependency, siloed data, non-native POS connectors, omnichannel orchestration across fragmented tools- are exactly the problems Tibicle’s development teams are built to solve. The scope covers custom ecommerce development, integration architecture across commerce and CRM platforms, data infrastructure consulting, and scalable build-to-operate models for teams that don’t have in-house engineering capacity.

Connect with Tibicle’s team to assess your personalisation readiness and build a phased rollout plan.

Conclusion

The market data on ecommerce personalisation supports action, not observation. A 4 to 6 month payback window on AI-powered implementations, $20 return per $1 spent at mature deployments, and a 33% customer lifetime value uplift are not marginal gains; they are the gap between operators who treat personalisation as infrastructure and those who treat it as a feature on a roadmap.

Overall, the comparison table, pricing breakdown, and vendor checklist are designed to help you create a practical shortlist rather than simply provide background information.

Talk to Tibicle to scope your ecommerce personalisation strategy and implementation roadmap.

Frequently Asked Questions

What is ecommerce personalisation and how does it work?
Ecommerce personalisation is the automated delivery of individualised shopping experiences, product recommendations, content, pricing, and messaging based on behavioural and transactional data. It works through a data layer that captures customer signals, a machine learning engine that identifies patterns, and a delivery layer that adapts the on-site or off-site experience in real time.

How much does ecommerce personalisation software cost in 2026?
SMB-tier tools start at $39 to $500 a month. Mid-market platforms run $1,000 to $5,000 a month. Enterprise platforms like Insider and Adobe Target start at $48,000 a year and scale upward. Total cost of ownership, including integration, content, and optimisation headcount, typically runs 2 to 3 times the license fee.

What ROI can businesses expect from ecommerce personalisation?
Companies with advanced personalisation see $20 return per $1 spent. AI-powered personalisation reaches full ROI within 4 to 6 months, with a Forrester-documented 446% three-year ROI for enterprise implementations. At the campaign level, personalised emails generate 122% higher ROI versus generic sends.

What is the difference between ecommerce personalisation and product customisation?
Product customisation is buyer-initiated; the customer selects product attributes. Ecommerce personalisation is system-initiated; the platform adapts the shopping experience based on data, before the customer makes any explicit choice. They operate at different layers of the commerce stack and require different technology and budget allocation.

Which ecommerce personalisation tools are best for mid-market businesses?
Bloomreach and Dynamic Yield are the strongest mid-market options for full-stack personalisation. Nosto is the most accessible entry point for product recommendation-focused use cases on Shopify and Magento. Klaviyo leads for email and SMS personalisation at this tier. The right choice depends on which funnel stage holds the largest revenue gap.

How long does it take to implement an ecommerce personalisation platform?
Self-service SMB tools are live within hours. Managed mid-market implementations typically take days to weeks depending on data complexity. Full enterprise deployments including CDP setup, multi-channel integration, and QA run 4 to 12 weeks. Budget 2 to 4 hours of team training before go-live regardless of platform tier.

Restaurant POS Systems Explained: Types, Features, and How to Choose One

Introduction

The point of sale is the operational hub of a modern restaurant. The market for restaurant POS systems reflects it. The global restaurant POS systems market was valued at $15.38 billion in 2024. It is projected to reach $27.8 billion by 2033, growing at a 6.8% CAGR. Yet most operators choose among restaurant POS systems on the headline monthly price. They discover the real cost and the real limitations months later.

restaurant POS system

Restaurant POS systems have moved well beyond ringing up orders. They now route tickets to the kitchen, track inventory, manage labor. They also pull every sales channel into one place, most often through a cloud-based POS system. Choosing well means understanding the types, the features that actually move the P&L. The cost layers vendors do not advertise. This guide explains restaurant POS systems end to end: what they are, the main types, the features to prioritize. It also coverts what they cost in 2026, and a framework for choosing one.

What a Restaurant POS System Actually Is

restaurant POS system

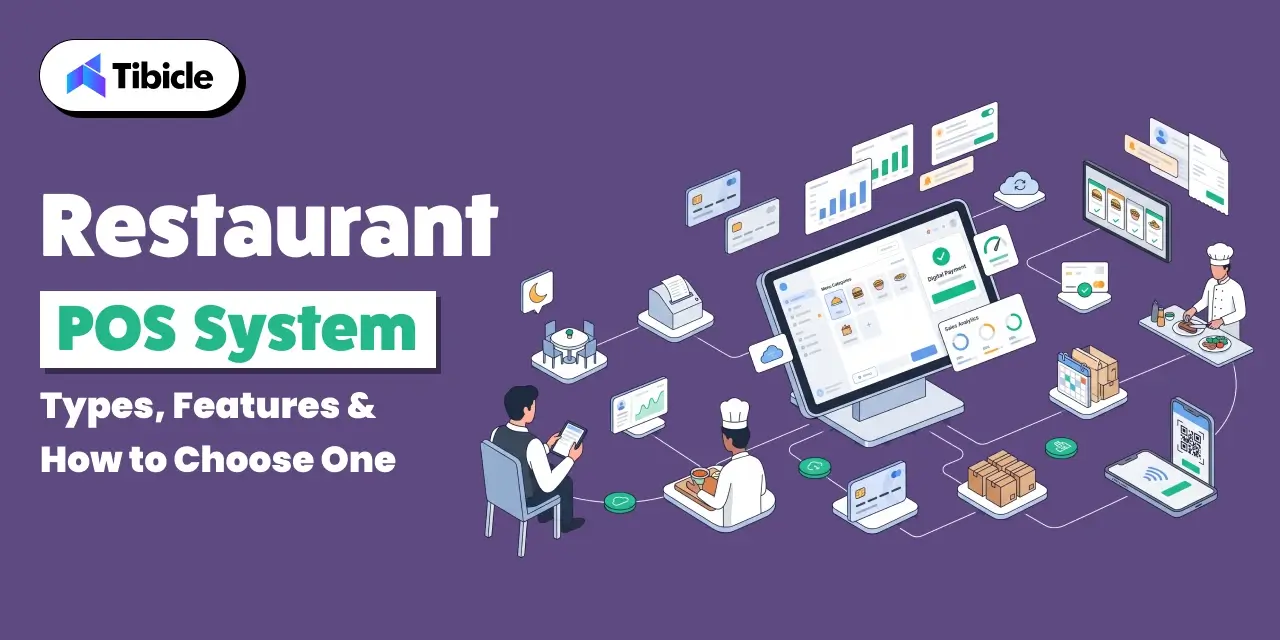
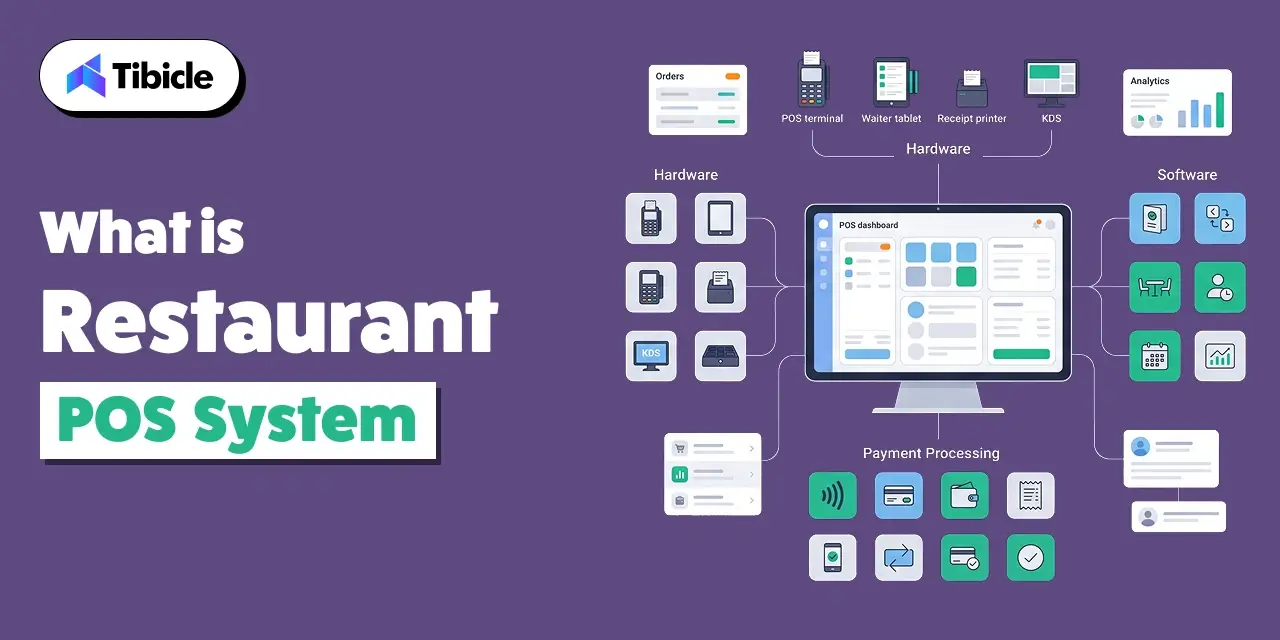
A restaurant POS system is the combination of hardware and software that processes orders and payments. It tracks what happens across the restaurant. The hardware is what staff touch during service: terminals, tablets, card readers, and kitchen screens. The restaurant POS software is the brain: it handles menus, order routing, payments, and reporting. Understanding that split is the first step to comparing restaurant POS systems fairly.

The distinction matters because restaurant POS systems are sold as bundles, and the pieces do not carry equal weight. Hardware is a one-time or financed cost. The restaurant POS software is where daily workflow lives. Payment processing, discussed later, is where most of the money actually goes. A clear-eyed buyer separates the three before comparing quotes.

The Main Types of Restaurant POS Systems

restaurant POS system

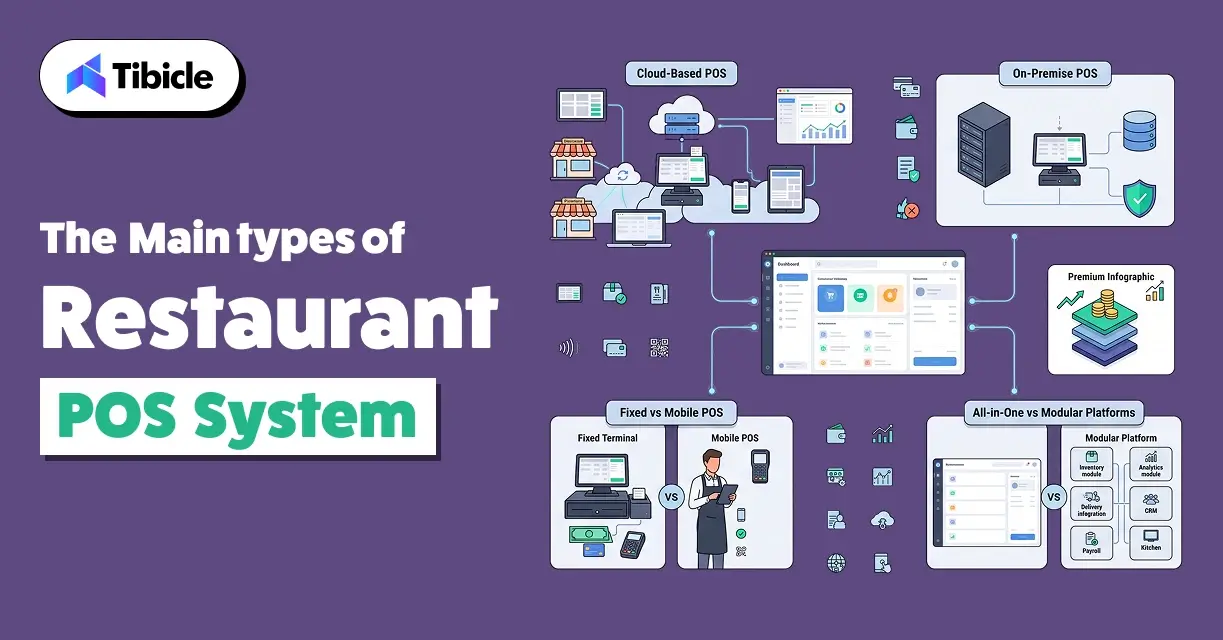
Restaurant POS systems split along two axes: how they are deployed, and what form the hardware takes. Both shape cost, flexibility, and fit, and both matter when you compare them side by side.

Cloud-Based POS Systems

A cloud-based POS system stores data on remote servers and runs as a subscription. A cloud-based POS system updates automatically, syncs across locations in real time, and lets an operator check performance from any device, anywhere. This is the direction the market is moving: the cloud segment is growing faster than on-premise, at above 9% CAGR, because a cloud-based POS system lowers upfront cost and shifts hardware-maintenance risk to the provider. For most restaurants opening today, a cloud-based POS system is the default choice among restaurant POS systems.

On-Premise POS Systems

On-premise systems keep data on local servers inside the restaurant. They appeal to large operators who want tight control, work offline reliably, and keep data behind their own firewall. The trade-off versus a cloud-based POS system is higher upfront cost, manual updates, and harder multi-location reporting. On-premise still has a place, but a cloud-based POS system is the rule rather than the exception in 2026.

Fixed vs Mobile Terminals

Independent of deployment, restaurant POS systems come as fixed stations or mobile terminals, and both can run on a cloud-based POS system. Fixed terminals anchor a counter or checkout. Mobile POS, handhelds and tablets, let servers take orders and payment tableside, cut ticket errors, and speed up table turns. Mobile is the fastest-growing hardware form among restaurant POS systems because it fits the way service actually flows.

All-in-One vs Modular Platforms

Some restaurant POS systems bundle everything- ordering, payments, loyalty- into one platform; others let you assemble modules. Independent restaurants and small cafes usually prefer all-in-one platforms for their ease of use, often a cloud-based POS system, while franchises and chains invest in scalable, enterprise-grade restaurant POS systems with multi-location sync.

Core Features to Look For

Feature lists across restaurant POS systems are long; the ones that decide day-to-day value are short. These are the capabilities worth weighting most.

  • Order routing and kitchen display: orders should flow straight from the restaurant POS software to a kitchen display, reducing errors and improving ticket times. This is a baseline test of good restaurant POS software.
  • Payment flexibility: the restaurant POS software should accept credit, debit, mobile wallets, and contactless, plus split checks by seat, item, or percentage.
  • Inventory tracking: stock that depletes against sales in real time, so food cost stays visible before month-end; a cloud-based POS system handles this best.
  • Menu management: update items, pricing, and specials once in the restaurant POS software and have it sync across every terminal and online channel.
  • Reporting and analytics: the restaurant POS software should surface daily sales, labor, and menu-performance data, ideally by location, available from any device.
  • Delivery and online-order integration: the restaurant POS software should connect directly to delivery aggregators, with orders routed into the same system instead of a separate tablet.
  • Loyalty and CRM: built-in rewards and customer data in the restaurant POS software that turn first-time visitors into regulars.

The strongest restaurant POS systems tie these together on one data source. A kitchen display disconnected from inventory, or loyalty that does not read the restaurant POS software, recreates the silos POS systems were meant to remove.

What Restaurant POS Systems Cost in 2026

What Restaurant POS Systems Cost in 2026

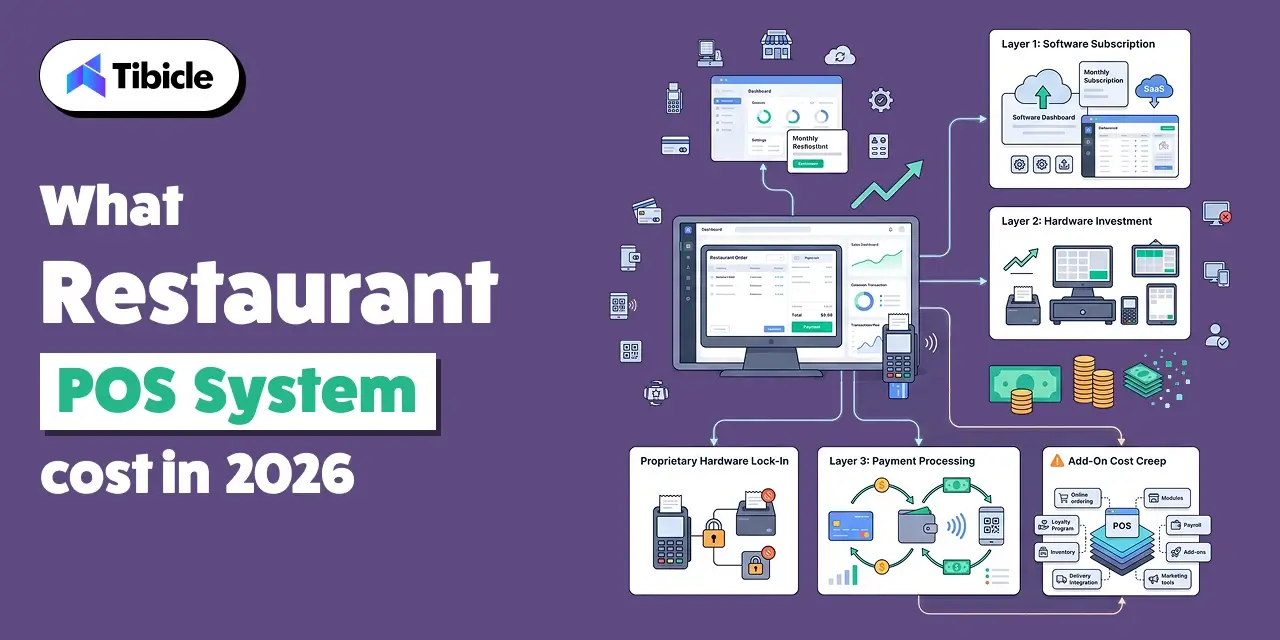
Every restaurant POS system bill has three layers, and vendors compete hardest on the one you notice least. Understanding all three is the difference between a budget that holds and one that doubles by invoice three, and it is the single most useful skill when comparing POS systems.

Cost LayerTypical Range (2026)Notes
Software (monthly)$0 to ~$399 / monthThe advertised number, and the smallest layer; free tiers exist
Hardware (per terminal)$600 to $2,000; full setup $2,000 to $4,000Some vendors lock you to proprietary hardware
Processing (per swipe)~2.3% to 2.99% + $0.10 to $0.15Usually the highest cost by far; see below


The layer that dominates is processing. On $50,000 a month in card volume, processing runs roughly $12,000 to $18,000 a year, far more than software and hardware combined, per a 2026 cost breakdown. A restaurant POS system with a low headline price on its restaurant POS software but a higher processing rate can cost more overall than a pricier one with a lower rate. All in, a single-location restaurant typically spends $1,200 to $5,000 a month on its full stack, most of it processing, according to a vendor-neutral pricing analysis.

Two traps hide in the fine print: proprietary-hardware lock-in, where leaving a vendor turns $1,500 to $3,000 of terminals into paperweights, and add-on creep, where a $69 base plan reaches $150 to $500 a month once online ordering, loyalty, and payroll modules are added.

How to Choose the Right One

How to Choose the Right One

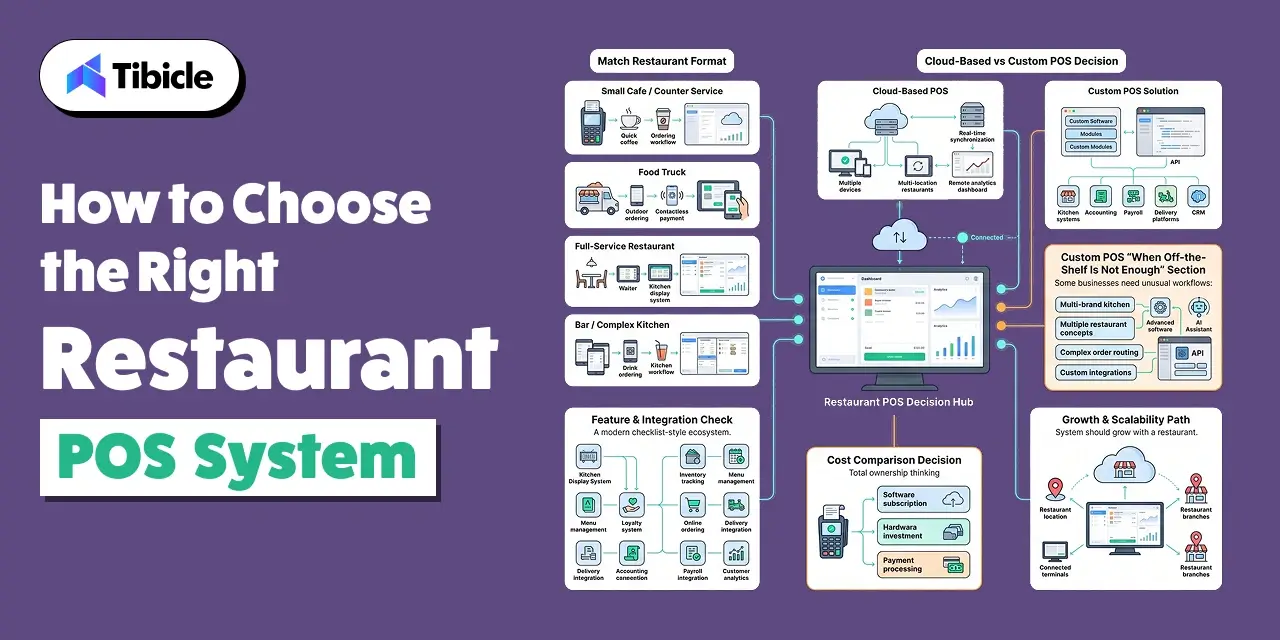
The right restaurant POS system depends on your format, your volume, and your growth plan. Use this short framework to narrow the field of POS systems:

  • Match the type to your model: counter-service and food trucks lean toward a simple cloud-based POS system; full-service and bars need deeper table management and coursing. The type of restaurant POS system matters as much as the brand.
  • Compare the all-in monthly total: add restaurant POS software, hardware amortization, and processing. Never compare headline software prices alone.
  • Check the contract and hardware terms: month-to-month with standard hardware protects flexibility; some restaurant POS systems use multi-year terms with proprietary hardware that raise switching costs.
  • Verify integrations: confirm the restaurant POS software connects to your delivery apps, accounting, and payroll without custom work, since weak integration is the most common restaurant POS software complaint.
  • Plan for scale: choose restaurant POS systems that price predictably as you add locations, not ones that penalize each new terminal. A cloud-based POS system usually scales more cleanly here.

For a small cafe, an affordable all-in-one cloud-based POS system is usually the right call. For a full-service restaurant with bar and kitchen complexity, a feature-rich platform earns its higher cost. The mistake is choosing the demo that looked best in the room instead of the restaurant POS system that fits how your kitchen actually runs.

When Off-the-Shelf Is Not Enough

Off-the-shelf POS systems cover most operations well. They fall short for businesses with non-standard workflows: multi-brand dark kitchens routing orders across concepts, franchises needing custom procurement logic, or operators whose existing systems will not integrate with any mainstream restaurant POS software. Forcing a packaged platform to fit those cases often costs more in workarounds than a purpose-built system would, which is where custom restaurant POS systems come in.

Tibicle LLP builds custom POS software, connected kitchen systems, and AI-driven restaurant applications for operators in that category. Its restaurant tech and custom POS services run from a scoped MVP to a full restaurant POS software build shaped around how a specific operation works. For operators who have outgrown packaged restaurant POS systems, or need one that connects cleanly to the rest of their stack, a custom build is worth costing out against the alternative.

Conclusion

Restaurant POS systems are no longer just cash registers; they are the data hub every other system reads from. Choosing among the systems comes down to three things: picking the type that fits your format, weighting the features that move the P&L, and comparing the all-in cost, especially processing, rather than the headline restaurant POS software price.

Most operators are well served by a mainstream cloud-based POS system. Those with complex, multi-brand, or integration-heavy operations should weigh a custom build before signing a multi-year contract on packaged POS systems. 

Comparing restaurant POS systems, or scoping a custom build? Talk to the Tibicle team, or see their guide to the best restaurant accounting software in 2026.

Frequently Asked Questions

What are restaurant POS systems?
These are the hardware-and-software setups that process orders and payments while tracking sales, inventory, and labor. The restaurant POS software handles menus, routing, and reporting; the hardware is what staff use during service.

How much do restaurant POS systems cost in 2026?
Across restaurant POS systems, software runs $0 to about $399 a month, hardware $600 to $2,000 per terminal, and processing roughly 2.3% to 2.99% per swipe. All in, a single location typically spends $1,200 to $5,000 a month, most of it processing fees.

What is a cloud-based POS system?
A cloud-based POS system stores data on remote servers and runs as a subscription, so it updates automatically, syncs across locations in real time, and can be managed from any device. Among restaurant POS systems, a cloud-based POS system is the fastest-growing and most common choice for new restaurants.

Which POS type is best for a small restaurant?
A cloud-based, all-in-one platform is usually best for small or counter-service restaurants: low upfront cost, easy setup, and predictable pricing. Full-service restaurants with bars and complex kitchens need restaurant POS software with deeper table management and coursing.

When should a restaurant use a custom POS instead?
When workflows are non-standard, multi-brand dark kitchens, custom procurement, or systems that will not integrate, customizing a packaged restaurant POS system costs as much as building a purpose-fit one. That is when custom restaurant POS systems make sense.

Restaurant Management System: Complete Guide to Features, Cost, and ROI in 2026

Introduction

A restaurant management system has moved from a back-office convenience to the operational core of how restaurants run in 2026. The global restaurant management software market was valued at $5.79 billion in 2024. It is  projected to reach $14.70 billion by 2030, growing at a 17.4% CAGR. That growth is not happening in a vacuum. It is a direct response to margin pressure: in 2025: 42% of operators reported that their restaurants were not profitable, and more than 9 in 10 cited food and labor as significant cost challenges.

 Restaurant Management System

The problem most operators run into is not whether to adopt a restaurant management system. It is choosing a system that removes cost instead of adding it. If it does not integrate with the restaurant POS system, cannot handle multi-location reporting, or gets abandoned by kitchen staff after two months does not protect margin; it erodes it. This guide breaks down what such system includes, what the core features do for the P&L, what such system costs in 2026, and how to calculate the return before signing anything.

What a Restaurant Management System Actually Includes

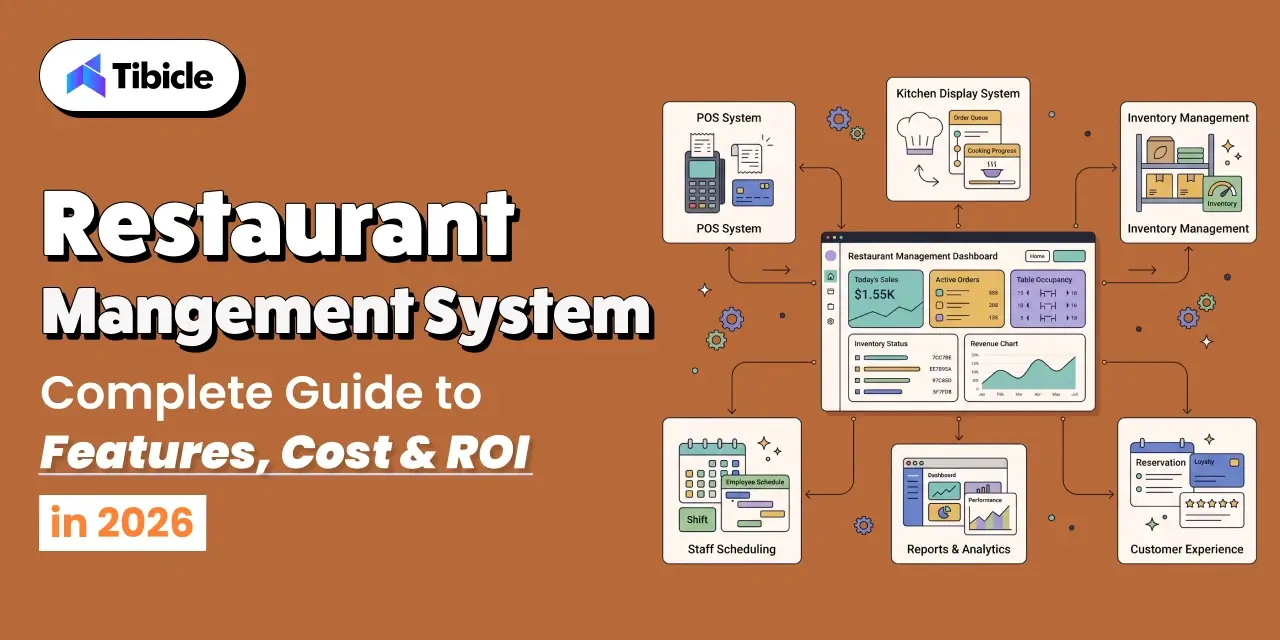
A restaurant management system is not a single tool. It is a connected set of modules that share data, with the restaurant POS system acting as the hub that every other component reads from. When operators evaluate, the distinction that matters is how tightly these modules talk to each other, not how many features appear on the vendor’s sheet. A strong restaurant POS system feeds clean data to every module downstream.

A typical restaurant management system covers the following operational layers:

  • Point of sale: the restaurant POS system handles order entry, payment processing, and the transaction record that feeds every other module.
  • Restaurant inventory management: restaurant inventory management ties stock depletion to sales, plus purchase orders, recipe costing, and waste tracking.
  • Kitchen operations: order routing to a kitchen display system, ticket timing, and station-level coordination.
  • Staff and scheduling: labor scheduling, time tracking, and labor-cost reporting against sales.
  • Reporting and analytics: daily sales, food cost, and labor cost visibility, ideally by location and by day.

The value of a restaurant management system comes from these layers sharing one data source. When the restaurant POS system records a sale, restaurant inventory management should deplete stock in real time, and the reporting layer should reflect the margin impact without a manual export. Restaurant inventory management that runs on live POS data is the difference between control and guesswork. A collection of disconnected tools that each solve one problem is not a restaurant management system; it is a reconciliation burden.

Core Features That Decide Whether the Investment Pays Off

Restaurant Management System

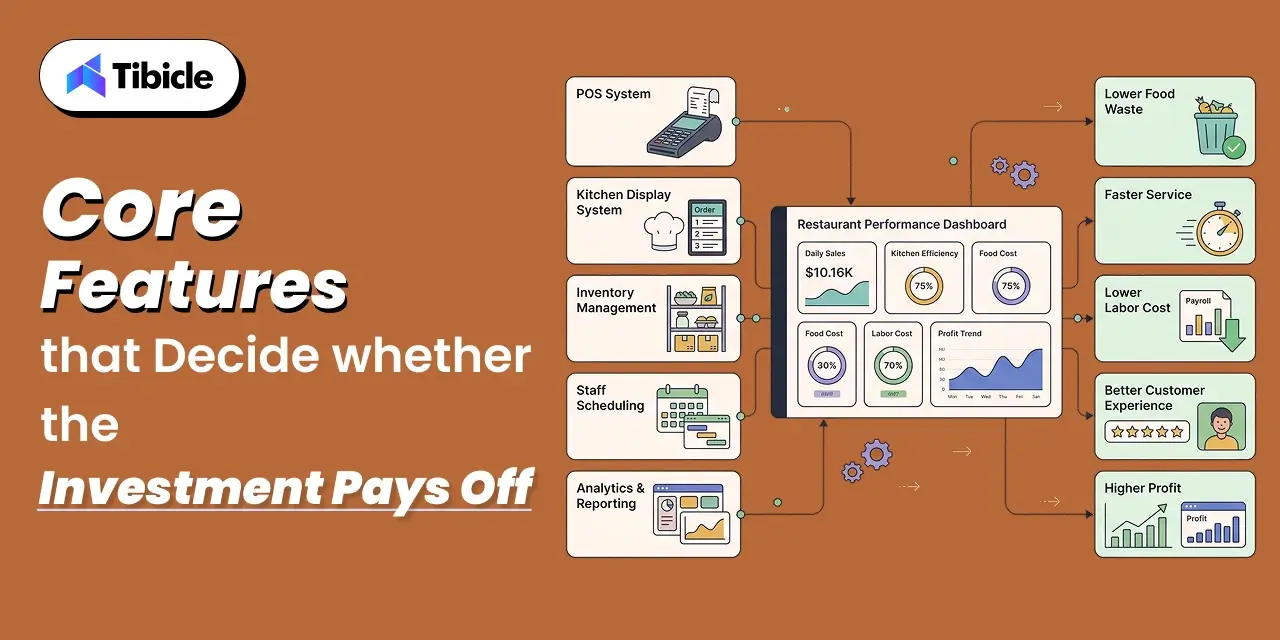
Not every feature in a restaurant management system moves the P&L. A short list does. These are the capabilities worth weighting heavily in any evaluation, because they map directly to cost recovery.

POS Integration Depth in a Restaurant Management System

The restaurant POS system is the center of the stack, so how the other modules connect to the restaurant POS system decides everything downstream. Real-time restaurant inventory management tied to POS sales is categorically different from an end-of-day sync. A restaurant management system that updates inventory once every 24 hours hands you yesterday’s problem. Ask vendors specifically about sync frequency and what happens when the restaurant POS system integration drops mid-service.

Recipe Costing and Food-Cost Visibility

Food and beverage costs run 28% to 35% of revenue for full-service restaurants, and most of the variance hides in the gap between theoretical and actual usage. A system with recipe costing that pulls live invoice pricing gives operators a real cost-per-plate number instead of a stale estimate. Without it, restaurant inventory management stays a counting exercise rather than a cost-control tool, and the restaurant management system never pays back what it promised.

Kitchen Display and Order Routing in a Restaurant Management System

A kitchen display system connected to the restaurant POS system replaces paper tickets with live, routed orders. Orders reach the correct station, get bumped when complete, and stay logged for reporting inside the restaurant management system. The operational payoff shows up during peak service, when missed or duplicated tickets cost more than the software does.

Labor Scheduling Against Sales

With labor consistently at 30% to 35% of revenue, a restaurant management system that schedules staff against forecast sales, not guesswork, directly affects margin. The scheduling module is only useful when it reads from the same sales data the restaurant POS system captures, the same source that drives restaurant inventory management.

Reporting That Is Current, Not Month-End

The operators who struggle most are the ones who learn their food cost was high when the month-end P&L arrives, weeks after the problem occurred. A system earns its cost when it surfaces daily food and labor cost by location, early enough to act on, with restaurant inventory management data feeding the numbers in real time.

Off-the-Shelf vs Custom: How to Read the Trade-Off

Restaurant Management System

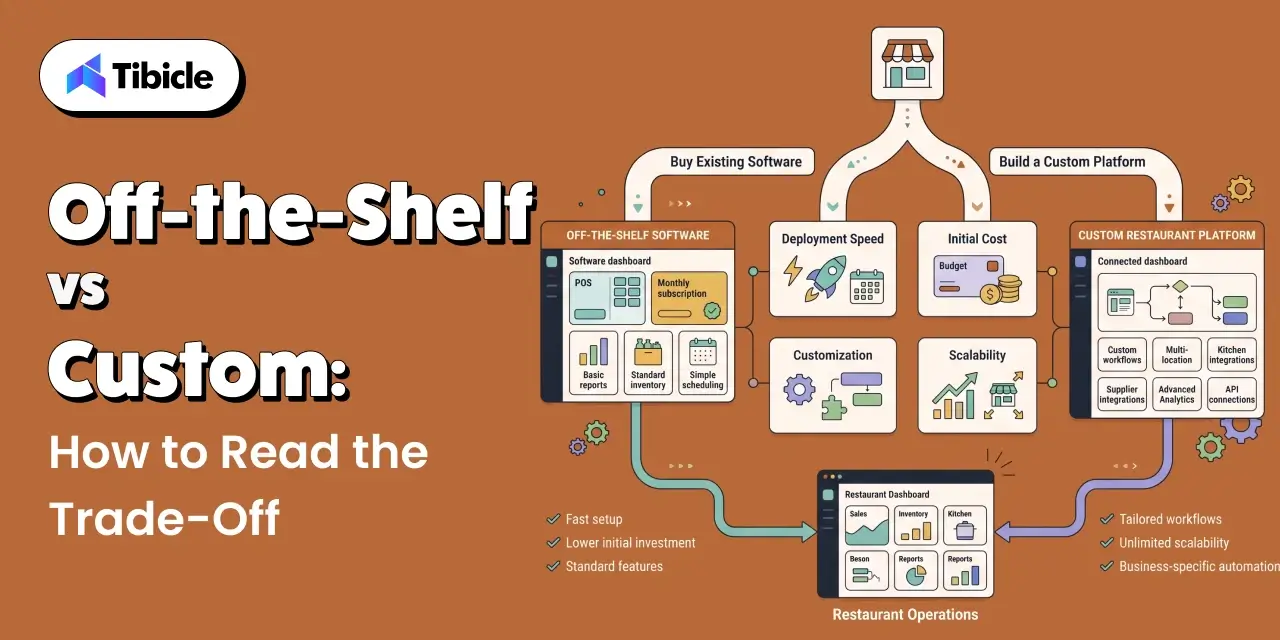
Most restaurants should start with an off-the-shelf system. Platforms like Toast, Square, and Lightspeed cover standard single-location and small-group operations well, deploy quickly, and spread cost across a predictable monthly fee. The decision gets harder when an operation has workflows a standard management system cannot model without expensive workarounds, or a restaurant POS system that resists third-party integration.

A practical way to read the trade-off:

  • Stay off-the-shelf when: you run one location or a small group, your menu and pricing are standard, and you need to launch in weeks. The restaurant POS system and its native modules will cover you.
  • Consider custom when: you run multiple concepts from one kitchen, carry proprietary supplier contracts, need tax logic across regions, or your restaurant inventory management has to behave in a way no off-the-shelf restaurant inventory management module supports.

The tipping point is cost-competitiveness. When the cost of customizing and maintaining workarounds on an off-the-shelf management systems approaches the cost of a purpose-built one, custom stops being the expensive option.

What a Restaurant Management System Costs in 2026

What a Restaurant Management System Costs

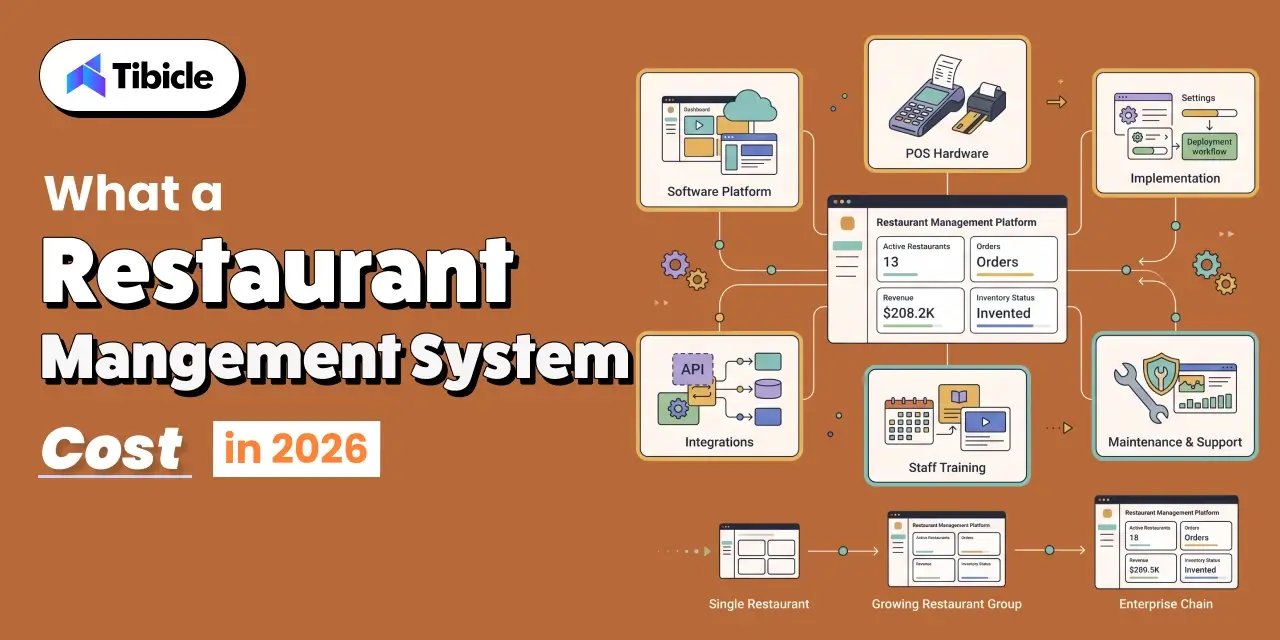
A restaurant management system is priced on published starting rates, but what vendors rarely publish is the total operators actually pay after setup, integration, training, and the tier upgrade that arrives when entry-level features fall short. 

The ranges below reflect publicly available 2026 restaurant management system pricing and should anchor a budget conversation, not replace vendor quotes.

Operation SizeTypical Monthly CostWhat Drives It
Single location$150 to $400 / locationPOS software, basic inventory, one terminal
Small group (3 to 10)$800 to $2,500 / monthMulti-location reporting, deeper inventory, integrations
Enterprise (20+)$5,000+ / monthChain-wide control, forecasting, custom contracts
Custom buildScoped per projectHigher upfront, no per-terminal license, full ownership

Two cost lines operators consistently underestimate: onboarding and setup fees, which can run several hundred dollars per location, and the internal labor cost of integrating the restaurant POS system with restaurant inventory management and the rest of the stack. Budget an extra 15% to 20% on top of the subscription for the first year.

Restaurant Management System ROI: What the Numbers Say for 2026

ROI: What the Numbers Say for 2026

The return on a restaurant management system is a math problem with established inputs, not a leap of faith. Two levers do most of the work in any management system rollout: food cost and labor.

Food Cost Recovery

Restaurants using inventory software report roughly 35% less food waste and a 2% to 5% drop in food-cost percentage. For a restaurant generating $1 million in annual revenue at 32% food cost, cutting food cost by two points saves about $20,000 a year, often more than the software and the labor to run it. Disciplined restaurant inventory management inside a system is where that recovery comes from.

Labor Recovery

Manual stock counting eats management hours every week. Restaurants that move counting into software report an 80% reduction in counting time. Folding restaurant inventory management into a system recovers that management labor and improves accuracy over clipboard estimates at the same time. Most operations see measurable food-cost change within 30 to 60 days of going live.

Payback Timeline

  • Independent restaurants (1 to 2 locations): 3 to 6 month payback is typical.
  • Mid-market groups (3 to 10 locations): often under 90 days when food-cost variance is addressed directly.
  • Enterprise chains: ROI compounds across waste reduction, restaurant inventory management gains, and purchasing efficiency at scale.

The efficiency case is backed at the industry level: among operators who increased technology investment over the past two to three years, 69% say it made operations more efficient and productive.

Risks Operators Underestimate Before They Sign

The system fails more often from implementation than from a bad product. 

  • Integration failure with the existing POS: not every restaurant POS system connects cleanly to every module. Verify API compatibility and sync frequency between the restaurant POS system and restaurant inventory management, and ask for a reference running your exact POS version.
  • Data accuracy in the first 90 days: recipe libraries, unit-of-measure mismatches, and supplier catalog errors corrupt restaurant inventory management data early. Assign one internal owner for data hygiene before go-live.
  • Kitchen staff adoption: the fastest-failing rollouts skip change management. If back-of-house staff do not trust the restaurant inventory management workflow, counts stop happening accurately and the restaurant POS system data loses its value.
  • Outgrowing the platform: choosing a system built for your current size, not your 3-year plan, sets up an expensive migration to a bigger system later. Ask vendors about customers at your target scale.

Restaurant Management System Buyer Checklist: What to Verify Before You Commit

Use these questions to separate a good system demo from a good fit:

  • Does the system integrate with your current restaurant POS system without custom development?
  • Does restaurant inventory management update in real time, or on an end-of-day sync?
  • Can you see daily food and labor cost by location, not just month-end totals, with restaurant inventory management feeding the food-cost number?
  • Does restaurant POS system pricing scale predictably as you add locations?
  • What is the onboarding timeline, and who owns setup and staff training?
  • Does the vendor have reference customers at the scale you are planning for?

When a Custom Restaurant Management System Makes More Sense Than a Platform

Off-the-shelf platforms cover most restaurants well. They fall short for operations with non-standard workflows: dark kitchens running multiple brands from one facility, cloud-kitchen aggregators managing proprietary supplier contracts, and vertically integrated chains with custom procurement logic. For those, the customization required to force-fit a standard system often costs more than a purpose-built system that models the operation as it actually runs.

Tibicle LLP builds AI-powered web and mobile applications, custom POS software, and connected kitchen systems for restaurant operators in that category. Its restaurant tech, custom POS, and kitchen systems services run from a scoped MVP to a full restaurant management system partnership. For deeper context on controlling food cost through software, see Tibicle’s guide to the best restaurant accounting software in 2026.

Conclusion

Choosing a system is not about counting features. It is about selecting the system that removes the most cost from your structure with the least implementation risk. The restaurant POS system anchors the stack, restaurant inventory management protects the food-cost line, and the reporting layer turns both into decisions you can act on before month-end.

Single-location operators have a different right answer than growing groups, and growing groups a different answer than enterprise chains. The decision logic holds across all three: match the restaurant management systems to your cost structure and your growth plan, not to the demo that looked best in the room. 

Ready to map the right restaurant management system to your operation, or scope a custom build? Talk to the Tibicle team.

Frequently Asked Questions

What is a restaurant management system?
A restaurant management system is a connected set of modules- POS, restaurant , kitchen display, inventory management, scheduling, and reporting- that share one data source. The restaurant POS system records sales, and the other modules in the system read from it to control cost and coordinate operations.

How is a restaurant management system different from a POS?
A restaurant POS system records transactions. A restaurant management system uses those transactions to run restaurant inventory management, cost recipes, schedule labor, and report margin. The restaurant POS system captures revenue; the wider system controls cost.

How much does a restaurant management system cost in 2026?
A system for a single location typically costs $150 to $400 per month. Groups of 3 to 10 locations budget $800 to $2,500 monthly. Enterprise system platforms start above $5,000 a month. Add 15% to 20% for setup, restaurant POS system integration, and training in year one.

How long before a restaurant management system pays for itself?
Most operators see measurable food-cost improvement within 30 to 60 days once restaurant inventory management is live. Full payback on such system is typically 3 to 6 months for independents, and often under 90 days for multi-unit groups with high food-cost variance.

When should a restaurant build custom instead of buying?
When workflows are non-standard, multiple kitchen formats, proprietary supplier contracts, or multi-brand aggregation, that a standard system cannot handle without costly workarounds. A custom system becomes cost-competitive above that complexity threshold, especially when restaurant inventory management has to follow rules no vendor supports.

Top 8 eCommerce Trends and Strategies to Watch in 2026

Introduction

Global eCommerce sales are projected to reach $6.88 trillion in 2026, now accounting for 21.1% of all retail sales worldwide (Source: eMarketer/Statista). That number alone is enough to command executive attention. But the top eCommerce trends and strategies in 2026 are not merely about volume, they’re about velocity, intelligence, and the widening gap between brands that adapt and those that don’t. From AI-powered personalization and social commerce to sustainable fulfillment and headless architecture, the strategies defining this year will separate market leaders from laggards for the decade ahead. 

eCommerce trends

The real shift happening in e-commerce growth today is structural. Margin protection, customer retention, and intelligent automation have overtaken raw traffic acquisition as the primary levers of revenue. A staggering 47% of global consumers now identify as “value seekers” who will sacrifice convenience for savings a behavioral shift that fundamentally changes how online retail trends must be approached.

C-level leaders face a trifecta of compounding pressures: rising customer acquisition costs, a persistent 70.19% cart abandonment rate, and a fragmented buyer journey that now spans 5 or more channels: marketplace, social, AI search, brand site, and physical store.

This guide breaks down the eCommerce trends redefining 2026, the eCommerce strategies behind them, and how to evaluate ROI, risk, and vendor fit before committing budget. Whether you are scaling a DTC brand, a B2B ecommerce operation, or a SaaS-enabled commerce platform, these insights are designed to translate directly into planning decisions.

What’s Driving eCommerce Growth in 2026? A Quick Breakdown

eCommerce trends

Before diving into specific eCommerce trends, it helps to understand the macro forces shaping online retail trends this year. The numbers tell a clear story: this market is large, fast-moving, and increasingly complex to navigate.

Market Size and Revenue Trajectory

  • The global eCommerce market is valued at $6.88 trillion in 2026, growing at 7.2% year-over-year, a pace that shows no sign of plateauing.
  • B2B eCommerce is valued at $36.16 trillion and growing at 14.5% CAGR, dwarfing its B2C counterpart and quietly becoming one of the most significant digital transformation stories in business.
  • Mobile commerce now drives 59–60% of all online transactions globally, making it the dominant interface for e-commerce growth, even if conversion rates on mobile still lag behind desktop.

The Buyer Behavior Shift

  • 56.1% of internet users aged 16 and above make weekly online purchases, embedding ecommerce into the rhythmic fabric of daily consumer life.
  • Today’s buyer touches five or more channels before making a purchase, browsing a marketplace, engaging with social commerce content, using AI-powered search, visiting the brand site, and sometimes still walking into a physical store.
  • 39% of US consumers have already used generative AI while shopping, signaling that AI in ecommerce is not a future-state concern, it is a present-tense competitive differentiator.

Insight for C-level leaders: E-commerce strategies built for a linear, single-channel funnel are already obsolete. The brands winning in 2026 are those that treat every touchpoint as a conversion surface.

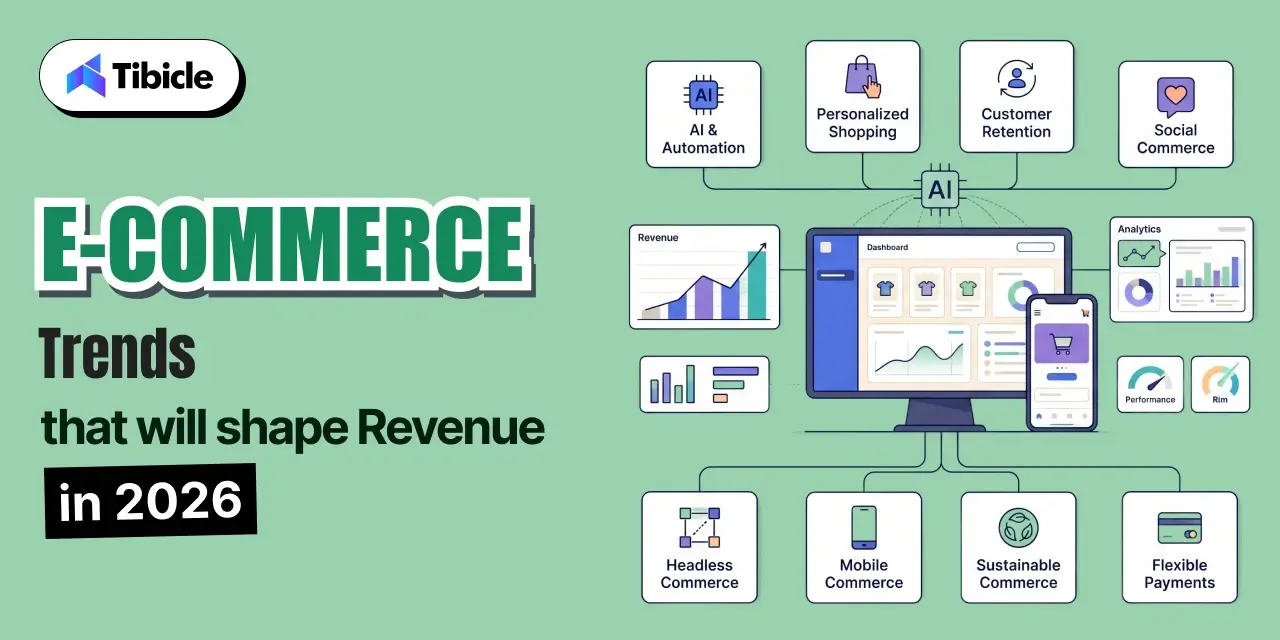
eCommerce trends That Will Shape Revenue in 2026

eCommerce trends

These are not speculative predictions. Each of the following eCommerce trends is backed by market data, behavioral research, and technology deployment patterns already underway. They represent the most consequential shifts for C-level ecommerce strategy this year.

1. Agentic AI and Zero-Click Commerce

The most disruptive of all current eCommerce trends is the rise of agentic AI systems capable of executing multi-step purchase decisions without direct human input. Think of an AI agent that monitors your inventory levels, identifies the best supplier, negotiates a price, and completes the purchase autonomously.

Google’s Universal Commerce Platform (UCP) pilot in the US is an early proof of concept for this vision. As agentic AI becomes embedded in shopping infrastructure, zero-click commerce, where the transaction is completed before a human even opens a browser, will move from novelty to norm in select B2B and subscription categories.

Business impact: Brands must now optimize for machine discoverability, not just human search. Structured product data, API-first infrastructure, and schema markup are no longer technical niceties they are table stakes for AI in eCommerce.

2. Hyper-Personalization Beyond Recommendations

eCommerce personalization has moved well past “customers who bought this also bought.” In 2026, the leading eCommerce strategies layer predictive personalization using real-time behavioral signals, browsing session data, purchase history, location context, and device behavior to serve dynamically personalized storefronts.

Companies using AI-driven eCommerce personalization earn 40% more revenue, according to McKinsey-backed research. Hyper-personalized experiences convert at 6%+ compared to just 2% for generic ones, a threefold difference that represents enormous recoverable revenue for mid-market and enterprise retailers.

AI in eCommerce enables real-time segment-of-one targeting at scale, something that was economically impossible just three years ago. Personalization engines like Klaviyo, Bloomreach, and Nosto are bringing this capability to businesses that previously could only dream of enterprise-grade ecommerce personalization.

3. Retention-Led Growth Over Acquisition Spend

One of the most important eCommerce trends for 2026 is also one of the least glamorous: the strategic pivot away from pure acquisition spend toward retention-led growth. The data is unambiguous.

True brand loyalty dropped from 34% in 2024 to 29% in 2025 (Source: SAP). In an environment where consumers self-identify as value seekers and switching costs are near zero, one-time acquisition is a leaky bucket strategy.

  • Email marketing in e-commerce delivers an ROI of $45 for every $1 spent (Source: Statista), making it one of the highest-return channels available.
  • Automated email flows generate 2,361% better conversion rates than broadcast campaigns, a statistic that underscores the importance of e-commerce personalization in retention mechanics.
  • A three-email cart abandonment sequence recovers 29% of abandoned carts, versus 18% for a single-email approach, a meaningful improvement in addressing the 70.19% cart abandonment rate that plagues online retail.

For C-level leaders, the strategic implication is clear: customer lifetime value optimization and retention-led ecommerce strategies should command a larger share of budget and executive attention in 2026.

4. Social Commerce and Live Shopping at Scale

US social commerce sales rose 26% in 2024 to $71 billion, and the channel is on track to surpass $100 billion by 2026. Livestream commerce, blending entertainment with real-time purchasing, is projected to account for more than 5% of total US ecommerce by 2026.

Social commerce is one of the most significant online retail trends because it collapses the awareness-to-purchase funnel into a single-platform experience. Brands that excel at social commerce are building communities, not just funnels.

Importantly, 86% of consumers still prefer human interaction for complex purchase decisions, which explains why live shopping, with its combination of authenticity and immediacy, outperforms passive product advertising for high-consideration purchases.

Ecommerce strategies for social commerce in 2026 must account for platform-native checkout, creator partnership economics, and the measurement challenges of attributing revenue across omnichannel retail touchpoints.

5. Composable and Headless Architecture as Standard

The monolithic eCommerce platform is losing ground. Composable commerce is an API-first, modular architecture where best-in-class components are assembled rather than bought as a single suite, and is rapidly becoming the architectural default for growth-stage and enterprise businesses.

The e-commerce platform market is growing at 20.49% CAGR, from $13.92 billion in 2026 to a projected $61.83 billion by 2034. Much of this growth is driven by headless architecture and composable infrastructure adoption.

The business case for composable commerce is straightforward: faster time-to-market for new features, lower replatforming cost over a 3–5 year horizon, and easier third-party integrations across ERP, CRM, and CDP stacks. As AI in e-commerce capabilities evolve rapidly, composable stacks also allow brands to swap in new AI tools without rebuilding their entire infrastructure.

6. Mobile Commerce Gap: Traffic vs. Conversion

Mobile commerce is responsible for 74–78% of retail site traffic in 2026, but converts at just 2.1%, compared to 3.5% for desktop. This 1.4 percentage point gap is the single largest addressable revenue opportunity for most online retailers.

US mobile eCommerce is projected to be $744.7 billion in 2026. Even a 0.5% improvement in mobile conversion rate at that scale represents billions of dollars in recovered revenue across the industry.

Closing the mobile commerce conversion gap requires investment in mobile-first UX, accelerated checkout flows, thumb-friendly navigation, and BNPL payment options that reduce purchase friction. For e-commerce strategies in 2026, mobile optimization is not a channel-specific initiative; it is an enterprise-wide revenue imperative.

7. Sustainability, Digital Product Passports, and the Value-Seeker Economy

Regulatory and consumer pressure are converging to make sustainability a structural eCommerce trend, not a brand positioning choice. The EU’s Packaging and Packaging Waste Regulation (PPWR) mandates a 50% maximum space limit starting August 2026, directly impacting fulfillment operations for any brand shipping into European markets.

64% of consumers view shrinkflation as unfair, and 71% would switch brands immediately upon discovering it a sobering data point for any e-commerce growth strategy that involves packaging changes.

Digital Product Passports (DPPs) are emerging as a trust infrastructure for supply chain transparency. As value seekers increasingly scrutinize brand claims, DPPs provide verifiable product-level information from materials sourcing to carbon footprint that builds consumer trust and supports e-commerce personalization by connecting product stories to individual buyers.

8. BNPL, Flexible Payments, and Checkout Optimization

Buy Now Pay Later is no longer a niche eCommerce trend. The global BNPL market is projected to be $28.44 billion in 2026, and digital wallets are expected to handle 51.7–61% of all global eCommerce payments.

Checkout optimization remains one of the highest-ROI investments in ecommerce strategies: optimized checkout design can increase conversion by 35% or more. Combined with BNPL integrations that reduce the psychological barrier of high-ticket purchases, flexible payment infrastructure directly attacks the 70.19% cart abandonment rate.

For C-level eCommerce leaders, the question is not whether to support BNPL and digital wallets; it is how quickly these capabilities can be integrated into the existing checkout flow without introducing technical debt.

How eCommerce trends in 2026 Apply Across Industries

E-commerce trends do not apply uniformly. B2C DTC brands, B2B ecommerce operations, and SaaS-enabled commerce platforms each face distinct implementation priorities and ROI timelines.

B2C / DTC Brands 

Hyper-personalization, social commerce, mobile checkout optimization, BNPL adoption, and retention-led email flows are the dominant priorities, particularly given that true brand loyalty has fallen from 34% to 29% in a single year. Priority trends: AI personalization, cart abandonment recovery, live shopping, and zero-click commerce readiness.

B2B E-commerce 

B2B eCommerce at $36.16 trillion is growing at 14.5% CAGR. Headless architecture, self-serve portals, ERP integration, and composable commerce stacks are becoming the expected standard for B2B buyers. Priority trends: Composable architecture, headless replatforming, API-first ERP/CRM integration, digital product passports.

SaaS-Enabled Commerce Platforms

Platforms embedding AI-driven personalization, BNPL, and omnichannel retail tools natively. The eCommerce platform market is growing at 20.49% CAGR from $13.92B in 2026. Priority trends: Agentic AI capabilities, mobile commerce optimization, payment flexibility, and sustainable packaging compliance.

B2B eCommerce deserves particular attention given its scale: at $36.16 trillion, B2B eCommerce dwarfs B2C. Yet many B2B operations are still running on legacy platforms that cannot support the self-serve portals, AI-driven personalization, and composable architecture that B2B buyers now expect from their digital purchasing experiences.

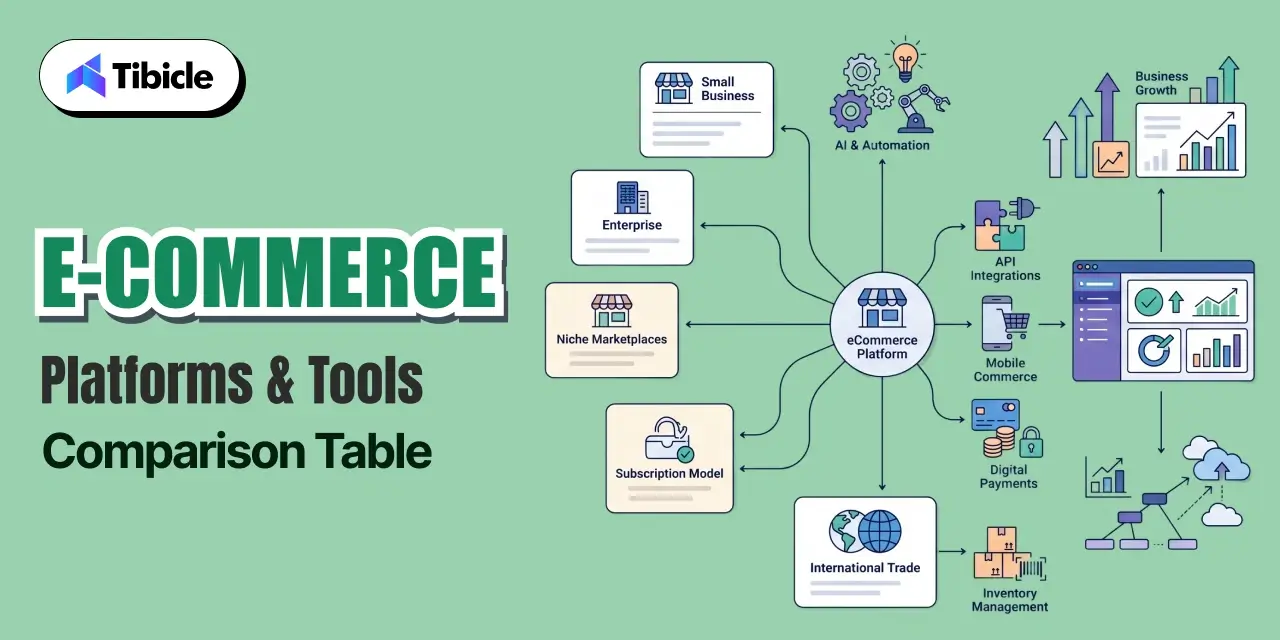
eCommerce Platforms and Tools Comparison Table

Tools Comparison

Choosing the right platform is one of the most consequential e-commerce strategy decisions a business can make. The following comparison covers the major platforms across the dimensions that matter most for 2026 eCommerce growth objectives.

FeatureShopifyWooCommerceBigCommerceMagento/Adobe CommerceCustom-Built
Market Share18–30% (US)23–38% global5%7%Varies
AI PersonalizationNative + appsPlugin-dependentNativeEnterprise-gradeFull control
Headless/ComposableYes (Hydrogen)LimitedYesYesFull flexibility
BNPL IntegrationNativePluginNativePluginCustom
ScalabilityMid-marketSMB-focusedMid-markeEnterpriseEnterprise
Avg. Implementation Cost$5K–$50K$2K–$30K$10K–$80K$50K–$500K+$100K–$1M+

Need help selecting the right platform for your business model? Tibicle’s eCommerce development team can run a technical audit and recommend the best-fit architecture for your 2026 eCommerce strategies.

ROI and Business Impact of Adopting 2026 eCommerce Strategies

Every e-commerce trend listed in this guide carries a measurable business case. Here is how the numbers break down across the highest-priority investment areas.

Revenue Uplift from AI Personalization

  • AI in e-commerce drives a conversion lift of 18–24% (Source: industry benchmarks), meaningful at any revenue scale.
  • Product recommendation engines alone boost sales by up to 59%, making ecommerce personalization one of the clearest ROI stories in online retail trends.
  • Hyper-personalized experiences convert at 6%+ versus 2% for generic ones a 3x conversion rate differential.

AI personalization typically shows measurable revenue lift within 60–90 days of implementation one of the fastest ROI timelines in ecommerce technology investment.

Cost Savings from Composable Architecture

  • Composable commerce reduces replatforming timelines by eliminating the need for full-stack rebuilds when adding new capabilities.
  • Headless architecture removes vendor lock-in costs and enables brands to adopt new AI in eCommerce tools without platform dependency.
  • Lower total cost of ownership (TCO) over a 3-year horizon is a consistent finding among brands that have transitioned from monolithic to composable stacks.

Retention ROI vs. Acquisition ROI

Email marketing ecommerce ROI of $45 per $1 spent makes retention marketing the highest-return channel available to most brands. A three-email cart abandonment recovery sequence recovers 29% of abandoned carts versus 18% for a single email a 61% relative improvement that directly addresses the 70.19% cart abandonment rate.

Quantifying the Mobile Conversion Gap

The 1.4 percentage point gap between mobile commerce (2.1%) and desktop (3.5%) conversion rates represents, at US mobile ecommerce volumes of $744.7 billion, a recoverable revenue opportunity measured in the tens of billions. Even partial gap closure through mobile checkout optimization, BNPL integration, and UX improvements delivers disproportionate ecommerce growth returns.

Pricing Insights: What 2026 eCommerce Investments Actually Cost

Understanding the cost structure of key eCommerce strategies investments is essential for accurate budget planning and ROI modeling.

  • AI personalization tools (Klaviyo, Bloomreach, Nosto): $500–$5,000 per month depending on contact volume and feature set
  • Custom ecommerce development: $100,000–$1M+ depending on complexity, integrations, and scale requirements
  • Headless replatforming for mid-market businesses: $50,000–$300,000 including design, development, and migration
  • BNPL integrations: typically SaaS-based at 2–8% per transaction, no high upfront cost, but meaningful at scale
  • Social commerce setup (platform-native and live shopping): $5,000–$50,000 depending on channel count and production complexity

ROI timelines vary significantly by investment type. AI personalization typically shows measurable lift within 60–90 days. Headless replatforming ROI accrues over 12–36 months as speed-to-market and flexibility advantages compound.

Risks and Challenges in eCommerce for 2026

No eCommerce trends guide would be complete without an honest accounting of the risks associated with rapid investment and platform change.

Data Privacy and AI Compliance

AI in eCommerce generates and processes vast amounts of behavioral data. As privacy regulations evolve across the EU, US states, and APAC markets, ecommerce personalization strategies must be built on first-party data foundations. Brands reliant on third-party data for personalization face structural risk as cookie deprecation continues.

Return Crisis

A 20.4–24.5% ecommerce return rate, combined with a 15.1% return fraud rate, is eroding margins for many online retailers. eCommerce strategies that focus exclusively on acquisition without addressing return economics are building on an unstable foundation. AI-powered size recommendation and product visualization tools are proving effective at reducing return rates by improving purchase confidence.

Over-Reliance on Third-Party Platforms

Social commerce and marketplace-dependent eCommerce growth strategies carry inherent platform risk. Algorithm changes, fee increases, and policy shifts on TikTok, Meta, and Amazon can materially impact revenue overnight. Omnichannel retail diversification and owned channel investment, including email, SMS, and DTC site, serve as the primary risk mitigation strategies.

Shrinkflation Backlash and Brand Trust Erosion

With 71% of consumers ready to switch brands immediately upon discovering shrinkflation, any cost-cutting measure that affects perceived product value carries significant retention risk. Digital Product Passports and radical supply chain transparency are becoming strategic responses to this e-commerce trend, turning potential liability into a trust-building differentiator.

Infrastructure Gaps in Mobile and Composable Migration

The gap between eCommerce trends adoption intention and technical execution capability is significant. Many mid-market brands want composable architecture and mobile commerce optimization but lack the internal engineering resources to execute. Vendor selection and development partner quality become critical risk variables.

Vendor Selection Checklist for eCommerce Technology Partners

Before committing budget to any eCommerce platform or AI personalization tool, C-level leaders should evaluate vendors against the following criteria:

  • Does the vendor support headless and composable architecture with documented API-first integration?
  • Can the platform integrate AI-driven eCommerce personalization natively, or does it require third-party middleware?
  • What is the total cost of ownership (TCO) over three years, including implementation, licensing, and ongoing development?
  • Does the vendor offer BNPL and multi-payment method support out of the box?
  • Can the platform handle 2x to 5x traffic spikes without performance degradation — critical for seasonal online retail trends?
  • What is the vendor’s documented track record with mobile commerce conversion optimization?
  • Does the vendor provide API-first integration with your existing ERP, CRM, and CDP stack?
  • What SLA guarantees does the vendor offer for uptime and support response times?

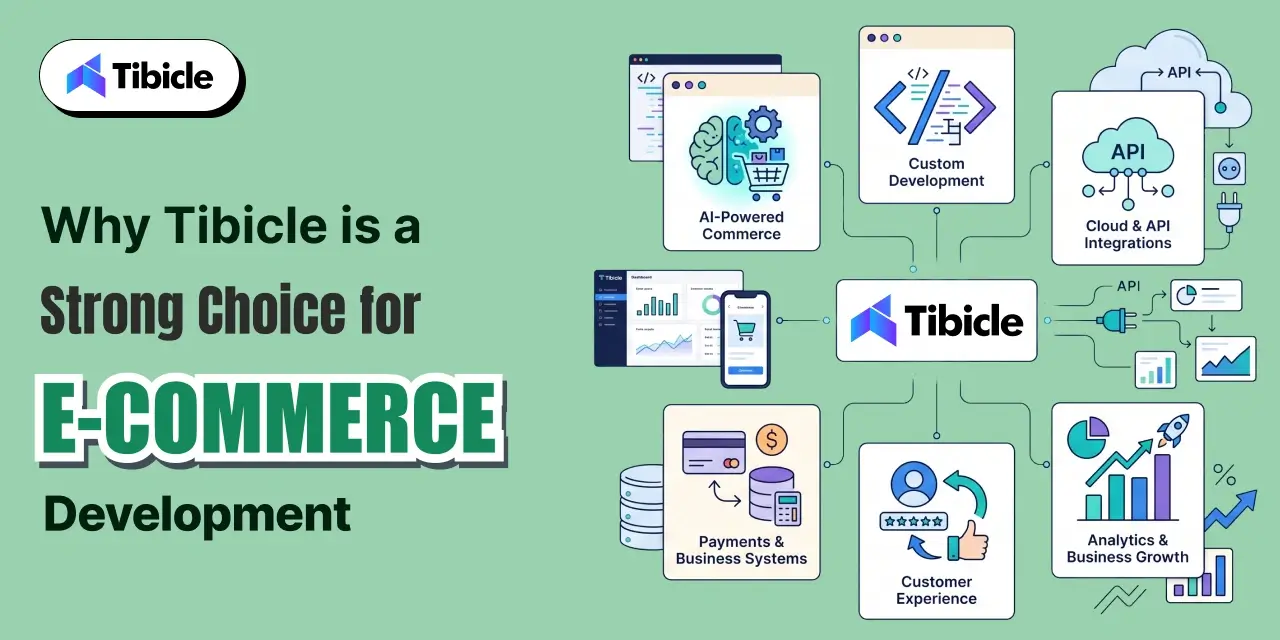
Why Tibicle Is a Strong Choice for eCommerce Development

Development

Businesses pursuing custom-built eCommerce architectures, the most flexible, scalable option in the platform comparison table above, need a development partner with genuine full-stack capability, not a team that adapts templated solutions to fit complex requirements.

Tibicle specializes in custom eCommerce development for businesses that have outgrown off-the-shelf platforms or require bespoke composable architecture. The team’s expertise spans API-first architecture design, AI and ML integration for ecommerce personalization, scalable commerce infrastructure, and cross-platform deployment across B2C and B2B ecommerce environments.

As eCommerce trends in 2026 accelerate toward agentic AI, zero-click commerce, and headless architecture, having a development partner that can build and iterate on custom infrastructure rather than waiting for a platform vendor’s release roadmap is a meaningful competitive advantage.

Talk to Tibicle’s eCommerce engineering team to scope your 2026 build. Whether you’re evaluating replatforming, AI personalization integration, or a ground-up custom eCommerce build, the team can assess your requirements and recommend an architecture that fits your growth trajectory.

Conclusion

The $6.88 trillion eCommerce market in 2026 is not rewarding those who grow fastest, it is rewarding those who grow most intelligently. The ecommerce trends explored in this guide share a common theme: sustainable ecommerce growth is now built on retention, personalization, flexible infrastructure, and a precise understanding of where margin is being lost.

The 70.19% cart abandonment rate is recoverable revenue. The 40% revenue uplift from AI personalization is achievable. The mobile commerce conversion gap is closeable. The question is which eCommerce strategies get prioritized, sequenced, and resourced in 2026.

C-level leaders who treat this year’s ecommerce trends as a strategic agenda, not a technology checklist, will be positioned to capture disproportionate share of online retail growth in the years ahead.

Looking for a technology partner to build or scale your ecommerce platform? Get in touch with Tibicle for a free architecture consultation. Our team works with growth-stage and enterprise businesses navigating the full spectrum of 2026 ecommerce trends.

Frequently Asked Questions

What are the biggest eCommerce trends in 2026?
The biggest eCommerce trends in 2026 include agentic AI and zero-click commerce, hyper-personalization powered by AI in eCommerce, retention-led growth strategies, social commerce and live shopping at scale, composable and headless architecture adoption, mobile commerce conversion optimization, sustainability and Digital Product Passports, and BNPL-driven checkout optimization. These eCommerce trends are unified by a shift from volume-led to margin-led eCommerce growth.

How much does AI personalization increase eCommerce revenue?
Companies using AI-driven eCommerce personalization earn 40% more revenue according to McKinsey-backed research. Product recommendation engines boost sales by up to 59%, and hyper-personalized experiences convert at 6%+ compared to 2% for generic experiences. AI personalization in eCommerce typically shows measurable revenue lift within 60–90 days of deployment.

What is agentic AI in eCommerce trends?
Agentic AI in eCommerce refers to AI systems capable of executing multi-step purchase decisions autonomously, without direct human input. These agents can monitor inventory levels, compare supplier pricing, and complete purchases, enabling zero-click commerce. Google’s Universal Commerce Platform (UCP) pilot is a current real-world example of agentic AI being deployed in online retail contexts. Brands must optimize structured product data and API-first infrastructure to be discoverable by AI agents.

How do I choose the right eCommerce trends for my business?
Choosing the right eCommerce trends for 2026 requires evaluating eight criteria: composable and headless architecture support, native AI personalization capability, three-year total cost of ownership (TCO), BNPL and multi-payment support, traffic spike scalability, mobile commerce conversion track record, API-first ERP and CRM integration, and vendor SLA guarantees. The right platform depends on business model (B2C vs. B2B ecommerce), current scale, and growth trajectory. Mid-market businesses often find mid-range platforms sufficient; enterprise and custom-built solutions suit businesses with complex, high-volume ecommerce requirements.

What is the average cart abandonment rate in eCommerce in 2026?
The average cart abandonment rate in eCommerce in 2026 is 70.19%, meaning roughly 7 in 10 shoppers who add items to their cart do not complete the purchase. This represents one of the largest sources of recoverable revenue in online retail. Three-email automated cart recovery sequences recover 29% of abandoned carts, versus 18% for single-email approaches. Checkout optimization, BNPL payment options, and ecommerce personalization are the most effective eCommerce strategies for reducing cart abandonment rates.

How AI Powered Ecommerce is Transforming Businesses in 2026

Introduction

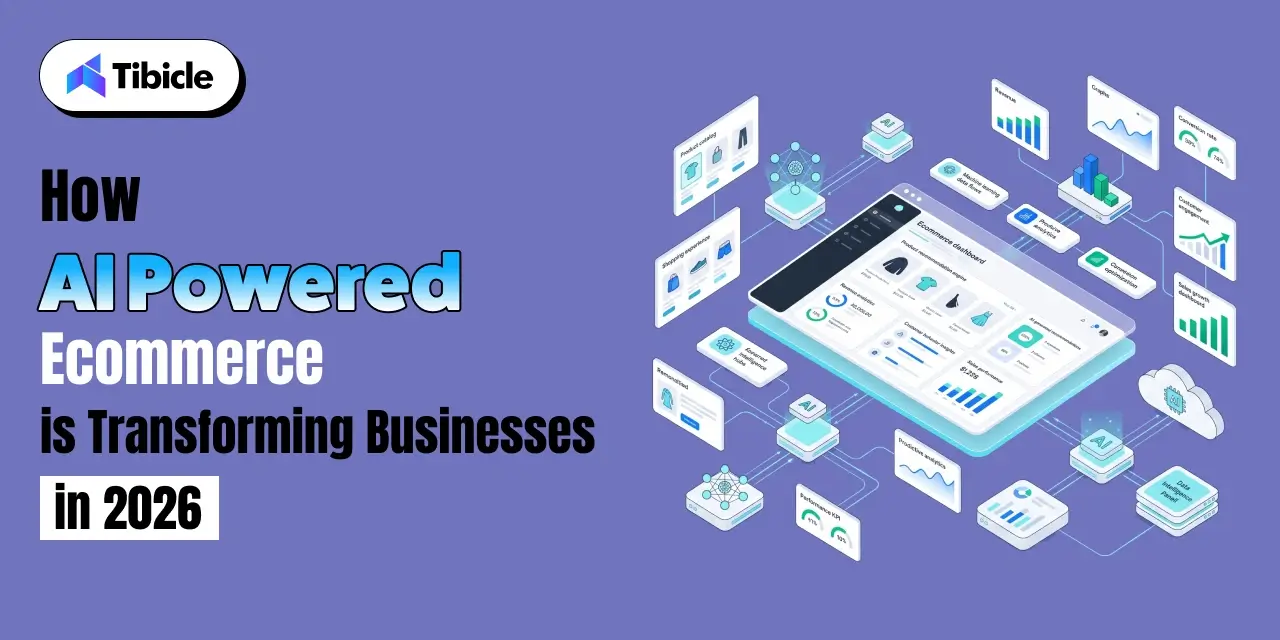
The ai powered ecommerce market crossed $10.5 billion in 2026 and 84% of ecommerce businesses now rank AI as their top strategic priority. That is not a pilot-stage statistic. It reflects a market that has moved from experimentation to operational infrastructure, where AI sits inside search, pricing, logistics, and customer support stacks across companies of every size.

ai powered ecommerce

For C-suite leaders, the question is no longer whether to adopt ai in ecommerce. Most competitors already have. The real question is where to invest first, which capabilities deliver measurable returns, and what it actually costs to build or buy the right solution.

This guide breaks down the core use cases, ROI benchmarks, pricing models, risks, and vendor selection criteria that matter for decision-makers evaluating ai powered ecommerce in 2026.

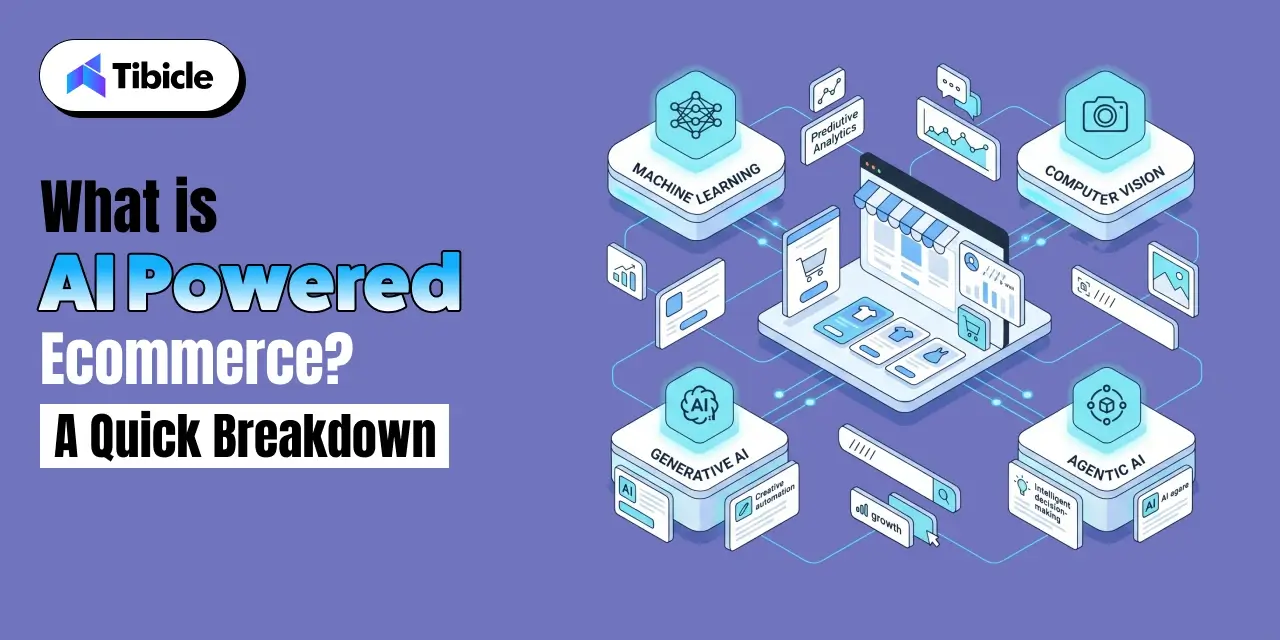
What Is AI Powered Ecommerce? A Quick Breakdown

ai powered ecommerce

AI powered ecommerce is the integration of machine learning, natural language processing, computer vision, and generative AI into the systems that run online retail. The goal is not automation for its own sake. Each layer serves a specific commercial function increasing revenue, reducing operational cost, or improving customer experience at scale.

Artificial intelligence ecommerce is now built into platforms most retailers already use, from product discovery to post-purchase logistics. The shift from rule-based to AI-driven operations is the defining infrastructure change of 2026. For a broader look at how this connects to retail tech strategy, see our guide on custom eCommerce development for retail businesses.

Core Technologies Behind AI Ecommerce Solutions

These are the five technology layers that power modern ai ecommerce solutions and what each one does in a retail environment:

  • Machine Learning (ML): Processes transaction and behavioral data to generate product recommendations, predict churn, and optimize pricing in real time.
  • Natural Language Processing (NLP): Powers intent-aware search, conversational chatbots, and review analysis that surface buying signals from unstructured text.
  • Computer Vision: Enables visual search and product tagging shoppers upload images to find matching items without typing a keyword.
  • Generative AI: Produces dynamic product descriptions, personalized email copy, and on-demand visual assets at scale.
  • Agentic Commerce: Executes multi-step tasks autonomously, reordering inventory, adjusting bids, or escalating support tickets without human intervention at each step.

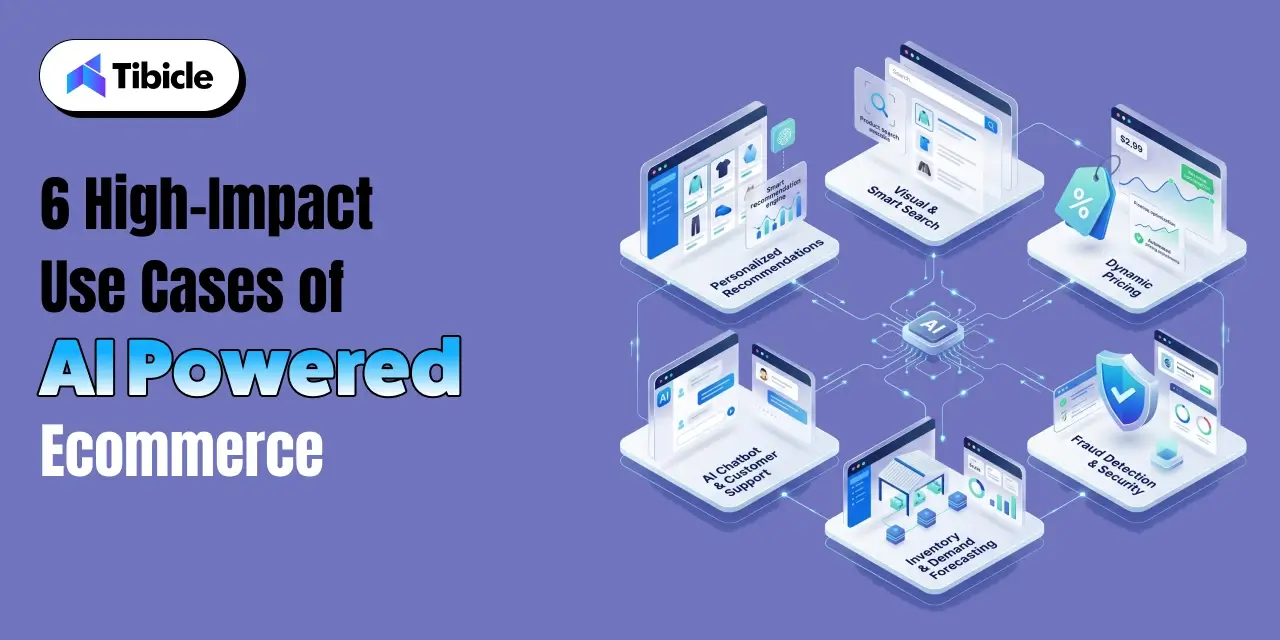
6 High-Impact Use Cases of AI Powered Ecommerce

ai powered ecommerce

The return on ai powered ecommerce investment concentrates in a small number of high-leverage areas. These six use cases account for the majority of measurable business impact reported by retailers in 2025 and 2026.

Hyper-Personalized Product Recommendations

AI-driven personalized product recommendations contribute between 25% and 35% of total ecommerce revenue for retailers who have fully implemented them. The mechanism is direct: when a shopper sees products matched to their behavior, purchase history, and real-time session data, average order value increases and the likelihood of repeat purchase rises.

The customer lifetime value impact compounds over time. Recommendation engines do not just increase the current order they shape return visit behavior. Retailers running ML-driven recommendation stacks report meaningful gains in both AOV and 90-day retention rates compared to rule-based or manual merchandising approaches.

Intent-Aware Search and Product Discovery

Keyword-based site search is being replaced by semantic search that reads shopper intent rather than matching strings. A shopper searching for “something to wear to a beach wedding” now receives contextually relevant results rather than a literal keyword match.

Visual search has scaled faster than most retailers expected. Google Lens processed over 20 billion searches per month in 2025. Retailers with visual search capabilities capture high-intent shoppers who know what they want but cannot describe it in text a segment that converts at above-average rates once friction is removed.

Dynamic Pricing and Margin Optimization

Fewer than 15% of retailers currently use AI-driven dynamic pricing ecommerce tools, yet those that do report margin gains of 5% to 10%. The gap represents a competitive opportunity that is closing as pricing AI becomes more accessible through SaaS platforms.

Dynamic pricing tools ingest competitor prices, demand signals, inventory levels, and time-based patterns to adjust prices in real time. The result is better margin capture during high-demand windows and reduced excess inventory through price-driven clearance without manual merchandiser intervention.

AI-Driven Customer Support and Conversational Commerce

64% of consumers plan to use AI chatbots ecommerce tools for shopping assistance by 2026. More immediately, AI systems already handle 70% of initial customer interactions for retailers who have deployed conversational commerce tools.

The operational impact is measurable on two lines: support cost reduction through deflection of tier-1 queries, and revenue contribution through guided selling. Chatbots that surface product recommendations during support conversations consistently increase order attach rates versus static FAQ systems. See how this connects to broader customer experience automation strategies.

Predictive Inventory and Supply Chain Management

AI reduces excess inventory holdings by up to 20% and cuts supply chain costs by up to 10% for retailers with sufficient historical data to train demand forecasting models. The mechanism is demand signal aggregation combining sales history, weather data, promotional calendars, and supplier lead times into a single forecast.

Predictive analytics retail applications in supply chain directly reduce the two largest inventory costs: overstock write-downs and stockout-driven lost sales. Both have measurable impact on gross margin, making supply chain AI one of the highest-ROI deployment areas in ecommerce automation.

Fraud Detection and Payment Intelligence

AI fraud detection analyzes transaction patterns in real time device fingerprint, behavioral biometrics, purchase velocity, and network signals to flag suspicious transactions before authorization. The speed advantage over rule-based systems is decisive: AI systems evaluate hundreds of signals per transaction in milliseconds.

The commercial outcome is reduced chargebacks, lower false-positive rates that would otherwise block legitimate orders, and reduced manual review costs. Payment intelligence systems also identify friendly fraud patterns that standard chargeback rules miss, protecting margin in high-volume categories.

AI Powered Ecommerce ROI: What the Numbers Say

ai powered ecommerce

ROI data for ai powered ecommerce now comes from large enough sample sizes to be reliable benchmarks, not anecdotal case studies. The figures below reflect multi-retailer studies and are directional validate against your own baseline before building a business case.

Revenue and Conversion Metrics

69% of retailers report measurable revenue lift from AI deployment. AI-referred shoppers convert at a rate 31% higher than organic traffic across comparable segments. AI personalization drives up to 40% revenue increase versus competitors who rely on manual merchandising or rules-based recommendation engines.

The conversion rate optimization ai effect is most pronounced in three areas: search-to-cart rates, recommendation click-through, and post-add-to-cart completion. Retailers who personalize all three stages see compounding improvement rather than isolated gains. For benchmarks specific to your category, see our ecommerce performance metrics guide.

Cost Reduction and Operational Efficiency

72% of AI-adopting retailers report cost reductions following deployment. Logistics savings range from 5% to 20% depending on network complexity and model maturity. Inventory reductions of up to 35% have been reported in categories with stable SKU structures and clean historical data.

Customer support cost reduction is the fastest-payback deployment area for most mid-market retailers. Deflecting 50% of tier-1 queries to AI without customer satisfaction loss directly reduces headcount requirements and seasonal support scaling costs.

ROI Timeline Expectations

Organizations earn an average of $1.41 for every $1 spent on AI, according to Snowflake’s 2025 industry study. Most organizations achieve satisfactory ROI within 2 to 4 years of deployment. Only 6% report ROI in under 12 months.

The variables that compress timeline most are: data readiness, deployment scope, and internal capability to act on AI outputs. For C-level planning purposes, model a 2-year break-even and treat anything faster as upside.

Pricing Models for AI Ecommerce Solutions

Pricing for ai ecommerce solutions varies significantly based on deployment model, integration complexity, and the level of customization required. The following frameworks apply to mid-market and enterprise buyers evaluating investments in 2026.

SaaS Subscription vs. Custom Development

SaaS platforms like Shopify’s AI features or BigCommerce’s integrated tools operate on monthly subscription models. Deployment is faster weeks rather than months and requires less internal technical resource. The tradeoff is standardization: SaaS AI modules are designed to work for a broad range of merchants, not for the specific business logic of any one retailer.

Custom-built AI tools carry higher upfront investment but deliver alignment with proprietary data structures, pricing rules, and operational workflows that SaaS modules cannot accommodate. For retailers with complex catalogs, multi-region operations, or proprietary fulfillment systems, custom development often produces better long-term unit economics despite the higher entry cost. Our guide on custom vs. off-the-shelf software for ecommerce covers this tradeoff in detail.

Cost Variables That Affect Total Investment

Four variables determine total AI investment beyond the quoted platform or development cost:

  • Data infrastructure readiness: Disconnected or low-quality data requires cleaning and architecture work before AI models can be trained. This is frequently the largest underestimated cost.
  • Integration complexity: Connecting AI tools to existing ERP, CRM, POS, and CDP systems adds engineering cost proportional to system fragmentation.
  • Team training and change management: AI outputs require human interpretation and action. Upskilling commercial and operations teams is a real cost that affects time-to-value.
  • Ongoing optimization: Models degrade without retraining. Budget for quarterly model review and continuous improvement as part of total cost of ownership.

Ballpark ranges for mid-market implementations run from $50,000 to $250,000 in year one, depending on scope. Enterprise builds with custom model development and multi-system integration typically begin at $300,000 and scale with complexity.

AI Powered Ecommerce Platform Comparison

Three deployment approaches cover most buyer profiles evaluating ai powered ecommerce in 2026.

FeatureSaaS Platforms (Shopify, BigCommerce)Custom AI SolutionsHybrid Approach
Deployment SpeedFastSlowMedium
CustomizationLimitedFullModerate
Cost (Year 1)Low to MidHighMid to High
ScalabilityPlatform-dependentHighHigh
Data OwnershipSharedFullFull
Best ForSMBs, fast launchesEnterprise, niche needsMid-market scaling

SaaS platforms are the right starting point for SMBs and retailers running standard catalog structures who need AI capabilities without a large internal engineering team. They offer the fastest path to value in personalization and search.

Custom AI solutions suit enterprise buyers with complex product catalogs, proprietary data advantages, or operational requirements that no off-the-shelf tool supports. The higher year-one cost is offset by full data ownership and the ability to build competitive moats from proprietary AI behavior.

Hybrid approaches where a SaaS platform handles standard functions and custom AI handles differentiated use cases are the most common architecture for mid-market retailers scaling beyond what platforms offer without committing to full custom builds.

Key Risks and Challenges of AI in Ecommerce

Ecommerce Implementation

89% of retailers are currently using or testing AI in ecommerce. Only 33% have fully implemented it. The gap is not strategic hesitation it is operational. The risks below are the most common blockers between pilot and production.

Data Quality and Integration Gaps

AI models perform in direct proportion to data quality. Fragmented data across legacy systems, inconsistent SKU structures, and incomplete customer records are the primary reason AI pilots fail to scale. Before evaluating vendors, audit data completeness across transaction history, product catalog, and customer identity resolution.

Integration gaps between AI tools and existing infrastructure, particularly between recommendation engines and inventory systems, create scenarios where AI surfaces out-of-stock products or mispriced items. These are customer experience failures with direct revenue impact. Our ecommerce data architecture guide covers the audit process in detail.

Consumer Trust and AI Transparency

Only 14% of consumers currently trust AI to make purchasing decisions autonomously on their behalf. This is a meaningful constraint on how far agentic commerce can advance in the near term. AI that surfaces recommendations or personalizes content is accepted. AI that takes action without explicit customer approval faces adoption resistance.

Privacy compliance adds a regulatory layer. GDPR in Europe and a growing body of US state-level privacy law govern how customer behavioral data can be collected, stored, and used for AI training. Any ai ecommerce solution that processes EU or California resident data requires explicit compliance architecture, not a checkbox.

Talent and Change Management

Internal skill gaps are the most consistent challenge reported by retailers who have deployed AI. The problem is not just technical it is organizational. AI outputs require commercial judgment to act on. A demand forecasting model that flags overstock requires a buyer who understands how to respond. A pricing AI that recommends a margin increase requires a category manager who trusts the signal.

Cross-functional AI literacy at the executive level is the change management priority that correlates most strongly with successful AI deployment.

Vendor Selection Checklist for AI Powered Ecommerce

Use this checklist before issuing an RFP or entering vendor conversations. It identifies the questions that separate vendors with real deployment capability from those with strong sales materials.

  1. Pre-built vs. custom build: Does the vendor offer pre-built ecommerce AI modules, or does every capability require a full custom build from scratch?
  2. Data integration depth: What integration capabilities exist across CRM, ERP, CDP, and POS and which connections are native versus requiring custom middleware?
  3. Implementation timeline: What is the average timeline for businesses at your revenue scale and catalog complexity?
  4. Scalability: Can the solution scale across multiple geographies, currencies, and product catalog structures without re-implementation?
  5. ROI benchmarks: What performance data does the vendor provide from deployments comparable to your business in size, category, and data maturity?
  6. Ongoing support: What is included post-launch model retraining cadence, optimization review, and SLA for performance degradation?
  7. Data privacy compliance: How does the vendor handle GDPR and US state-level regulations, and who owns the data used to train models?

Add one question specific to your vertical the answer will separate vendors who understand your category from those pitching a generic platform.

Top AI Ecommerce Tools and Platforms in 2026

The following categories represent the primary tool types buyers evaluate when building an ai powered ecommerce stack. This is a starting point for research, not a ranked review.

  • Personalization Engines: Dynamic Yield, Bloomreach, Nosto ML-driven recommendation and content personalization platforms with strong ecommerce track records.
  • Conversational AI: Gorgias, Tidio, Intercom chatbot and live-chat tools with ecommerce integrations for cart recovery, product guidance, and post-purchase support.
  • Dynamic Pricing Tools: Prisync, Wiser, BlackCurve competitive price monitoring and AI pricing recommendation tools for mid-market and enterprise retail.
  • Visual Search and Discovery: Google Vision API, Syte, Visenze image recognition and visual search infrastructure connecting shopper-uploaded images to product catalog matches.
  • All-in-One Commerce Platforms with AI Built In: Shopify, BigCommerce, Salesforce Commerce Cloud platforms that integrate AI across search, recommendations, and fulfillment within a single managed environment.

Evaluate each category against your highest-priority use case first. Deploying across all categories simultaneously without sequencing increases implementation risk without accelerating ROI.

Why Tibicle Is a Strong Choice for AI Powered Ecommerce Implementation

Ecommerce Implementation

Tibicle builds custom AI ecommerce solutions for mid-market and enterprise clients where standard SaaS platforms reach their ceiling. If the vendor checklist above surfaces gaps in pre-built options catalog complexity, integration depth, or data ownership requirements custom development is the correct path.

Tibicle’s delivery model covers the four areas that determine implementation success: custom AI solution development tied to specific business logic, ecommerce platform integration across CRM, ERP, POS, and CDP systems, data architecture designed for scalability across markets and SKU volumes, and a proven engagement model for clients who need AI to fit their operation rather than adapting their operation to fit a platform.

Retailers evaluating ai ecommerce solutions for 2026 implementation can start with a scoping consultation with Tibicle to identify which use cases match your data maturity and where custom development delivers the best return.

Conclusion

The strategic decision for 2026 is not whether to invest in ai powered ecommerce 84% of competitors are already moving. The decision is where to start and who builds it. Retailers who sequence deployment around their highest-ROI use case, with data architecture in place, reach the $1.41-per-dollar return faster than those who run broad platform experiments without prioritization.

The 69% revenue lift benchmark and 31% conversion improvement are achievable for businesses that match deployment scope to data maturity. The gap between piloting AI and running it as operational infrastructure is closed by the right implementation partner.

Contact Tibicle today to map your AI ecommerce roadmap and identify the highest-return starting point for your business.

Frequently Asked Questions

What is AI powered ecommerce and how does it work?
AI powered ecommerce is the use of machine learning, NLP, computer vision, and generative AI to automate and personalize online retail operations. It works by processing large volumes of behavioral, transactional, and operational data to generate outputs product recommendations, dynamic prices, demand forecasts, chatbot responses that improve revenue, reduce cost, or improve customer experience faster than manual or rules-based systems can.

How much does it cost to implement AI in an ecommerce business?
Cost depends on deployment model and scope. SaaS AI tools built into platforms like Shopify or BigCommerce are available within standard subscription tiers or as low-cost add-ons. Point solutions for personalization or search run $500 to $5,000 per month depending on traffic volume. Custom AI development for mid-market retailers typically starts at $50,000 to $250,000 in year one, with enterprise implementations beginning at $300,000 and scaling with integration complexity and catalog size.

What ROI can businesses expect from AI powered ecommerce in 2026?
The average return is $1.41 for every $1 spent on AI, based on Snowflake’s 2025 industry data. 69% of retailers report measurable revenue lift, and AI-personalized shoppers convert at 31% higher rates than non-personalized traffic. Most organizations reach satisfactory ROI within 2 to 4 years. Faster timelines correlate with data readiness and deployment scope.

What are the biggest risks of using AI in ecommerce?
The three primary risks are data quality gaps that cause AI models to underperform or surface incorrect outputs, consumer trust constraints that limit how far autonomous AI purchasing can advance, and internal talent gaps that prevent teams from acting on AI-generated insights. Privacy compliance particularly GDPR and US state-level data regulations is a regulatory risk that must be addressed in the architecture, not retrofitted after deployment.

How do I choose the right AI ecommerce vendor for my business?
Start with the vendor selection checklist above. Prioritize vendors with documented deployments at comparable business scale, native integration capabilities for your existing tech stack, and clear data ownership terms. Verify ROI benchmarks against businesses in your category and revenue range, not general market averages. For complex catalogs or proprietary operational requirements, evaluate custom development against SaaS options before defaulting to whichever platform has the strongest marketing presence.

What Is a Progressive Web App? Beginner’s Guide

Introduction

The global progressive web app market was valued at USD 3.53 billion in 2024 and is projected to hit USD 21.44 billion by 2033, growing at a 18.98% CAGR. Straits Research Yet most businesses still split their budgets across separate iOS and Android builds two codebases, two maintenance cycles, two app store approval processes when a single progressive web app can serve both platforms from one deployment.

progressive web app

This guide covers what a progressive web app is, how it works, real cost and ROI data, a full comparison with native apps, known risks, and a vendor selection checklist for 2026.

What Is a Progressive Web App?

Core Definition

A progressive web app is a browser-based application built with HTML, CSS, and JavaScript that behaves like a native mobile app. It can be installed on a user’s home screen, works offline, and sends push notifications without requiring distribution through the Apple App Store or Google Play.

PWAs show a 70% increase in session length and a 20% increase in page views per session compared to traditional web apps. ResearchGate, cited by Straits Research The architecture behind this performance is what separates a progressive web app from a standard website.

How Does a Progressive Web App Work?

progressive web app

A progressive web app is built on four technical components working together. Each layer handles a specific function, and together they produce the app-like experience users expect on mobile.

What Are Service Workers?

Service workers are background scripts that run separately from the main browser thread. They manage PWA caching, handle offline access, and enable background sync. When a user opens a progressive web app without internet access, the service worker serves cached content instead of showing an error, this is what makes an offline web app possible.

What Is a Web App Manifest?

The web app manifest is a JSON configuration file that defines the app’s name, icon, theme color, and display behavior. It tells the browser how to present the installable web app, whether in full-screen, standalone, or browser mode. This file is what enables home screen installation without an app store.

Why Does HTTPS Matter for a PWA?

HTTPS is mandatory for a progressive web app. All data transmitted between the browser and server must be encrypted. This is not optional browsers block service worker registration on non-secure origins. It also establishes the trust baseline that search engines and users expect.

What Is App Shell Architecture?

App shell architecture loads a minimal set of HTML, CSS, and JavaScript on the first request, just enough to render the UI instantly. Content is then loaded dynamically as the user interacts. This approach cuts perceived load time and improves Core Web Vitals scores, both of which affect search rankings.

PWA Component Overview

PWA ComponentFunctionBusiness Impact
Service WorkerCaching, offline access, background syncKeeps app functional without internet
Web App ManifestDefines name, icon, display modeEnables home screen installation
HTTPS LayerEncrypts all data in transitSecurity compliance, browser trust
App Shell ArchitectureMinimal UI load, dynamic contentFaster perceived load, better Core Web Vitals

Why Businesses Are Adopting Progressive Web Apps in 2026

progressive web app

Cost Reduction with a Single Codebase

PWA development costs 30%-75% less than building separate native apps. Glance Research, cited by Newly The average PWA development project runs $8,000–$25,000, compared to $50,000–$150,000+ for dual native builds across iOS and Android. For early-stage businesses and mid-market companies, that gap often determines whether a product launches on schedule or gets delayed by 12 months.

A single codebase app also reduces ongoing maintenance overhead. One update deploys across all platforms simultaneously, no separate release cycles, no app store approval queues.

Higher User Engagement and Retention

The business case for progressive web app development is backed by documented results across industries:

  • Pinterest saw a 60% increase in engagement after launching its PWA.
  • Twitter Lite reported a 65% increase in pages per session and a 75% increase in tweets sent.
  • Starbucks doubled its daily active users after deploying a PWA that was 99.84% smaller than its iOS app.

These are not edge cases. They reflect what happens when load time drops, offline access is restored, and the friction of app store downloads is removed.

SEO and Discoverability Advantage

A progressive web app is fully indexable by search engines. Native apps are not as they sit behind app store walls that Google’s crawler cannot access. For businesses where organic search drives acquisition, this distinction matters. PWA development gives you a cross-platform app that also functions as a discoverable web property.

Progressive Web App Use Cases by Industry

E-commerce and Retail

E-commerce holds 31.4% of the PWA market share in 2025. Coherent Market Insights Faster load times, offline browsing, and push notifications for cart recovery make PWAs well-suited for retail. Reducing page load time by one second can lift conversions by up to 7%, a metric that compounds across high-traffic stores.

Media and Content Publishing

Forbes deployed a progressive web app and reported significant improvements in session depth and ad revenue per user. Media publishers benefit from offline reading mode and fast article load times, both of which reduce bounce rate and increase time-on-page, two signals that affect ranking.

Travel and Hospitality

Travel companies using PWAs have reported a 3x conversion rate increase and 180% retention improvement. Clutch.co Offline itinerary access and fast booking flows are the primary drivers. Users in airports or low-connectivity areas can complete bookings without the experience breaking.

B2B SaaS and Enterprise Tools

Enterprise teams use PWAs for offline dashboards, real-time sync across devices, and field sales tools that function without a stable internet connection. The cross-platform app model means a sales rep on Android and a manager on iOS both use the same product, updated at the same time.

Progressive Web App vs Native App: Full Comparison

progressive web app

Feature and Cost Breakdown

ParameterProgressive Web AppNative App
Development Cost$8K–$25K (single codebase)$50K–$150K+ (per platform)
Time to Market4–8 weeks12–24 weeks
MaintenanceSingle update, instant deploySeparate updates per OS, store approval
Offline SupportPartial (service worker caching)Full
Device AccessLimited (camera, GPS, push)Full hardware access
App Store PresenceOptionalRequired
SEO VisibilityFully indexableNot indexable
Performance GapUnder 10% for standard business apps [Brainhub 2025]Superior for graphics-heavy apps

When to Choose a Progressive Web App

Choose a progressive web app when your product serves a broad cross-platform audience, organic search is part of your acquisition strategy, budget or timeline is a constraint, or your core features do not require deep hardware access. E-commerce, SaaS dashboards, content platforms, and service-based businesses typically fit this profile.

When Native Still Wins

Native development remains the right call for applications that require Bluetooth, NFC, AR, or advanced camera control. Gaming apps, financial apps with biometric authentication, and augmented reality tools hit the performance ceiling of what a browser-based app can currently deliver. For those use cases, a native build or React Native hybrid is the stronger choice.

Progressive Web App Development Cost Breakdown

Development

Cost by Complexity Tier

PWA development cost scales with scope. Three tiers cover most business use cases:

  • Basic PWA: $8,000–$12,000. Covers simple informational apps, content sites, or lead-gen tools with standard PWA features.
  • Mid-range PWA: $15,000–$25,000. Covers e-commerce stores, SaaS dashboards, and tools with third-party integrations.
  • Enterprise PWA: $30,000–$60,000. Covers complex API integrations, custom backend architecture, and high-traffic production environments.

Cost Variables

Four factors move the number up or down within each tier:

  • UI/UX design complexity: custom design systems cost more than component libraries.
  • Third-party integrations: payment gateways, CRMs, ERPs, and analytics tools add scope.
  • Backend complexity: real-time sync, custom APIs, and data processing add development hours.
  • Developer location: North America and Western Europe carry higher rates; Asia and Latin America typically run 40–60% lower for equivalent output.

Maintenance and Ongoing Costs

A progressive web app has no app store fees and no platform-specific approval delays. Updates deploy instantly to all users. Long-term, this lowers total cost of ownership compared to maintaining two native codebases with staggered release cycles.

ROI of a Progressive Web App: What the Data Shows

Revenue Impact Model

A straightforward ROI model: a business generating $100,000 in monthly mobile revenue at a 2% conversion rate sees a 40% improvement post-PWA launch. That produces $480,000 in additional annual revenue on a $50,000 build cost an 860% first-year ROI. Codebrand The model assumes no increase in traffic, only conversion rate improvement from faster load times and offline access.

Conversion and Engagement Metrics

  • Businesses switching to PWAs report a 36% increase in mobile conversions on average. AppVerticals
  • Starbucks’ PWA is 99.84% smaller than its iOS app and generated 2x daily active users post-launch.
  • Twitter Lite reduced data consumption by 70% while increasing engagement across all measured metrics.

Total Cost of Ownership vs Native

A single codebase app saves up to 60% on development budget over a three-year period. Webshark When you factor in app store fees, separate QA cycles, and platform-specific bug fixes, the savings compound annually.

Looking to build a progressive web app that drives measurable ROI? Tibicle helps businesses plan, develop, and scale PWAs with a conversion-first approach. Talk to our team today.

Risks and Challenges of Progressive Web Apps

iOS Limitations

Safari’s support for PWA features still lags behind Chrome and Edge. Push notification control on iOS is limited, Apple’s implementation of the Web Push standard remains inconsistent across versions. Businesses with a predominantly iPhone user base should test PWA behavior thoroughly on Safari before launch and factor potential workarounds into the development scope.

Limited Hardware Access

A progressive web app cannot access Bluetooth, NFC, or advanced AR capabilities through the browser. Camera and GPS work in most modern browsers, but the depth of hardware integration available to native apps is not currently replicable in a browser-based app. This is a fixed constraint, not a configuration issue.

App Store Discoverability Trade-off

Users conditioned to search the App Store or Google Play may not find your PWA through those channels. While Google Play now supports TWA (Trusted Web Activity) packaging for PWA submission, App Store distribution for PWAs remains limited. Businesses that depend on app store traffic as an acquisition channel should account for this gap.

Performance Ceiling for Complex Use Cases

AR/VR applications, AAA-grade mobile games, and financial apps with heavy cryptographic requirements still favor native architecture. A progressive web app performs within 10% of native for standard business applications, but that gap widens significantly for compute-intensive use cases.

Vendor Selection Checklist for Progressive Web App Development

Development

Use this checklist before signing a contract with any PWA development partner:

  • Does the vendor have documented PWA case studies with measurable outcomes?
  • Do they implement service workers and PWA caching strategies correctly not just add a manifest file?
  • Can they handle both frontend frameworks (React, Next.js, Vue) and backend integrations?
  • Do they offer post-launch performance optimization, including Core Web Vitals monitoring?
  • What is their approach to offline-first architecture and background sync?
  • Do they test across Chrome, Safari, Edge, and Firefox before delivery?
  • Can they integrate push notifications and background sync across Android and iOS?
  • Do they provide Lighthouse audit scores as part of the delivery package?
  • What is their maintenance and support model after go-live?
  • Do they offer PWA-to-app-store publishing via TWA for Google Play?

A vendor who cannot answer the service worker, Lighthouse, and cross-browser questions directly is likely treating PWA as a checkbox feature rather than an architecture decision.

Top Progressive Web App Development Companies in 2026

Major players in PWA development include Google, Microsoft, OutSystems, Alokai, IBM, GoodBarber, Cloud Four, and DockYard. When evaluating any vendor, the selection criteria that matter most are: cross-platform expertise across React and Vue ecosystems, Lighthouse performance scores on delivered projects, depth of client portfolio in your industry, and the clarity of their post-launch support model. Technical skill and communication structure both matter, delivery without documentation is a recurring problem in this space.

Why Tibicle Is a Strong Choice for Progressive Web App Development

Tibicle brings technical depth in React, Next.js, and Node.js to PWA projects, paired with an SEO-first development approach that aligns with how progressive web apps are discovered and ranked. The team focuses on performance optimization from the architecture stage not as a post-launch patch and follows a documented delivery process that includes Lighthouse audits, cross-browser testing, and structured handoffs. For businesses that need PWA development without the overhead of a large agency, Tibicle offers the same technical capability at a more accessible cost tier.

Want to explore how a progressive web app fits your business model? Reach out to Tibicle for a free consultation.

Conclusion

Progressive web apps reduce development cost by 30–75%, increase mobile conversions by up to 36%, and offer a viable alternative to dual native builds for most business applications. For companies that need cross-platform reach without the budget or timeline of separate iOS and Android projects, a PWA delivers on both counts. The risks are iOS limitations, hardware access gaps, app store discoverability are real but manageable with the right vendor and architecture decisions.

Schedule a free PWA assessment with Tibicle to evaluate your use case and projected ROI. Book here.

FAQs

What is a progressive web app and how is it different from a regular website?
A progressive web app is a browser-based application built with standard web technologies HTML, CSS, and JavaScript  that adds native app capabilities on top. A regular website loads fresh content on every page request and cannot function offline. A PWA uses service workers to cache content, allowing it to work without internet access. It can also be installed on a home screen, send push notifications, and load in under two seconds on repeat visits. The gap between a website and a progressive web app is not visual  it is architectural.

How much does it cost to build a progressive web app in 2026?
PWA development cost ranges from $8,000–$12,000 for basic builds, $15,000–$25,000 for mid-range projects like e-commerce or SaaS dashboards, and $30,000–$60,000 for enterprise-grade PWAs with complex integrations. Developer location, UI complexity, and backend requirements are the main cost variables. By comparison, a dual native app build (iOS + Android) typically costs $50,000–$150,000+, making PWA development 30–75% less expensive for most use cases.

Can a progressive web app work offline?
Yes. Offline functionality is one of the core features of a progressive web app. Service workers cache key assets and data on the first load. On subsequent visits without internet access, the app serves cached content instead of showing a connection error. The extent of offline functionality depends on the caching strategy implemented during PWA development  some apps cache full data sets, others cache only the shell and show a limited offline mode.

Is a progressive web app better than a native app for small businesses?
For most small businesses, yes. A progressive web app costs significantly less to build and maintain, launches faster, and reaches users across iOS and Android without separate codebases. It is fully indexable by search engines, which native apps are not. The trade-off is limited hardware access and some iOS feature gaps. If your product does not require Bluetooth, NFC, AR, or advanced camera control, a PWA delivers comparable user experience at a fraction of the cost.

Do progressive web apps work on iPhones and Safari?
Yes, with limitations. Safari supports core PWA features including home screen installation, service workers, and offline caching. Push notification support on iOS improved with iOS 16.4, but remains less consistent than Chrome or Edge on Android. Full-screen mode and some advanced PWA capabilities are still restricted on Safari. If your audience is predominantly iPhone users, test PWA behavior on Safari specifically and confirm your vendor accounts for iOS limitations in the development scope.

How long does it take to develop a progressive web app?
A basic progressive web app takes 4–6 weeks from scope sign-off to delivery. Mid-range PWAs with e-commerce functionality or dashboard integrations typically run 6–10 weeks. Enterprise PWAs with complex APIs and custom backend architecture can take 12–16 weeks. These timelines assume a defined scope, available design assets, and API documentation from third-party services. Delays in content, design feedback, or API access are the most common schedule risks.

What is mCommerce vs eCommerce

Introduction

eCommerce covers any commercial transaction online, across desktop and mobile alike. mCommerce is the subset specific to smartphones and tablets, via apps or mobile-optimized sites. Mobile commerce hit $2.51 trillion in 2025, or 60% of global e-commerce sales (Statista, 2025). Understanding mCommerce vs eCommerce this way makes clear why mobile readiness is now essential to any modern strategy. As the two increasingly overlap, the real question for businesses is no longer which one to choose, but how well they work together.

mcommerce vs ecommerce

Yet the question most C-suite leaders are still wrestling with is not whether mobile matters but what separates m-commerce vs. e-commerce at the operational and revenue level, and where exactly budget, development resources, and UX investment should be concentrated.

This is not a beginner’s guide to definitions. Companies investing in digital commerce must make high-stakes decisions about platform architecture, development spend, and customer experience design. Getting the m-commerce vs e-commerce distinction wrong at the strategic layer leads to misallocated budgets, underperforming conversion rates, and competitive disadvantage in a market where mobile-first has already become the default consumer expectation.

This guide will break down the structural, financial, and strategic differences between m-commerce and e-commerce, including ROI benchmarks, cost models, risk factors, and a vendor selection framework, everything a decision-maker needs to act, not just understand.

What Is eCommerce? A Quick Operational Overview

E-commerce, in a business context, refers to the buying and selling of goods and services through internet-connected devices, primarily desktops and laptops. It encompasses the full digital transaction infrastructure: product catalog management, payment processing, order fulfillment, and customer data management, typically delivered through a web-based storefront.

The global e-commerce market is projected to be $6.86 trillion in 2025 (eMarketer), spanning both B2B and B2C models. B2C e-commerce powers the consumer retail experiences most people interact with daily. B2B e-commerce, valued at $36 trillion and growing at 14.5% CAGR, drives procurement, wholesale, and supply chain transactions between businesses.

From a conversion standpoint, desktop conversion rates average 3%, outperforming mobile web at 2% (Dynamic Yield). Desktop users tend to be higher-intent buyers: they complete longer research cycles, handle more complex transactions, and show lower cart abandonment rates than their mobile counterparts.

Understanding e-commerce as the foundation is essential before evaluating the differences between e-commerce and m-commerce, because m-commerce does not replace the e-commerce infrastructure. It extends and complicates it.

What Is mCommerce? Why Mobile Is a Separate Strategic Channel

mCommerce (mobile commerce) refers to commercial transactions conducted via smartphones, tablets, and other handheld devices. It is technically a subset of eCommerce, but treating it as merely a responsive version of a desktop site is one of the most common and costly strategic mistakes in digital commerce.

The scale is not a forecast anymore. The US alone has 200+ million adults who have purchased via smartphone (Shopify). Globally, mobile commerce is the primary interface for most consumers, particularly in high-growth markets across Southeast Asia, India, and Latin America.

M-commerce operates across three primary business categories:

Mobile shopping: Purchasing via mobile browsers or dedicated shopping apps, including social commerce platform integrations on TikTok Shop, Instagram, and Pinterest.

Payments on mobile: Digital wallet adoption through Apple Pay, Google Pay, and PayPal, enabling one-tap or biometric-authenticated checkout flows.

Banking on mobile: In-app financial services, BNPL integrations, and account management that support the full commerce transaction lifecycle.

The strategic capabilities that define m-commerce are distinct: push notifications for cart recovery and offer delivery, geolocation targeting for proximity-based promotions, in-app purchasing with reduced checkout friction, and biometric authentication that improves both security and conversion.

Critically, shopping app users convert at 3.5% versus 2% on mobile web (BuildFire). The mobile shopping app development investment is not just a UX upgrade it is a measurable conversion rate improvement that compounds across customer lifetime value.

Understanding the difference between e-commerce and m-commerce at this level is what separates reactive platform decisions from strategic ones.

mCommerce vs eCommerce: Core Differences That Affect Business Decisions

mcommerce vs ecommerce

The e-commerce and m-commerce difference is not simply about screen size. At the operational level, the two channels diverge across device behavior, technology requirements, marketing infrastructure, and security posture. Each dimension carries direct business implications.

Device and User Behavior Split

Mobile drives 78% of global e-commerce traffic but only 66% of orders, a conversion gap that represents billions in underperforming revenue across the industry. Desktop users are high-intent buyers: they arrive further along in the purchase journey, complete longer research cycles, and transact with lower abandonment rates. Mobile users browse more, compare across sessions, and are more susceptible to checkout friction. The mobile commerce vs electronic commerce distinction in user behavior is not a preference difference it is a purchase psychology difference that must inform UX and funnel design.

Technology Stack and Development Requirements

E-commerce platforms are built around CMS and website infrastructure, such as Shopify, WooCommerce, Magento, and BigCommerce, with responsive design, payment gateway integration, and SEO-optimized architecture. The technology investment is primarily web-based.

M-commerce requires a fundamentally different technical layer: native app development or progressive web app e-commerce architecture, mobile payment integration with digital wallet providers, push notification infrastructure, biometric authentication, and app store compliance management. The mobile shopping app development requirement alone introduces an entirely new development discipline and cost structure that e-commerce websites do not encounter. This is a central dimension of the m-commerce vs e-commerce decision for any technology leader evaluating build-vs-buy options.

Marketing and Personalization Channels

E-commerce marketing is built around email, organic search, display advertising, and retargeting channels optimized for desktop sessions and longer consideration windows. M-commerce unlocks a distinct and often higher-engagement channel set: SMS marketing, in-app messaging, location-based offers, and social commerce platform integrations where discovery and purchase happen within a single session.

AI-powered recommendations drive up to 25% of mobile revenue (industry benchmarks), and mobile-first strategy increasingly depends on real-time behavioral personalization delivered at the session level, not the campaign level. Mobile conversion optimization through contextual, behavioral, and location-aware personalization is a genuine revenue lever, not a UX enhancement.

Security and Compliance Considerations

The difference between e-commerce and m-commerce extends into the security and compliance layer. Mobile introduces additional attack surfaces: app store compliance requirements, device-level data access permissions, biometric data regulations under GDPR and CCPA, and a fraud environment that is materially worse than desktop.

1 in 20 mobile verification attempts in 2024 were fraudulent. Any m-commerce investment must account for mobile-specific fraud prevention infrastructure, biometric authentication protocols, and ongoing compliance with regional data protection regulations costs and complexity that do not appear in a standard e-commerce platform evaluation.

mCommerce vs eCommerce Comparison Table

ParameterE-CommerceM-Commerce
Primary deviceDesktop/laptopSmartphone/tablet
Avg. conversion rate3%2% (web), 3.5% (app)
Traffic share35% globally62–64% globally
Revenue share (2025)40%60%
UX focusFull-page layouts, detailed specsSpeed, thumb-friendly UI, one-tap checkout
Payment methodsCards, bank transfers, walletsDigital wallets, BNPL, biometric pay
PersonalizationEmail, cookies, retargetingPush, geolocation, in-app behavior
Development costLower (website-only)Higher (app + mobile web + integrations)
Cart abandonment rate66%80%

Analysis: The data on m commerce vs e commerce conversion rates reveals something important. Mobile generates the majority of traffic but converts less on the mobile web. The gap is not a demand problem — it is a UX and checkout optimization problem. Businesses that close this gap through mobile shopping app development and streamlined checkout flows access a revenue pool that is already visiting their store.

ROI and Business Impact Where the Revenue Actually Comes From

mcommerce vs ecommerce

The mobile commerce vs electronic commerce debate becomes less philosophical and more actionable when you look at where revenue is actually being generated.

Revenue Distribution by Channel

M-commerce drives 63% of global retail commerce revenue (Statista, 2025). On Black Friday 2025, 70% of all sales came from mobile devices, a figure that should recalibrate any strategic plan that treats desktop as the primary commerce channel. Mobile app users generate 2.8–5x higher customer lifetime value than web-only shoppers, making the mobile shopping app development investment one of the highest-return capital allocations available in digital commerce.

Cost of Inaction

Businesses without a mobile-optimized experience lose 78% of traffic that never converts. Customer acquisition cost (CAC) has risen 222% over the last decade, a trend that makes high-retention channels like native apps increasingly critical to unit economics. Mobile apps, through push notifications, loyalty mechanics, and personalized re-engagement, deliver higher retention and lower CAC over time than desktop-only or mobile web approaches.

App vs Mobile Web ROI

Abandoned cart push notifications alone can generate $10,000+ per month in recovered revenue for mid-market retailers. App users purchase 33% more often than non-app users. With full mobile payment integration, personalized in-app experiences, and push notification infrastructure in place, total app ROI can scale to 5–10x within the first year of deployment. For businesses evaluating the difference between e-commerce and m-commerce investment, this is the clearest financial argument for committing to native or PWA mobile development.

Cost and Pricing Factors for mCommerce vs eCommerce Implementation

Understanding the cost structure of each channel is essential for accurate ROI modeling and budget sequencing. The e-commerce and m-commerce difference in investment requirement is significant and varies considerably by business maturity.

eCommerce Platform Costs

Website development ranges from $5,000 to $50,000+, depending on platform choice (Shopify, WooCommerce, Magento, or custom builds) and feature complexity. Ongoing operational costs, such as hosting, security, maintenance, and platform licensing, typically run $500 to $5,000 per month. For most businesses, e-commerce web infrastructure is the lower-cost starting point.

mCommerce Development Costs

Native app development for iOS and Android combined typically costs $30,000 to $150,000+, depending on feature depth, integration complexity, and development partner location and seniority. A progressive web app ecommerce alternative ranges from $10,000 to $50,000, delivering app-like performance within a browser context at lower build cost, though with some capability limitations versus native. Ongoing m-commerce costs include app store fees, push notification services, mobile analytics platforms, mobile-specific QA cycles, and compliance monitoring.

Where to Prioritize the Budget

The right sequencing of m-commerce vs. e-commerce investment depends on the business stage:

  • Under $1M revenue: Mobile-responsive website first. Optimize for mobile web before investing in app development.
  • $1M–$10M revenue: Progressive web app or hybrid app investment. Capture mobile conversion improvements with lower capital outlay than a full native build.
  • Above $10M revenue: Dedicated native apps with full mobile payment integration, personalization stack, and push notification infrastructure. At this scale, the ROI math justifies the full investment.

Risks and Challenges of Each Model

No mCommerce vs eCommerce analysis is complete without an honest assessment of the risks on both sides.

eCommerce Risks

Desktop traffic share is declining globally as mobile-first behavior becomes the norm across demographics. E-commerce platforms built without a mobile-first strategy face increasing structural disadvantage. SEO volatility with algorithm updates creates revenue unpredictability for traffic-dependent businesses. And businesses that have not optimized mobile checkout on their desktop-first e-commerce sites are already losing the majority of their traffic to non-converting mobile sessions a compounding loss.

mCommerce Risks

Cart abandonment on mobile sits at 80%, the highest across all commerce channels, and a persistent challenge even for mature mobile experiences. App fatigue is a real risk: 30% of shoppers delete apps due to excessive push notifications, meaning mobile conversion optimization must be balanced against engagement frequency. Security exposure is higher: fraud rates on mobile are significant, and compliance with GDPR, CCPA, and evolving biometric data regulations adds ongoing operational cost. Perhaps most sobering: only 12% of consumers find mobile web shopping “convenient” (Dynamic Yield), a figure that underscores why mobile shopping app development, rather than mobile-responsive web, is the stronger long-term investment for businesses serious about the m-commerce channel.

Vendor Selection Checklist: What to Evaluate Before Building

Whether investing in e-commerce, m-commerce, or both, evaluate every technology partner against these criteria before committing budget:

  • Platform flexibility: Does the vendor support both e-commerce and m-commerce from a single codebase or unified backend?
  • Mobile-first architecture: Is the platform natively built for mobile-first UX, or is mobile a retrofit of a desktop-first design?
  • Payment integration: Does it support digital wallet adoption, BNPL, and biometric payment natively?
  • Scalability: Can it handle 2x–5x traffic surges during holiday peaks and flash sales without performance degradation?
  • Analytics and attribution: Does it track cross-device customer journeys and mobile-specific KPIs (push open rates, in-app conversion, session depth)?
  • Security compliance: PCI-DSS, GDPR, CCPA readiness  including mobile-specific data access and biometric regulations?
  • Post-launch support: Does the partner provide app store management, push notification strategy, and ongoing mobile QA?
  • Total cost of ownership (TCO): Upfront build cost plus 12-month operational cost  not just the development quote.

Top Tools and Platforms for mCommerce vs eCommerce in 2026

Tools and Platforms

The right platform for your m-commerce vs e-commerce architecture depends on business maturity, budget, and technical requirements. No single platform fits all.

Shopify remains the strongest mid-market option for businesses that need both e-commerce and m-commerce capability quickly. Its PWA support and native mobile payment integration make it a strong default for businesses under $10M revenue.

Magento delivers enterprise-grade flexibility for custom mobile experiences, with deep API-first architecture suited to complex B2B ecommerce and B2C at scale.

WooCommerce with mobile plugins serves budget-conscious SMBs that need mobile-responsive e-commerce without the overhead of a dedicated app investment.

BigCommerce offers native mobile optimization and strong out-of-the-box mobile conversion tools, particularly for mid-market retailers.

React Native and Flutter are the leading custom app development frameworks for businesses building dedicated native mobile apps, enabling shared codebases across iOS and Android, reducing mobile shopping app development cost by 30–40% versus fully separate native builds.

Match the tool to your business stage. Over-investing in enterprise infrastructure at an early stage, or under-investing in mobile at a growth stage, are equally costly mistakes in the m-commerce vs. e-commerce decision.

Why Tibicle Is a Strong Choice for mCommerce vs eCommerce Development

Development

Businesses that have worked through the vendor checklist above and concluded they need a custom build or a development partner capable of delivering both e-commerce and m-commerce infrastructure under a single technical relationship need more than a platform vendor. They need an engineering team.

Tibicle builds custom e-commerce and m-commerce solutions: native iOS and Android apps, progressive web app ecommerce builds, and responsive web platforms designed for a mobile-first strategy from the ground up. The team is based in Ahmedabad with senior development capability across the full stack design, build, QA, and launch, with a transparent pricing model that makes TCO forecasting straightforward.

The use case fit is specific: mid-market and enterprise B2B and B2C businesses that need both desktop and mobile commerce under one technical partner, without the coordination overhead of managing multiple vendors across the commerce stack. Tibicle’s mobile payment integration experience, cross-platform deployment capability, and mobile conversion optimization track record align directly with the criteria outlined in the vendor checklist above.

Talk to Tibicle’s commerce team to scope your mCommerce or eCommerce build and get a technical assessment of where your current architecture is leaving revenue on the table.

Conclusion

The mCommerce vs. eCommerce question is no longer an either/or decision for serious digital commerce businesses. It is a sequencing and budget allocation question one where the wrong answer at the platform architecture stage creates compounding conversion and retention problems that are expensive to unwind.

Mobile commerce is the majority revenue channel: 60% of global e-commerce revenue, 70% of Black Friday sales, and the primary commerce interface for the majority of consumers under 45. But e-commerce infrastructure, the web platform, the backend, the fulfillment and payment systems, remain the foundation on which mobile experiences are built.

For C-suite leaders, the decisions made now on vendor selection, platform architecture, and mobile investment level will directly affect conversion rates, customer lifetime value, and competitive positioning through 2026 and beyond. The businesses that treat mobile-first strategy as a core infrastructure decision, not a UX project, will be structurally better positioned to capture the commerce revenue that mobile is already generating.

Contact Tibicle to discuss your commerce platform strategy and get a custom development roadmap tailored to your current architecture, business model, and 2026 growth targets.

Frequently Asked Questions

What is the main difference between mCommerce vs eCommerce?
eCommerce covers all online buying and selling via the internet, typically through desktop or laptop browsers. mCommerce is a subset of e-commerce that involves transactions conducted specifically through mobile devices like smartphones and tablets. The core e-commerce and m-commerce difference at a strategic level lies in user behavior, technology stack, marketing channels, and conversion mechanics, not just the device used.

Is mCommerce more profitable than eCommerce?
mCommerce now drives 60% of global e-commerce revenue and mobile app users deliver 2.8–5x higher customer lifetime value than web-only shoppers. However, profitability in mobile commerce vs electronic commerce depends heavily on mobile UX quality, the level of app investment (native vs PWA), and how effectively cart abandonment, which runs at 80% on mobile, is addressed through checkout optimization and push notification recovery flows.

How much does it cost to build an mCommerce app?
A native m-commerce app for iOS and Android typically costs $30,000–$150,000+. Progressive web app ecommerce alternatives range from $10,000–$50,000 and deliver app-like performance at a lower build cost. Ongoing costs include app store fees, mobile analytics platforms, push notification services, and mobile-specific QA, typically adding $1,000–$5,000 per month in operational overhead.

Which is more profitable, mCommerce vs eCommerce?
Profitability depends on the business model, product type, and target audience rather than the platform alone. However, with mobile commerce accounting for 60% of global e-commerce sales in 2025, businesses that ignore mobile optimization risk losing a significant share of potential revenue.

Can a business run both eCommerce and mCommerce from the same platform?
Yes. Platforms like Shopify, BigCommerce, and Adobe Commerce support both e-commerce and m-commerce from unified backends. Custom builds using React Native or Flutter can share a single backend while delivering native mobile experiences on iOS and Android. For businesses evaluating mobile commerce vs electronic commerce infrastructure, a unified platform reduces development cost, simplifies analytics attribution, and eliminates backend duplication.

What conversion rate should I expect from mobile commerce?
Mobile web converts at roughly 2%, while mobile apps convert at 3.5%. Desktop e-commerce still leads at approximately 3%. The m-commerce vs e-commerce conversion gap on mobile web is primarily a UX and checkout optimization problem, not a demand problem. Businesses that invest in mobile shopping app development, one-tap checkout, and digital wallet adoption consistently see mobile conversion rates that meet or exceed desktop benchmarks.

Top 5 Restaurant Inventory Management Software in 2026

Introduction

Restaurant inventory management software has become one of the most important investments for restaurants looking to control food costs, reduce waste, and improve operational efficiency. Food and beverage costs average 28 to 35% of revenue for full-service restaurants, yet many operators assume the problem lies in purchasing or portion control. More often than not, the real issue is visibility; restaurants don’t know what they’re losing until the month-end P&L arrives, when the financial impact has already occurred.

restaurant inventory management software

The wrong software decision compounds that problem. A platform that doesn’t integrate cleanly with your POS, can’t handle multi-location reporting, or gets abandoned by BOH staff after 60 days doesn’t save money; it adds cost to an already-tight margin structure. The restaurant inventory management software market is projected to grow from $4.55 billion in 2025 to $9.18 billion by 2030, and the number of platforms competing for that spend is growing with it.

That makes the evaluation harder, not easier. The five platforms covered here are assessed on what actually moves the needle for operators: food-cost impact, implementation risk, scalability, and total cost of ownership, not on feature checklists.

Why Restaurant Inventory Management Is a Financial Decision, Not a Tech Decision

Most operators frame the inventory software decision as an IT question: which platform has the best interface, which one integrates with our current stack, which one the team will complain about least. That framing is expensive. The right question is which platform removes the most dollars from your cost structure with the least implementation risk.

Inventory software doesn’t improve food costs by itself. It improves visibility, and visibility creates the conditions where problems get caught early enough to fix. That distinction matters when you’re evaluating platforms and trying to build a business case for the investment.

What the Numbers Say About Inventory Mismanagement in 2026

The operational and financial cost of manual inventory management is well-documented at this point. Food and beverage costs average 28 to 35% of revenue for full-service restaurants, with variance that compounds across locations. Manual inventory counting consumes 15 to 20 hours per week of management time, time that isn’t being spent on the floor, on scheduling, or on the supplier relationships that affect purchasing costs. Over 38% of fruits and vegetables are wasted in restaurant operations due to inaccurate demand planning. That’s not a storage problem. It’s a forecasting problem that software is built to solve.

What Modern Restaurant Inventory Management Software Actually Does

restaurant inventory management software

Modern restaurant inventory management software does far more than replace spreadsheets. The platforms in this guide provide real-time stock visibility, purchasing automation, recipe costing, and forecasting that directly improve restaurant profitability. 

It handles real-time stock depletion linked directly to POS sales data, purchase order automation and supplier management, recipe costing with theoretical versus actual usage variance, multi-location inventory tracking and transfer management, and AI-powered demand forecasting to reduce over-ordering. Each of those capabilities translates directly to a line item on the P&L. The question for operators is which combination of capabilities maps to their actual cost problem, and which platform delivers those capabilities without a 12-month implementation.

The 5 Features Every Restaurant Inventory Management Software Should Offer

Not all inventory platforms are solving the same problem. Before comparing vendors, operators need a clear evaluation framework, one built around financial outcomes, not feature counts.

restaurant inventory management software

POS Integration Depth

Real-time stock depletion tied to POS sales data is categorically different from end-of-day sync. When food cost runs hot mid-week, a platform that updates inventory once every 24 hours gives you yesterday’s problem, not today’s. The integration question isn’t whether a platform connects to your POS; it’s how often and how cleanly. Ask vendors specifically about sync frequency and what happens when the integration drops.

Recipe Costing Accuracy

Recipe costing is only as accurate as the invoice pricing feeding it. Platforms that pull live invoice pricing into recipe cost calculations, accounting for yield tracking and prep loss, give operators a real cost-per-plate number, not a theoretical one from three months ago. The gap between those two numbers is often where food cost variance hides.

Invoice Processing and AP Automation

Manual invoice entry is slow and error-prone. Automated invoice processing eliminates data entry lag and catches receiving discrepancies before they close into the books. For multi-location operators managing hundreds of invoices monthly, this capability alone can justify the platform cost through labor recovery and error reduction.

Waste Tracking and Reporting Granularity

A single waste total tells you nothing actionable. Waste logs broken down by reason code, spoilage, overproduction, prep error, and transfer tell you where to intervene. The difference between a platform that shows you a waste number and one that shows you why waste is happening is the difference between data and a decision.

Scalability Across Locations

A platform that works well at 3 locations doesn’t automatically scale to 30. Evaluate whether the pricing model compounds predictably as you add units, whether permissions and reporting hierarchies support regional or concept-level management, and whether the vendor has reference customers at the scale you’re planning, not just at your current size.

Top 5 Restaurant Inventory Management Software Platforms in 2026

Each platform below is evaluated on its strongest use case, its standout capability, and its most meaningful limitation. No platform is the right answer for every operation; the goal is to narrow the field to the one that fits your cost structure, team size, and growth plan.

1. Restaurant365: Best for Multi-Unit Operators Needing Consolidated Financials

What it is: Restaurant365 is a cloud-based platform that replaces standalone accounting and inventory systems with a single integrated environment. For operators who are running QuickBooks alongside a separate inventory tool and reconciling them manually, Restaurant365 eliminates that workflow.

Ideal for: Groups with five or more locations that need integrated payroll, general ledger, and inventory in one system. Operators who need daily P&L by location, not a consolidated report at month-end, will find this capability particularly valuable.

Standout capability: Consolidated reporting across all locations is the core differentiator. Finance teams can see daily food cost by unit without pulling reports from multiple systems or waiting for a close cycle. For CFOs and controllers managing complex P&L structures, that visibility changes how quickly problems get addressed.

Limitation: Setup complexity is real. Teams new to integrated accounting software face a steeper learning curve than platforms built for operations-only users. Implementation timelines are longer, and the investment in onboarding is higher. For single-location operators or groups under 5 units without an accounting integration problem, this is more platform than they need.

2. MarketMan: Best for Food Cost Control and Supplier Management

What it is: MarketMan is a dedicated inventory and procurement platform built specifically for food cost reduction. It doesn’t try to replace accounting software; it focuses on the back-of-house workflows that drive food cost variance: counting, ordering, invoicing, and recipe costing.

Ideal for: Independent restaurants and growing groups with complex menus and multiple vendor relationships. Operators who are losing money on food cost but can’t identify exactly where will find the most immediate ROI here.

Standout capability: Theoretical versus actual usage tracking is where MarketMan earns its positioning. When actual usage consistently runs above theoretical, the platform flags the variance by item, making it possible to identify whether the problem is portioning, theft, spoilage, or receiving discrepancies. Waste logging by reason code and recipe costing connected to live invoice pricing round out a genuinely strong food cost control feature set.

Limitation: MarketMan doesn’t include built-in accounting. Operators who need financial consolidation across locations will need a third-party integration, typically QuickBooks or Sage, which adds cost and a data sync dependency.

3. MarginEdge: Best for Fast Visibility Into Daily Food Costs

What it is: MarginEdge sits at the intersection of invoice processing and POS integration. It isn’t a full inventory platform; it’s built to give operators food cost data within the period, not at month-end close.

Ideal for: Operators who need to know their food cost number now, not when the accountant closes the books. If the current workflow involves waiting for a month-end report to find out whether food cost was in line, MarginEdge solves that specific problem faster than most alternatives.

Standout capability: The invoice coding team is a differentiator that often gets overlooked in feature comparisons. MarginEdge employs humans to manually code invoices, which means operators don’t need to map their own vendor catalogs or train staff on AP workflows. Daily food cost dashboards are often live within days of setup — a much faster time-to-value than platforms requiring weeks of configuration.

Limitation: MarginEdge isn’t a replacement for a full inventory platform. Recipe costing is less granular than MarketMan, and operators needing detailed yield tracking or waste logging by reason code will find gaps. It works best as a financial visibility layer alongside, not instead of, a dedicated inventory tool for operations with complex menus.

4. Toast Inventory: Best for Restaurants Already on Toast POS

What it is: Toast Inventory is the inventory layer built directly into the Toast POS ecosystem. For operators already running Toast, it’s the path of least resistance to inventory tracking: no separate vendor, no integration configuration, no additional login.

Ideal for: Independent restaurants and small chains already on Toast POS that need basic inventory visibility without the overhead of evaluating and implementing a standalone platform. The elimination of vendor management complexity is a genuine operational benefit.

Standout capability: Automatic stock depletion per sale is the core value here. Every item sold removes the corresponding ingredient quantities from inventory in real time. Built-in sales alerts and usage tracking give operators a clear picture of what’s moving and what’s sitting, without any manual data entry.

Limitation: Toast Inventory is functional for basic tracking and doesn’t go much further. Complex multi-supplier recipe costing, waste logging by reason code, or theoretical versus actual usage variance are outside its scope. Operators with sophisticated food cost control needs will outgrow this quickly.

5. Crunchtime: Best for Large Enterprise Restaurant Chains

What it is: Crunchtime is an enterprise operations platform with AI-powered forecasting and multi-unit audit capabilities. Its purpose is built for the complexity of large chain operations, centralized control, consistent standards enforcement, and chain-wide visibility into costs and compliance.

Ideal for: QSR chains and large casual dining groups with 50 or more locations that need centralized operational control. At this scale, the ROI calculation changes: the savings from AI-driven demand forecasting and suggested prep across hundreds of units can dwarf the platform cost.

Standout capability: AI-driven demand forecasting, suggested ordering, and suggested prep are the capabilities that separate Crunchtime from the platforms above it on this list. For enterprise chains, purchase order automation at scale, informed by historical sales patterns and current inventory levels, directly reduces over-ordering and the food waste that follows. Chain-wide waste tracking completes the visibility picture.

Limitation: Entry-level pricing starts above $5,000 per month, and enterprise contracts are custom. Crunchtime is not suited for operators below 20 to 25 units. For growing groups that haven’t reached that threshold, the cost structure and implementation complexity are mismatched to operational needs.

Restaurant Inventory Management Software Comparison (2026)

restaurant inventory management software

Use this table as a starting point for vendor conversations, not as a final decision framework. Pricing reflects publicly available 2026 data per location per month and will vary with setup fees, tier upgrades, and contract structure. Verify directly with each vendor before building a budget .

PlatformBest ForStarting PricePOS IntegrationRecipe CostingMulti-LocationAccounting Built-In
Restaurant365Multi-unit chains~$249/mo/locationYesYesYesYes
MarketManFood cost control~$$1,500 /mo per locationYesAdvancedYesNo
MarginEdgeDaily P&L visibility~$350/mo/locationYesBasicYesNo
Toast InventoryToast POS usersBundled with ToastNativeBasicLimitedNo
CrunchtimeEnterprise chains$5,000+/moYesAdvancedYesNo

Note: Pricing reflects publicly available 2026 data per location/month and may vary with setup fees and tier upgrades.

Running a multi-location operation and evaluating which platform fits your current cost structure? Talk to a specialist before committing to a contract.

What These Platforms Actually Cost: A Realistic Pricing Breakdown

Most vendors publish starting prices. What they don’t publish is what operators actually end up paying after setup fees, integration configuration, training, and the inevitable tier upgrade when entry-level features don’t cover operational needs. This section covers the realistic cost picture.

Per-Location vs. Enterprise Pricing: What to Budget

Pricing scales with locations and feature tiers in ways that aren’t always obvious from vendor websites. Here’s what operators should budget for:

  • MarketMan at 3 locations plus BlueCart for purchasing: $800 to $1,000 per month
  • MarketMan at 5 locations with full onboarding: $1,200 to $1,800 per month
  • Adding MarginEdge as a financial visibility layer at 5 locations: an additional $900 to $1,500 per month
  • Restaurant365 at 10 users: $999 to $1,999 per month depending on tier
  • Crunchtime: custom enterprise contracts starting above $5,000 per month

Hidden Costs Operators Frequently Underestimate

The monthly subscription is rarely the whole cost. Budget for:

  • Onboarding and setup fees: MarketMan charges approximately $500 per location
  • Invoice scan overages on entry-tier plans
  • POS integration configuration time and IT resource cost
  • Staff training hours, particularly for teams new to digital back-of-house systems

When to Stack Tools vs. Use One Platform

For operators with 1 to 5 locations, stacking a dedicated inventory platform with a separate accounting integration often costs less and deploys faster than an all-in-one system. Above 10 locations, particularly when multi-concept or multi-brand complexity enters the picture, the consolidation benefits of a platform like Restaurant365 start to outweigh the stacking cost savings. The right answer depends on where operational complexity sits today and where it’s headed in the next 24 to 36 months.

ROI and Business Impact: What the Data Shows for 2026

The ROI case for restaurant inventory software isn’t theoretical. It’s a math problem with well-established inputs, and for most operations, the payback period is shorter than most software investments.

Food Cost Reduction

Food Cost Reduction You Can Expect

Automated inventory systems reduce food waste by an average of 26% and over-ordering by 31%. Restaurants that implement the right platform and follow through on data hygiene can reduce food costs by up to 20%. For a restaurant spending $30,000 per month on food, that’s a potential savings of $6,000 per month, $72,000 per year. For a $1.5 million revenue restaurant, a 5% food cost reduction saves $24,750 annually. Most platform costs at that scale run $150 to $400 per month. The math isn’t complicated.

Labor Savings From Automation

Manual inventory counting consumes 15 to 20 hours per week of management time. At $18 to $25 per hour for management-level labor, that’s $280 to $500 per week in recovered cost, before accounting for the accuracy improvement that comes with digital counting versus clipboard estimates. Most restaurants see measurable food cost changes within 30 to 60 days of going live, which means the ROI case materializes quickly enough to validate the investment in the same quarter it’s made.

Payback Timeline by Operation Size

Payback timelines vary with operation complexity and how aggressively the platform is implemented:

  • Independent restaurants with 1 to 2 locations: 3 to 6 month payback is typical
  • Mid-market groups with 3 to 10 locations: often under 90 days when food cost variance is addressed directly
  • Enterprise chains: ROI is calculated across waste reduction, labor recovery, and purchasing efficiency at scale; individual unit metrics compound across the portfolio

Risks of Implementing Restaurant Inventory Management Software

Risks and Challenges

Integration Failures With Existing POS Systems

Not every POS integrates cleanly with every inventory platform. Before signing a contract, verify API compatibility, data sync frequency, and whether your specific POS version is on the vendor’s supported integrations list. Ask for a reference from another operator running your POS on their platform. Integration issues are the most common cause of delayed go-lives and the most expensive to fix post-contract.

Data Accuracy Problems During the First 90 Days

Recipe libraries, unit-of-measure mismatches, and supplier catalog errors are the most common causes of inaccurate food cost data after implementation. A platform is only as accurate as the data entered into it. Who owns data hygiene internally matters as much as the platform itself; identify that person before go-live, not after the first count discrepancy.

Adoption Resistance From Kitchen and BOH Staff

The fastest-failing implementations share one trait: no change management plan. Restaurant back-of-house staff are busy, skeptical of new systems, and not always the intended audience for vendor onboarding materials. Mobile accessibility and structured training investment directly determine whether inventory counts happen accurately and consistently, or whether the system becomes a compliance checkbox that no one trusts.

Scaling Risk: When You Outgrow Your First Platform

Choosing a platform suited for 2 locations when you plan to operate 20 within 3 years creates a costly migration event. Platform migrations are expensive in time, data, and disruption. Build the growth plan into the vendor evaluation from the start; ask vendors explicitly about customers at your target scale, not just your current size.

Vendor Selection Checklist: What to Evaluate Before You Sign

Use this checklist when evaluating any restaurant inventory management software vendor. These are the questions that separate a good demo from a good fit.

Operational Fit

  • Does it integrate with your current POS system without custom development?
  • Does pricing scale predictably as you add locations?
  • Does it support your supplier network and automate purchase orders?

Financial Visibility

  • Can you access daily food cost data, not just month-end reports?
  • Does it track theoretical versus actual usage variance by item?
  • Does it flag receiving discrepancies before they close?

Implementation

  • What is the onboarding timeline and who owns setup?
  • Is there a dedicated implementation support contact?
  • What does the training program look like for BOH staff?

Scalability

  • Is the platform built for multi-location operations, or adapted to it?
  • Are enterprise pricing tiers clearly defined before contract?
  • What is the vendor’s uptime SLA and support response standard?

Why Tibicle LLP Is Worth Considering When Off-the-Shelf Doesn’t Fit
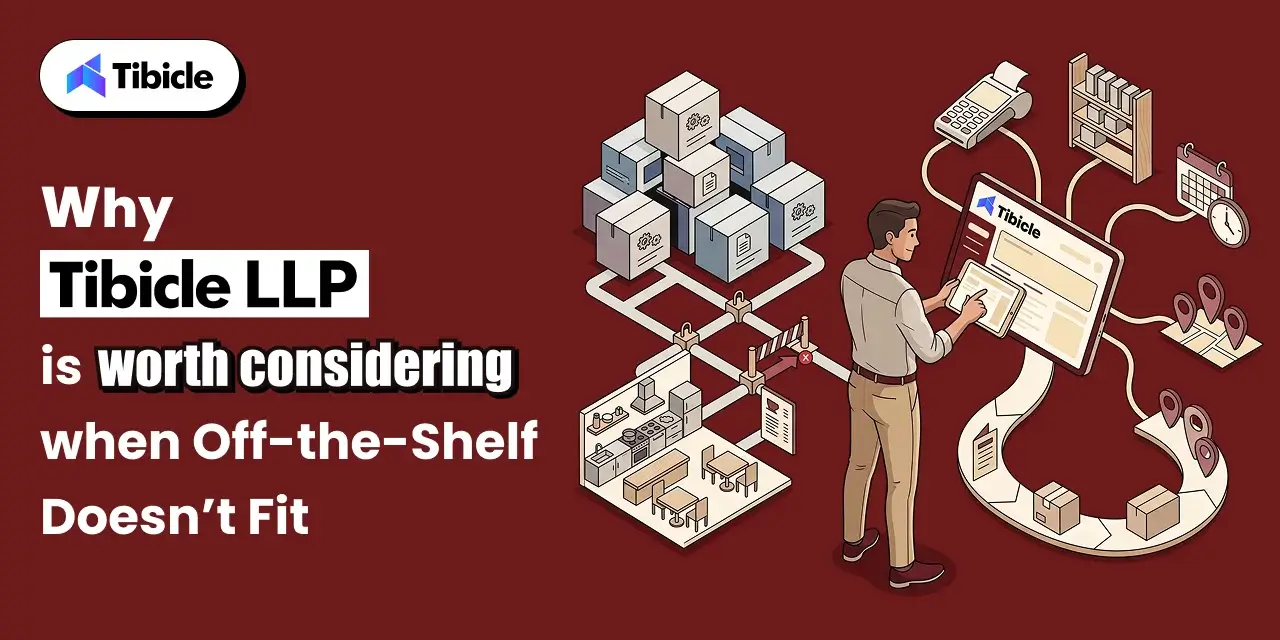
The five platforms above cover the majority of restaurant operations well. There’s a segment they don’t cover: operators with non-standard workflows that standard platforms can’t accommodate without expensive workarounds.

Dark kitchens running multiple brands from a single facility, cloud kitchen aggregators managing proprietary supplier contracts across concepts, and vertically integrated food and beverage chains with custom procurement logic are all examples of operations where off-the-shelf software requires enough customization that a purpose-built system becomes cost-competitive.

Tibicle LLP builds AI-powered web and mobile applications and custom backend systems for restaurant operators in that category. The engagement model is flexible, from scoped MVP builds to full ongoing development partnerships. There are no pricing promises here; the right starting point is a conversation about what your operation actually requires.

For restaurant operators who have outgrown standard platforms or need a purpose-built solution, explore what a custom build looks like for your operational model.

Conclusion

Choosing the right restaurant inventory management software isn’t about comparing feature lists. It’s about selecting a platform that removes costs, improves visibility, and supports long-term operational growth.  It’s about which platform removes the largest dollar figure from your cost structure with the least implementation risk.

Restaurant365 is the right call for multi-unit operators who need integrated accounting and consolidated financials. MarketMan is where independent restaurants and growing groups with food cost problems should start. MarginEdge solves the daily visibility problem faster than any other platform on this list. Toast Inventory serves Toast POS users who want basic tracking without a separate vendor relationship. Crunchtime is purpose-built for enterprise chains with the scale to absorb its cost and complexity.

Single-location operators have a different right answer than growing groups, and growing groups have a different right answer than enterprise chains. The decision logic is the same across all three: match the platform to the cost structure and the growth plan, not to the demo that looked best in a conference room.

Ready to match your operation size and cost structure to the right platform? Book a free inventory software consultation or contact Tibicle for a custom build assessment.

Frequently Asked Questions

What is restaurant inventory management software and how does it differ from a standard POS?
A POS records sales transactions. Restaurant inventory management software tracks what those sales consume, depleting stock, updating recipe costs, and flagging when actual usage diverges from theoretical. Most modern platforms integrate with POS systems rather than replacing them. The two systems serve different functions: one captures revenue, the other controls cost.

How much should be budgeted for Restaurant inventory management software in 2026?
Single-location restaurants typically spend $149 to $400 per month. Multi-unit groups of 3 to 10 locations should budget $800 to $2,500 per month depending on platform and feature tier. Enterprise chains on platforms like Crunchtime start above $5,000 per month. Add 15 to 20% for setup fees, onboarding, and integration configuration when building an initial budget.

How long does it take to see ROI after implementing inventory software?
Most operators see measurable food cost improvement within 30 to 60 days. Full payback on software cost typically occurs within 3 to 6 months for independent restaurants and faster for multi-unit groups where food cost variance is already high. The operators who see the slowest payback are typically the ones who underinvested in data setup and staff training during implementation.

What’s the biggest mistake made when choosing restaurant inventory management software?
Choosing a platform designed for their current size rather than the size they plan to be in 24 to 36 months. A platform migration mid-growth is expensive in time, money, and operational disruption. Evaluating vendors against a 3-year growth plan rather than today’s footprint is one of the highest-value decisions operators can make in this process.

Can restaurant inventory management software integrate with accounting tools like QuickBooks?
Yes. Most platforms, including MarketMan, MarginEdge, and Restaurant365, support integrations with QuickBooks, Sage, and other accounting software. Restaurant365 replaces accounting software entirely for operators who prefer a consolidated system. Verify integration compatibility and sync frequency directly with vendors before committing; not all integrations perform equally.

When does it make sense to build custom inventory software instead of buying off-the-shelf?
When your operation has non-standard workflows, multiple kitchen formats, proprietary supplier contracts, or multi-brand aggregation, that standard platforms can’t accommodate without expensive workarounds. Custom development becomes cost-competitive above a certain complexity threshold, typically when the cost of platform customization and ongoing workarounds approaches the cost of a purpose-built system.

Digital Transformation in Retail: Pros and Cons

Introduction

The global retail digital transformation market reached approximately $285.76 billion in 2025 and is projected to grow to $487.12 billion by 2030, expanding at a CAGR of 11.26%. Retailers worldwide are investing heavily in cloud technologies, AI-powered automation, data analytics, and connected customer experiences to remain competitive in an increasingly digital marketplace.

digital transformation in retail

The financial impact is already becoming visible. According to PwC, 30% of global CEOs report revenue growth from digital technologies such as generative AI, while 45% expect additional profitability improvements over the next year. Despite these promising figures, many transformation initiatives fail to generate measurable business outcomes. Significant investments are often made without a clear understanding of implementation complexity, organizational readiness, or long-term return on investment.
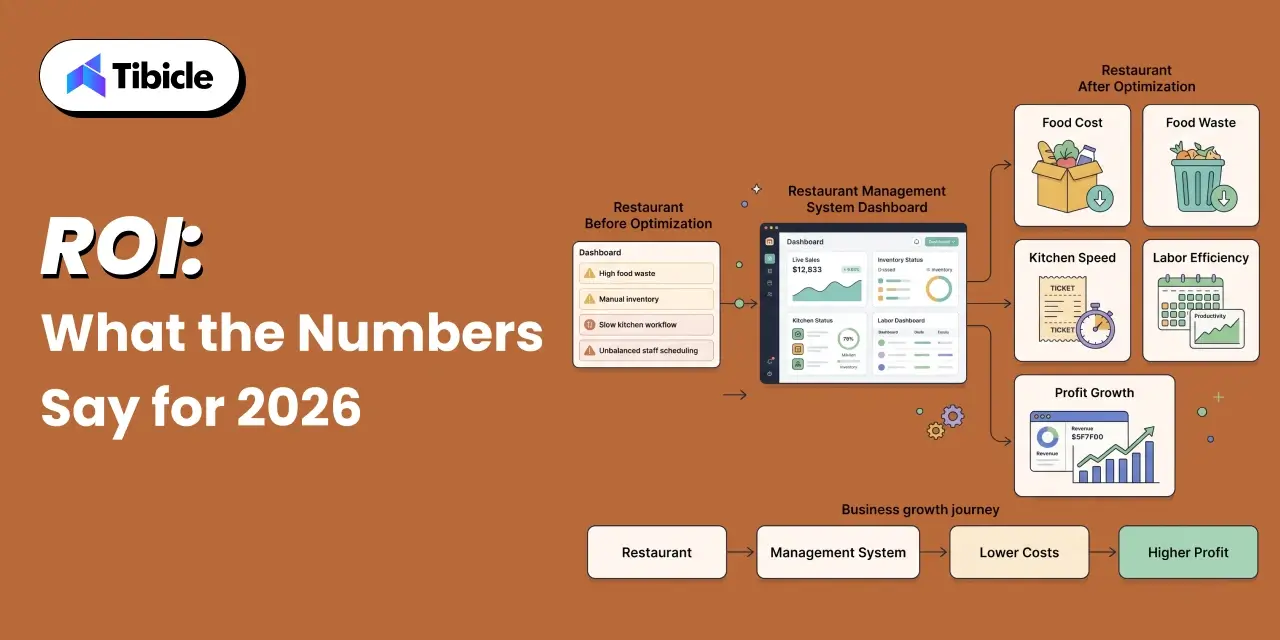
For executives evaluating the future of their organizations, the challenge is not deciding whether digital transformation matters. The challenge is determining where the value exists, where risks concentrate, and how investments should be prioritized.

What Is Digital Transformation in the Retail Industry?

digital transformation in retail

Digital transformation in retail industry refers to the strategic integration of digital technologies across every aspect of retail operations. Rather than focusing on a single technology investment, it involves rethinking how businesses operate, engage customers, manage inventory, optimize supply chains, and make decisions through technology-driven processes.

Many organizations mistakenly assume digital transformation simply means launching an online store or adding mobile commerce capabilities. In reality, the scope is much broader. It includes POS modernization, inventory automation, predictive analytics, workforce enablement, personalized marketing systems, and intelligent fulfillment networks.

A modern retail digital transformation strategy often combines technologies such as artificial intelligence, cloud computing, IoT devices, advanced analytics, and automation platforms to create connected operational ecosystems.

Examples include:

  • AI-powered recommendation engines
  • Automated inventory forecasting
  • Smart warehouse management
  • Digital loyalty platforms
  • Self-service checkout systems
  • Connected customer engagement tools

Industry adoption continues to accelerate. Gartner reports that approximately 91% of retail IT leaders plan to deploy AI technologies by 2026 as part of broader transformation initiatives.
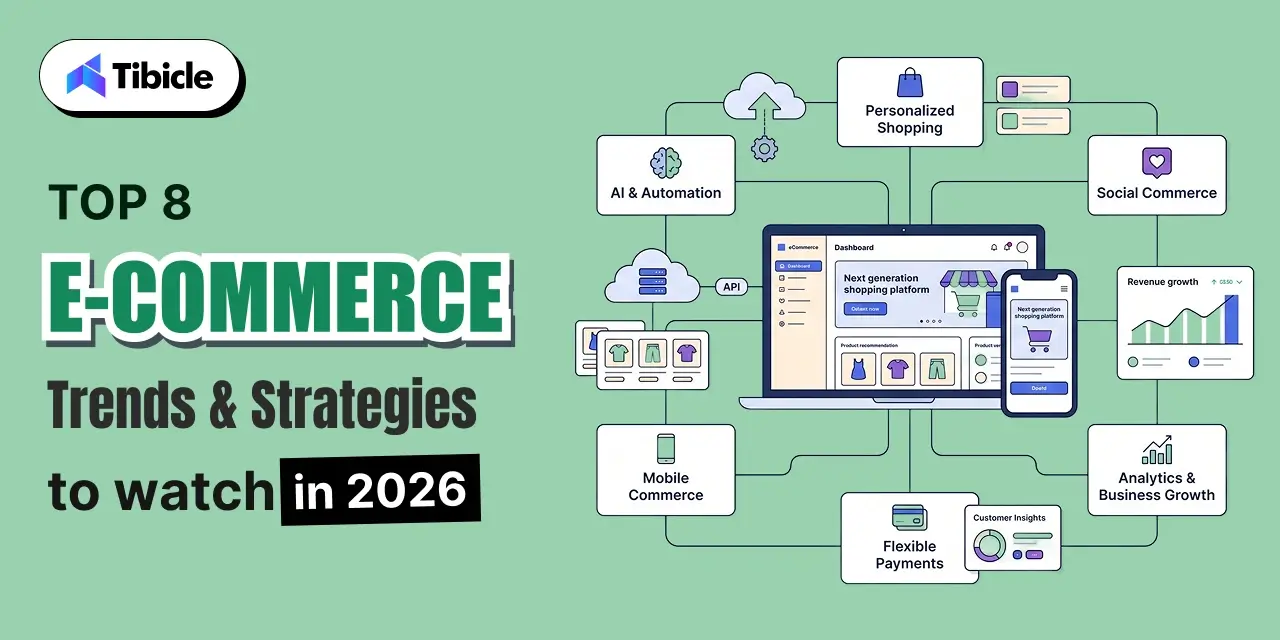
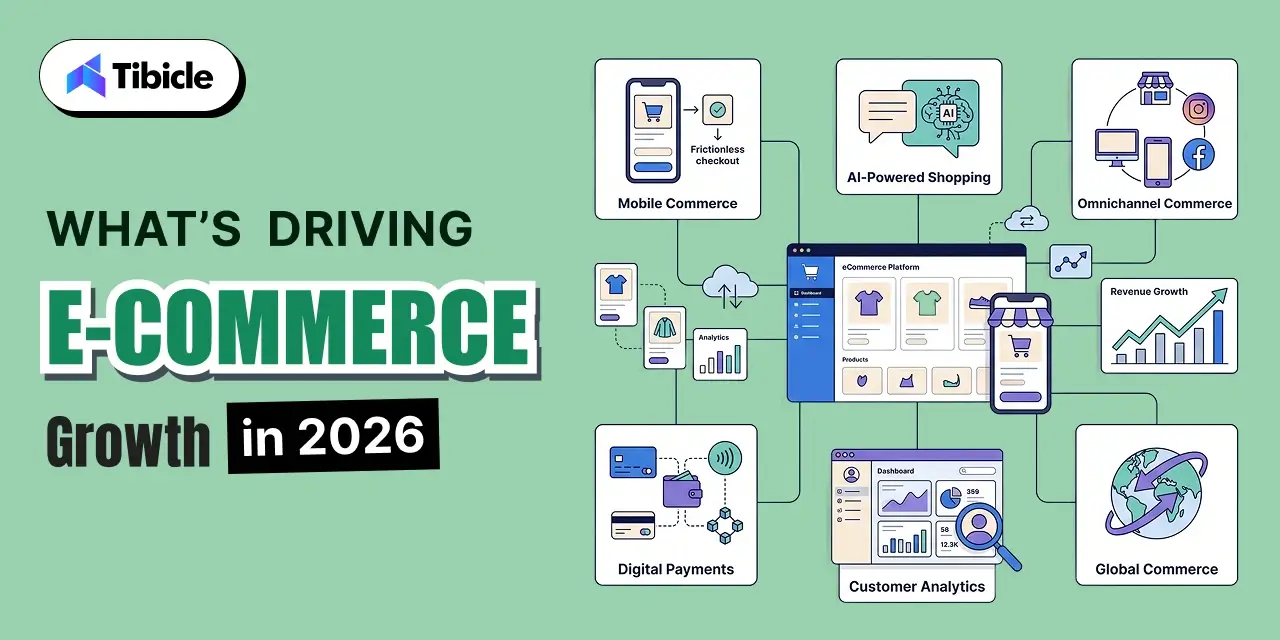
Transformation is no longer viewed as a competitive advantage. Increasingly, it is becoming a business necessity.

Key Pros of Digital Transformation in Retail

digital transformation in retail

Retail leaders often justify transformation initiatives based on revenue growth, operational efficiency, customer experience improvements, and scalability. While outcomes vary by implementation quality, several benefits consistently emerge across successful projects.

Revenue Growth Through Personalized Customer Experiences

One of the strongest advantages of digital transformation in retail industry is the ability to deliver highly personalized customer experiences.

Modern retailers collect and analyze large volumes of customer data to understand purchasing behavior, browsing patterns, preferences, and engagement history. This information allows organizations to provide tailored recommendations, targeted promotions, and individualized shopping journeys.

Research suggests personalized shopping experiences can increase basket size by up to 40%. Recommendation engines powered by AI and integrated CRM platforms help retailers present the right products to the right customers at the right time.

Today’s consumers increasingly expect these experiences. Whether shopping online, through mobile applications, or in physical stores, personalization has become a major driver of customer satisfaction and retention.

Organizations investing in AI in retail operations are also improving loyalty program performance by creating more relevant and timely engagement opportunities.

Additionally, approximately 65% of retail organizations now view generative AI as a critical component of future ecommerce growth strategies.

Operational Cost Reduction and Process Automation

Reducing operational expenses remains one of the most compelling reasons retailers pursue digital transformation.

Many retail processes still rely on manual workflows, disconnected systems, and repetitive administrative tasks. Automation helps eliminate inefficiencies while improving accuracy and consistency.

Examples include:

  • Automated inventory replenishment
  • Invoice processing automation
  • Workforce scheduling optimization
  • Marketing campaign automation
  • Demand forecasting systems

Studies show marketing automation alone can reduce marketing overhead by approximately 12.2%.

Meanwhile, RFID tracking and IoT-enabled inventory systems have demonstrated the ability to reduce inventory shrinkage by up to 45% while saving thousands of labor hours annually.

Retail automation not only lowers costs but also enables teams to focus on higher-value activities such as customer engagement, merchandising strategy, and business growth initiatives.

As a result, 56% of CEOs report profit increases directly linked to digital investments.

Scalable Omnichannel Infrastructure

Consumer shopping behavior has fundamentally changed.

Customers now move seamlessly between websites, mobile apps, social commerce channels, marketplaces, and physical stores before completing purchases.

This shift has made omnichannel retail capabilities essential for long-term growth.

Ecommerce currently represents approximately 23% of total U.S. retail sales and continues to grow significantly faster than traditional retail channels.

Modern transformation initiatives help retailers create unified commerce environments where:

  • Inventory remains synchronized
  • Pricing stays consistent
  • Promotions operate across channels
  • Customer data is centralized
  • Fulfillment options are flexible

A connected infrastructure enables organizations to scale more efficiently while delivering a consistent customer experience regardless of channel.

Faster, Data-Backed Decision-Making

Retail success increasingly depends on decision speed.

Traditional reporting processes often involve multiple systems, delayed updates, and fragmented data sources. This creates decision bottlenecks that slow response times and reduce operational agility.

Digital transformation introduces centralized analytics environments, real-time dashboards, and predictive intelligence tools that accelerate business decision-making.

Common applications include:

  • Demand forecasting
  • Dynamic pricing
  • Inventory optimization
  • Procurement planning
  • Promotion effectiveness analysis

A modern customer data platform can consolidate information from multiple touchpoints, creating a unified view of customer behavior across channels.

At the same time, supply chain digitization improves visibility into inventory movement, vendor performance, and fulfillment operations.

The result is faster decision-making, improved forecasting accuracy, and greater organizational responsiveness.

Key Cons and Risks of Digital Transformation in Retail

Key Cons and Risks

While the benefits of digital transformation in retail industry are substantial, successful implementation is rarely straightforward. Many projects struggle because organizations underestimate costs, integration complexity, organizational resistance, and long-term maintenance requirements.

Understanding these risks helps decision-makers build realistic transformation roadmaps and avoid costly mistakes.

High Upfront Implementation Costs

One of the biggest barriers to digital transformation is the initial investment required.

The digital transformation cost in retail varies significantly depending on project scope, existing infrastructure, and technology requirements. Small pilot initiatives may begin at $15,000–$50,000, while enterprise-wide transformation programs can exceed $500,000.

Costs typically include:

  • Software licensing
  • Cloud infrastructure
  • System integrations
  • Data migration
  • Consulting services
  • Security implementation
  • Employee training

Many retailers focus on software pricing while underestimating implementation and operational expenses. This often leads to budget overruns and delayed ROI realization.

The challenge becomes even greater when legacy systems require extensive customization before modernization efforts can begin.

Legacy System Integration Complexity

Many retailers operate technology environments built over decades.

These ecosystems often include:

  • Legacy ERP systems
  • Standalone CRM platforms
  • Aging POS infrastructure
  • Custom inventory tools
  • Disconnected reporting systems

Integrating modern solutions into these environments can be technically complex and time-consuming.

While cloud-based middleware and phased migration strategies help reduce risk, they also add implementation timelines and project costs.

Organizations frequently discover that integration challenges consume more resources than the new technology itself.

For this reason, system architecture assessments should be conducted before major investments are approved.

Organizational Resistance and Talent Gaps

Technology adoption depends as much on people as it does on software.

Employees often resist changes that alter workflows, introduce new systems, or require unfamiliar skills. Without proper change management, even technically successful projects can fail operationally.

Retailers that invest in employee enablement frequently achieve better outcomes. One major retailer reported a 50% reduction in employee turnover and a 60% decrease in hiring costs after modernizing workforce experiences and providing structured training programs.

However, many organizations lack internal expertise in:

  • Artificial intelligence
  • Data engineering
  • Cloud architecture
  • Automation technologies
  • Advanced analytics

This talent shortage often creates dependence on external partners and increases implementation costs.

Data Privacy and Cybersecurity Exposure

As digital capabilities expand, so does cybersecurity risk.

Transformation initiatives typically increase the amount of customer, transaction, and operational data collected across the organization.

While this data enables personalization and business intelligence, it also creates additional security responsibilities.

Retailers must address:

  • Customer privacy requirements
  • Payment security standards
  • Regulatory compliance
  • Access control policies
  • Threat monitoring

Compliance frameworks such as GDPR, PCI-DSS, and region-specific privacy regulations add complexity and cost to transformation programs.

A single security incident can undermine customer trust and significantly impact business performance.

Unclear ROI Timelines for New Retail Formats

Not every digital innovation delivers immediate business value.

Technologies such as:

  • AR-powered shopping experiences
  • Virtual stores
  • Frictionless checkout systems
  • Smart mirrors
  • Microstores

continue to generate interest, but long-term profitability remains uncertain in many use cases.

While flagship retailers often achieve strong marketing outcomes from these initiatives, widespread scalability has not been consistently demonstrated.

Decision-makers should separate proven technologies from experimental innovations and avoid assuming every emerging technology will generate measurable returns.

A disciplined retail digital transformation strategy prioritizes business outcomes rather than technology trends.

Digital Transformation in Retail: Pros vs. Cons Comparison Table

FactorProsCons
Cost12–40% operational savings after deployment$15K–$500K+ upfront investment
RevenueUp to 40% increase in basket size through personalizationROI often requires 12–24 months
ScalabilityUnified omnichannel infrastructureLegacy integration bottlenecks
Customer ExperiencePersonalized journeys, AI assistants, AR experiencesData privacy and security concerns
WorkforceReduced turnover and improved productivityTraining and change management costs
TechnologyAI, automation, cloud-native flexibilityExperimental technologies remain unproven

The comparison highlights a key reality: transformation creates significant value when executed properly, but organizations must account for implementation complexity before expecting measurable returns.

ROI Benchmarks for Retail Digital Transformation

For most executives, the success of a transformation initiative is ultimately measured through business outcomes.

Research indicates that approximately 41% of organizations achieve positive returns within two years of implementing digital transformation programs.

The strongest retail technology ROI typically comes from initiatives focused on operational efficiency, customer retention, and process automation rather than experimental innovation projects.

Retailers leveraging external expertise in analytics and AI implementation often achieve ROI approximately 40% faster than organizations relying exclusively on internal teams.

Automation projects have also demonstrated strong financial performance. Certain robotic process automation implementations report first-year returns approaching 200% when applied to repetitive operational tasks.

One of the most visible examples is Target’s digital transformation strategy. The company’s mobile application supports millions of daily active users, while digital fulfillment initiatives such as Drive Up have become major contributors to overall digital revenue.

To evaluate transformation performance effectively, retailers should monitor:

  • Customer retention rate
  • Revenue from digital channels
  • Net Promoter Score (NPS)
  • Customer Lifetime Value (CLV)
  • Average Order Value (AOV)
  • Operational cost savings
  • Inventory turnover improvements

Tracking these KPIs consistently provides a clearer picture of transformation impact than relying solely on revenue growth.

Cost and Pricing Insights for Retail Digital Transformation

The cost of transformation depends largely on business size, technology maturity, and implementation scope.

Cost Breakdown by Transformation Scale

Project ScopeEstimated Investment
Small Pilot Projects$15,000–$50,000
Mid-Scale Transformation$75,000–$200,000
Enterprise Transformation$300,000–$500,000+

Rather than pursuing large-scale transformations immediately, many organizations benefit from phased implementation strategies.

A commonly recommended budgeting approach is the 70-20-10 rule:

  • 70% invested in proven technologies
  • 20% invested in emerging opportunities
  • 10% invested in experimental innovation

This model balances operational stability with innovation.

Hidden Costs Retailers Often Overlook

Beyond technology investments, retailers should budget for:

  • Data migration
  • Employee training
  • Security compliance
  • Infrastructure upgrades
  • Vendor onboarding
  • Integration services
  • Ongoing support contracts

These costs frequently exceed initial expectations.

One effective risk-reduction strategy involves launching smaller MVP-style pilots before scaling transformation initiatives across the organization.

This allows retailers to validate business outcomes before committing larger budgets.

Vendor Selection Checklist for Retail Digital Transformation

Selecting the right technology partner can determine whether a transformation initiative generates measurable business value or becomes an expensive operational challenge.

The most successful retail transformation programs prioritize scalability, integration readiness, and long-term business outcomes rather than focusing solely on software features.

Evaluation Criteria for Retail Technology Vendors

Before selecting a transformation partner, executives should evaluate the following:

  • Does the solution support modular, API-ready architecture?
  • Can it integrate with existing ERP, CRM, and POS platforms?
  • Does the vendor have proven retail implementation experience?
  • Is a phased rollout approach available?
  • Are MVP-first engagement models supported?
  • Is pricing subscription-based, project-based, or hybrid?
  • Are there vendor lock-in clauses?
  • What change management and employee training programs are included?
  • Does the vendor provide post-deployment analytics and ROI reporting?
  • What security certifications are maintained?
  • Does the platform support future scalability requirements?
  • How are ongoing support and maintenance handled?

Strong vendors focus on business outcomes, adoption rates, and measurable ROI rather than simply delivering software.

Questions Every Retail Executive Should Ask

Many transformation failures occur because organizations fail to ask critical questions before signing contracts.

Key questions include:

  • How long will implementation take?
  • What integrations require custom development?
  • What are the expected ROI milestones?
  • What hidden costs should be anticipated?
  • What internal resources are required?
  • What risks have been encountered in similar projects?

These discussions often reveal more about vendor suitability than product demonstrations.

Looking for an offshore technology partner to architect your retail digital transformation? Talk to Tibicle’s team for a free consultation and roadmap assessment.

Top Tools and Platforms Driving Retail Digital Transformation

digital transformation in retail

Modern retail transformation initiatives are often powered by specialized technology platforms designed to improve customer engagement, operational efficiency, and scalability.

Shopify

One of the most widely adopted e-commerce platforms, Shopify provides omnichannel commerce capabilities, integrated payments, analytics, and growing AR commerce functionality.

Salesforce Commerce Cloud

Salesforce combines CRM, customer engagement, loyalty management, and unified commerce tools within a single ecosystem.

SAP S/4HANA

SAP remains a leading solution for retailers requiring advanced ERP capabilities, supply chain visibility, procurement management, and enterprise reporting.

Google Cloud Vertex AI

Retailers use Vertex AI to deploy machine learning models for demand forecasting, personalization, inventory optimization, and customer analytics.

AWS for Retail

AWS provides cloud infrastructure, personalization services, data lakes, analytics environments, and scalable retail workloads.

Scandit

Scandit helps retailers improve inventory management and customer engagement through AR-powered barcode scanning and mobile commerce experiences.

Standard AI

Standard AI focuses on autonomous checkout, store intelligence, and computer vision technologies that reduce friction during the shopping experience.

Why Tibicle Is a Strong Choice for Retail Digital Transformation Projects

Many retailers face a common challenge: off-the-shelf software rarely aligns perfectly with operational requirements.

While SaaS platforms solve specific problems, organizations often require custom integrations, automation workflows, analytics systems, and customer experiences that extend beyond standard functionality.

Tibicle helps retailers bridge this gap by providing custom software development, cloud modernization, automation solutions, AI integrations, and managed technology services.

Key strengths include:

  • API-ready architecture design
  • Cloud migration expertise
  • AI and machine learning integration
  • Custom retail software development
  • DevOps and managed services
  • Automation workflow implementation
  • Data and analytics engineering

Unlike vendors focused on a single platform, Tibicle supports retailers needing flexible, scalable technology ecosystems built around their unique operational requirements.

With experience across SaaS architecture, cloud infrastructure, automation, and emerging technologies, Tibicle helps organizations implement transformation initiatives through phased, business-driven engagement models.

Explore how Tibicle can support your retail technology roadmap and future growth strategy.

Conclusion

The benefits of digital transformation in retail industry are clear. Organizations implementing the right technologies can improve customer experiences, increase operational efficiency, reduce costs, and create new revenue opportunities.

However, transformation success depends on more than technology selection. Implementation complexity, legacy systems, organizational readiness, and vendor expertise all influence outcomes.

Executives should evaluate opportunities using measurable business criteria rather than focusing solely on technology trends. The comparison framework, ROI benchmarks, cost considerations, and vendor checklist outlined in this guide provide a practical foundation for building a stronger business case.

When approached strategically, digital transformation becomes a growth accelerator rather than a technology expense.

Ready to start your retail digital transformation journey? Contact Tibicle for a free technology assessment and roadmap consultation.

FAQs

What is digital transformation in the retail industry?
Digital transformation in the retail industry involves integrating technologies such as AI, cloud computing, analytics, automation, and IoT across operations to improve customer experience, efficiency, and revenue growth.

How much does digital transformation cost for a retail business?
Costs typically range from $15,000 for focused pilot projects to more than $500,000 for enterprise-wide transformation initiatives, depending on complexity and scope.

What is the average ROI timeline for retail digital transformation?
Research indicates that approximately 41% of organizations achieve measurable ROI within two years of implementation, while targeted automation initiatives often deliver returns more quickly.

What are the biggest risks of digital transformation in retail?
The most common risks include high upfront costs, legacy system integration challenges, organizational resistance, cybersecurity concerns, and uncertain ROI from experimental technologies.

How do I choose the right digital transformation vendor?
Evaluate vendors based on retail experience, integration capabilities, architecture flexibility, security certifications, implementation methodology, pricing transparency, and post-launch support.

Can small and mid-sized retailers afford digital transformation?
Yes. Many retailers begin with focused pilot projects, automation initiatives, or low-code implementations that validate ROI before scaling investment across the business.

What is Retail Automation? ROI, Pricing, and Vendor Selection for 2026

Introduction

The global retail automation market hit $27.65 billion in 2025 and is projected to reach $77.36 billion by 2034, growing at a 12% CAGR (Fortune Business Insights). That growth rate is not a coincidence, it reflects a fundamental shift in how retail businesses manage costs, scale operations, and serve customers in an environment that no longer tolerates inefficiency.

retail automation

Retail leaders face several operational challenges today: rising labor costs, complex omnichannel fulfillment, shrinking margins, and unstable supply chains. Manual processes cannot handle these pressures efficiently.Businesses that continue managing these challenges manually are not holding stead, they are falling behind competitors who have already automated.

This guide is written specifically for executives and operations decision-makers who are evaluating retail automation as a strategic investment, not a technology experiment. It explains what retail automation is, breaks down its core types and real-world use cases, and provides the ROI benchmarks, pricing context, and vendor evaluation criteria you need to make a defensible, well-informed decision.

What is Retail Automation?

Retail automation is the use of software, artificial intelligence, robotics, IoT sensors, and integrated systems to replace or significantly reduce manual intervention in repetitive retail operations across in-store, warehouse, and digital channels.

The scope of retail automation is broader than most executives initially assume. It is not limited to self-checkout kiosks or customer-facing chatbots. Modern retail automation solutions encompass inventory management, dynamic pricing, supply chain coordination, marketing execution, order fulfillment, workforce scheduling, compliance reporting, and customer analytics. It covers the full operational stack, front-of-store, back-office, warehouse, and e-commerce simultaneously.

According to the World Economic Forum, AI services in the retail sector alone are expected to grow from $5 billion to $31 billion by 2028, underscoring how quickly intelligent automation is moving from pilot programs to core business infrastructure.

What retail automation is not: a single platform purchase, a one-time deployment, or a front-of-store novelty. The most impactful retail automation strategies address back-office efficiency, warehouse throughput, and supply chain visibility in parallel, not just the customer-facing touchpoints that tend to receive the most attention.

Core Technologies Behind Retail Automation

retail automation

Understanding the technologies behind retail automation helps decision-makers evaluate vendors. It also helps them choose solutions that match their operational needs.

AI and Machine Learning

Artificial intelligence is the analytical backbone of modern retail automation. Machine learning models drive demand forecasting, enabling retailers to predict stock requirements with significantly greater accuracy than rule-based or spreadsheet-driven approaches. AI also powers dynamic pricing, adjusting prices in real time based on demand signals, competitor data, and inventory position, and enables personalized marketing by identifying behavioral patterns across millions of customer interactions.

Data point: 84% of organizations that have invested in AI report positive ROI, according to Deloitte. In retail specifically, AI-driven retail automation has shifted from an experimental budget line to a core profitability lever for businesses operating at scale.

Robotic Process Automation (RPA)

RPA automates rule-based, high-volume tasks that previously required manual handling: data entry, invoice processing, inventory reconciliation, returns documentation, and compliance reporting. Unlike AI, RPA does not learn or adapt, it executes defined workflows reliably at scale, making it particularly valuable for back-office retail process automation where consistency and volume are the primary requirements.

The global RPA market is projected to reach $35.27 billion in 2026 (Grand View Research), driven significantly by retail and logistics adoption across both mid-market and enterprise segments.

IoT and Smart Sensors

IoT-enabled devices allow retailers to monitor inventory levels in real time, track shelf conditions, detect stockouts before they affect sales, and manage temperature-sensitive storage for perishable categories. These sensors feed live data into centralized dashboards, enabling faster and more accurate operational decisions without requiring manual floor checks or periodic audits.

Cloud Computing and Analytics

Cloud infrastructure provides the centralized data access and processing power required for cross-channel retail automation. Cloud-native platforms connect POS transactions, e-commerce activity, warehouse operations, and customer behavior into unified BI dashboards, eliminating the data silos that fragment decision-making in manually operated retail environments.

Types of Retail Automation by Function

Retail automation operates across five primary functional areas. The business case and ROI profile differ meaningfully across each, which is why implementation sequencing matters as much as platform selection.

Inventory and Warehouse Automation

Inventory automation encompasses RFID-based tracking, automated reorder triggers tied to real-time sales velocity and supplier lead time data, and goods-to-person fulfillment systems that move products through warehouses without manual picking. This area consistently delivers the fastest and most measurable ROI for mid-to-large retailers.

Stat: Over 4.6 million commercial warehouse robots will be installed worldwide by the end of 2026 (SellersCommerce), reflecting the scale at which retail warehouse automation is being deployed across the industry globally.

Checkout and Payment Automation

Self-checkout kiosks, cashierless store formats, and contactless payment systems reduce front-of-store labor dependency and decrease transaction times in ways that directly affect customer satisfaction scores. Automated retail systems in this category have moved well beyond novelty deployments.

A frequently cited real-world example: Decathlon’s RFID-based checkout system reduced average transaction time from 20 minutes to under 1 minute by allowing customers to check out an entire cart without scanning individual items, a direct result of integrated retail automation applied at the point of sale.

Marketing and Customer Engagement Automation

Automated retail systems can trigger personalized email campaigns, loyalty program notifications, and product recommendations based on real-time customer behavior, without manual campaign management for each segment. These systems connect CRM data, purchase history, and browsing behavior to deliver contextually relevant engagement at scale, turning customer data into revenue without proportional increases in marketing headcount.

Supply Chain and Order Fulfillment Automation

Retail supply chain automation extends across demand forecasting, dynamic carrier routing, and end-to-end delivery tracking. These systems reduce manual coordination between procurement, warehousing, and logistics teams, improving delivery speed and reducing the costly errors that propagate through manual handoffs across the supply chain.

Back-Office and HR Automation

Payroll processing, workforce scheduling, timekeeping, and compliance reporting are high-volume, error-prone functions that retail process automation handles efficiently. Automating these workflows reduces administrative overhead, decreases compliance exposure, and allows operations managers to focus on strategic decisions rather than routine administrative processing.

Retail Automation Use Cases by Industry Vertical

retail automation

Retail automation applies differently depending on the business model, supply chain structure, and customer base. These are the four most significant vertical applications currently in deployment.

Grocery and Supermarkets

Grocery retailers manage high SKU volumes, tight margins, and perishable inventory, a combination that makes retail automation particularly high-impact in this segment. Key use cases include automated replenishment driven by real-time POS sales data, smart shelf monitoring to detect stockouts and misplacements before they affect revenue, and perishable inventory optimization to reduce waste and markdown costs at scale.

Fashion and Apparel

Fashion retail faces extreme demand volatility at the SKU and regional level, a single color or size variant can swing from overstock to stockout within days of a trend shift. Automation in the retail industry addresses this through demand sensing models that adjust buying and allocation decisions dynamically. Returns automation and visual merchandising analytics also reduce operational complexity in a category defined by high SKU counts and short product life cycles.

E-Commerce and D2C

For e-commerce and direct-to-consumer brands, automated retail systems power the entire order-to-delivery workflow. AI-driven product recommendations increase average order value, warehouse robotics accelerate pick-and-pack throughput, and automated order routing optimizes carrier selection and delivery timelines simultaneously.

Data point: Global online retail sales are projected to reach $6.88 trillion in 2026 (SellersCommerce). At that scale, fulfillment speed and accuracy requirements can only be reliably met through retail automation.

Multi-Location and Franchise Retail

Retail automation is particularly valuable for operators managing dozens or hundreds of locations. Centralized inventory visibility eliminates stock imbalances between stores, standardized automated workflows ensure operational consistency across franchisees, and cross-store performance benchmarking enables management to identify underperforming locations and respond faster than manual reporting cycles allow.

Retail Automation Comparison: Manual vs. Partially Automated vs. Fully Automated

retail automation

The table below illustrates the operational difference between manual, partially automated, and fully automated retail operations across eight key performance parameters.

ParameterManual OperationsPartially AutomatedFully Automated
Inventory Accuracy60–70%85–90%95–99%
Order Processing TimeHoursMinutesSeconds
Labor DependencyHighMediumLow
Error RateHighModerateMinimal
ScalabilityLimitedModerateHigh
Initial InvestmentLowMediumHigh
Long-Term Cost EfficiencyPoorGoodOptimal
Customer ExperienceInconsistentImprovedSeamless

When does partial automation make sense? For small-to-mid-size retailers with moderate SKU volumes and limited IT infrastructure, partial retail automation is often the right entry point. Automating high-impact areas, inventory management and POS, before committing to warehouse robotics or AI-driven marketing, allows businesses to build operational maturity and prove ROI without overextending capital.

When does full automation make sense? Enterprise retailers, large e-commerce operators, and multi-location chains managing high transaction volumes and complex supply chains derive the clearest ROI from full-stack retail automation. At this scale, labor cost reduction, throughput gains, and error elimination deliver measurable returns within 2–3 years of implementation, and partial automation creates coordination gaps that compound over time.

How Much Does Retail Automation Cost? Pricing Models and Budget Ranges

Automation Cost

Retail automation investment decisions require clarity on both pricing structure and total cost of ownership, not just the licensing fee presented in a vendor proposal.

Common Pricing Structures

SaaS subscription: Monthly or annual fees per store location, per user, or per transaction volume. This model suits retailers who need fast deployment with lower upfront capital requirements and prefer predictable recurring costs.

Custom development: A one-time build cost plus ongoing maintenance and support. This model fits retailers with unique workflows, legacy system constraints, or competitive differentiation requirements that off-the-shelf platforms cannot address.

Hybrid model: A platform license combined with implementation services and ongoing customization. Common for enterprise retail automation deployments requiring both a proven platform foundation and significant configuration work to match existing operational workflows.

Budget Ranges by Automation Type

  • POS and checkout automation: $5,000–$50,000 per store, depending on hardware requirements and software integrations
  • Inventory management platforms (SaaS): $500–$5,000 per month, based on location count and feature scope
  • Warehouse robotics: $100,000–$1M+ depending on facility size, throughput requirements, and system complexity
  • Full-stack retail automation suite (enterprise): $250,000–$2M+ for integrated implementations covering inventory, fulfillment, POS, and analytics

Hidden Costs to Account For

Decision-makers consistently underestimate three cost categories that rarely appear in vendor pricing sheets:

Legacy system integration: Connecting modern retail automation platforms to existing ERP, CRM, or WMS infrastructure often requires custom middleware, adding $20,000–$150,000+ to implementation costs depending on system age and compatibility.

Staff training and change management: Retraining employees and managing the organizational transition to automated workflows is a real cost in both time and productivity impact during the changeover period.

Ongoing maintenance and vendor lock-in risk: Proprietary retail automation platforms may impose annual fee increases, limit customization options, or create switching costs that restrict your flexibility as business requirements evolve. Total cost of ownership calculations must account for these from the start, not after contract signature.

ROI of Retail Automation: What the Data Shows

The business case for retail automation is not speculative. Consistent, cross-industry data from organizations that have implemented automation at scale provides a credible foundation for investment decisions.

Revenue and Efficiency Gains

  • Stores deploying automated technology report an 11% increase in customer visits (Research Nester industry survey)
  • Organizations that have implemented AI-driven retail automation report 5x–10x returns on investment across multi-year deployments (OneReach AI/Gartner).
  • Retailers across segments are actively planning to automate 70% of daily routine tasks by 2025–2026

Live deployments reflect these outcomes., not vendor projections or controlled lab environments.

Cost Reduction Benchmarks

  • Labor cost reduction: 20–30% reduction in labor costs for repetitive, rule-based tasks is consistently reported across retail automation implementations
  • Data accuracy: Automated data entry and report generation achieve up to 100% accuracy compared to manual processes, eliminating costly errors in inventory counts, order processing, and financial reporting
  • Warehouse automation ROI: Most warehouse retail automation investments reach positive ROI within 2–3 years, with ongoing returns increasing as throughput scales

Calculating ROI for Your Business

The standard ROI formula for retail automation investments:

ROI = (Annual savings + Revenue uplift from automation) / Total cost of ownership

The key input variables to quantify before committing to any vendor:

  • Labor cost offset: Current annual spend on tasks being automated vs. post-automation labor requirement
  • Error reduction savings: Cost of current errors, inventory shrinkage, order mistakes, compliance penalties vs. post-automation error rates
  • Throughput increase: Revenue impact of faster order processing and improved inventory availability
  • Customer retention lift: Long-term revenue impact of improved service consistency and personalized engagement at scale

Most retailers who complete a structured ROI analysis before implementation find that the business case is clearest in inventory management and warehouse operations, with payback periods in these areas typically ranging from 12–24 months for mid-size deployments.

Risks and Challenges of Implementing Retail Automation

Risks and Challenges

A balanced evaluation of retail automation requires honest assessment of the risks, not just the efficiency gains. These are the four most consistently reported implementation challenges.

High Upfront Investment and Unclear Payback

Retailers often cite budget pressure(41%) and ROI uncertainity(40%) as major barriers, according to the MHI 2025 Annual Industry Report. Without a structured business case and phased implementation plan, large upfront investments in automated retail systems can stall mid-project or fail to deliver expected returns against unclear baselines.

Integration with Legacy Systems

Most established retailers are operating POS, CRM, and inventory platforms that were not built with modern API integration in mind. Connecting new retail automation solutions to this infrastructure creates data silos, synchronization delays, and operational gaps that directly reduce realized ROI. Middleware solutions and phased migration strategies are the standard approach to managing this risk without requiring full infrastructure replacement.

Workforce Resistance and Change Management

Retail process automation displaces tasks before it displaces people, but employees whose roles change significantly are often the most effective friction point in new system adoption. Retailers who build career development pathways alongside automation deployment, provide hands-on training before go-live, and communicate the strategic rationale behind retail automation decisions consistently report faster adoption rates and fewer implementation setbacks.

Vendor Lock-In and Scalability Limitations

Many retail automation platforms are built on proprietary architectures that restrict future flexibility. Once workflows, data structures, and integrations are built around a single vendor’s system, switching costs become a significant operational barrier. Decision-makers should evaluate API-first, modular platforms that allow individual components to be replaced or upgraded independently, without requiring full system replacement when business requirements change.

Vendor Selection Checklist for Retail Automation

Use this checklist before committing to any retail automation solution or vendor contract:

  • API-first integration: Does the vendor support modular integration with your existing ERP, CRM, WMS, and POS systems without requiring full platform replacement?
  • Multi-channel scalability: Can the retail automation solution scale across multiple store locations, warehouse facilities, and digital sales channels without significant re-implementation?
  • Total cost of ownership: Has the vendor provided a complete TCO breakdown, including implementation, training, ongoing maintenance, and integration, not just licensing fees?
  • Industry-specific experience: Does the vendor offer documented case studies and use cases in your specific retail vertical (grocery, apparel, e-commerce, multi-location)?
  • Time-to-value: What is the reported average payback period from existing clients in comparable deployments?
  • Cloud-native architecture: Is the retail automation platform cloud-native with real-time data access and cross-channel visibility built in, not bolted on as an add-on?
  • Customization capability: Can the platform be configured to match your specific workflows without requiring heavy custom development from the vendor’s professional services team?
  • SLA-backed support: Does the vendor offer guaranteed response times, dedicated onboarding support, and clearly defined escalation paths?
  • Data security and compliance: How does the vendor handle data privacy, security certifications (SOC 2, ISO 27001), and regulatory compliance relevant to your markets?
  • Exit strategy: What does data portability look like if you need to migrate away from the platform? Is there a documented off-boarding process?

Top Retail Automation Tools and Platforms in 2026

Honeywell offers a broad portfolio of retail automation hardware and software, with particular strength in RFID-based inventory tracking, barcode scanning systems, and supply chain visibility solutions. Their platforms are widely deployed across large-scale warehouse and retail distribution environments globally.

NCR Voyix (formerly NCR Corporation) is one of the most established vendors in checkout automation, POS automation, self-checkout kiosk deployment, and workforce management for retail. Their solutions are commonly found across grocery, convenience, and hospitality retail environments.

Zebra Technologies specializes in mobile computing, RFID, and real-time supply chain visibility. Their devices and software are widely used for inventory management and workforce productivity across retail and logistics operations, with a strong installed base in large-format retail.

AutoStore is a leading provider of robotic micro-fulfillment systems, offering grid-based retail warehouse automation that significantly increases storage density and picking throughput. Their systems are used by retailers requiring high-volume, space-efficient order fulfillment in constrained warehouse footprints.

SAP, Oracle, and NetSuite provide enterprise ERP platforms with integrated retail automation modules covering inventory management, order management, financial reporting, and supply chain planning. These platforms typically serve as the integration backbone for full-stack automated retail systems at enterprise scale.

If you need a custom-built retail automation solution designed specifically around your workflows and existing tech stack, Tibicle’s development team can help. 

How Tibicle Supports Retail Automation Projects

Tibicle builds custom retail automation solutions based on each business’s operational needs. Instead of forcing businesses to adjust to fixed platforms, Tibicle creates solutions that fit existing workflows.

With experience across logistics, healthcare, HR, and manufacturing, Tibicle focuses on API-first architecture. This helps connect new automation systems with existing tools without replacing the entire infrastructure.

Tibicle supports mid-market and enterprise retailers that need custom integrations, scalable workflows, or solutions beyond standard platforms.

The key difference is flexibility. Tibicle designs retail automation systems around your processes, helping reduce integration risks, improve implementation speed, and avoid vendor lock-in.

Conclusion

Retail automation is no longer a competitive advantage reserved for the largest global retailers. Rising labor costs, omnichannel complexity, and growing customer expectations have moved automation in the retail industry from optional to operationally essential for any business managing meaningful transaction volume.

Most retail executives are no longer deciding whether to automate. They are deciding where to start, which vendor fits their needs, and how to measure returns before investing.

The decision facing most retail executives today is not whether to automate, but where to start, which vendor model fits their infrastructure and budget, and how to measure returns clearly before committing capital at scale.

The ROI data is consistent across industries and geographies: businesses that adopt retail automation systematically, with a clear business case, structured vendor evaluation, and a phased implementation plan, see measurable returns within 12–36 months. Those that delay continue to absorb the compounding costs of manual operations in an environment that has already moved on.

Ready to build a retail automation solution that fits your business? Contact Tibicle’s team for a free consultation.

Frequently Asked Questions

Q1: What is retail automation and how does it work?
Retail automation uses AI, robotics, IoT, and software to automate repetitive retail tasks like inventory tracking, checkout, fulfillment, and customer engagement. It connects with existing systems to improve speed, accuracy, and efficiency.

Q2: How much does retail automation cost for a mid-size retailer?
Retail automation costs vary based on the solution and business needs. SaaS tools may start around $500/month, while advanced warehouse automation can exceed $1M. Most mid-size retailers invest based on their operational goals and required features.

Q3: What is the average ROI of retail automation?
Retail automation can deliver strong ROI through lower costs, faster operations, and fewer errors. Many businesses achieve positive ROI within 12–24 months, depending on their automation scope and goals.

Q4: What are the biggest risks of implementing retail automation?
The main risks include high costs, integration challenges, employee resistance, and vendor lock-in. However, a phased rollout and proper vendor evaluation can reduce these risks.

Q5: Can retail automation work with existing POS and ERP systems?
Yes, retail automation works with existing POS, ERP, CRM, and WMS systems. Modern solutions use API integrations to connect with existing software and improve workflows.

Q6: How do I choose the right retail automation vendor?
Choose a vendor based on API compatibility, scalability, pricing, industry experience, security, and support. A reliable retail automation vendor should fit your existing systems and help you achieve measurable results.