0%

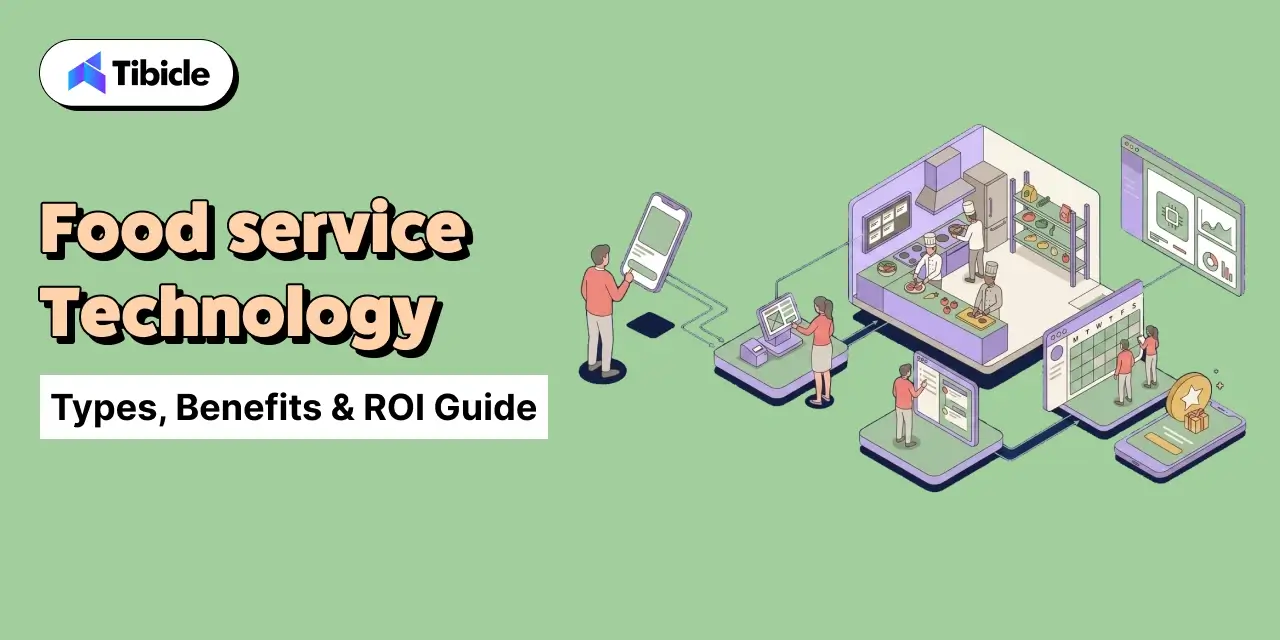
What Is Food Service Technology? A Decision-Maker’s Guide

What This Guide Covers

Who this is for: Restaurant owners, multi-location operators, hospitality groups, cloud kitchen businesses, and operations leaders evaluating food service technology to improve operational efficiency, reduce costs, and build a technology stack that supports long-term growth.

Search intent: Commercial investigation. This guide is written for decision-makers who already understand the role of technology in restaurants and are evaluating which systems to implement, how much they cost, what return they generate, and how to avoid expensive implementation mistakes.

What you will walk away with: A detailed breakdown of the major categories of food service technology, pricing expectations, implementation costs, ROI benchmarks, vendor evaluation criteria, technology comparisons, and a practical framework for selecting the right technology stack for your restaurant.

Introduction

food service technology

Restaurant margins sit at 3 to 5%. Labor costs consume 30 to 35% of revenue. Without proper tracking, 30 to 40% of food inventory gets wasted before it ever reaches a plate. These are not abstract industry complaints; they are the exact gaps food service technology exists to close.

Food service technology is the connected stack of hardware, software, and AI-driven systems that runs restaurant operations end to end: order capture, kitchen execution, inventory, labor, compliance, and customer retention, all reporting through one operational layer instead of three disconnected ones.

If you’re evaluating whether food service technology is worth the investment, this guide gives you the numbers, the comparisons, and the checklist to decide.

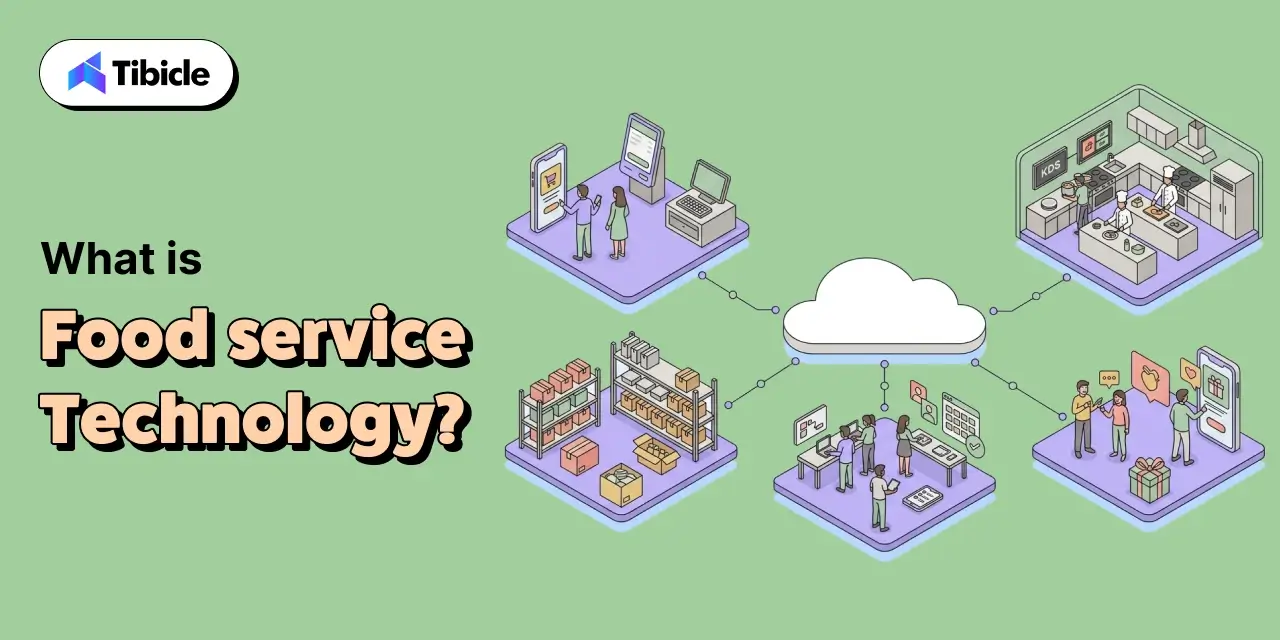
What Is Food Service Technology?

Food service technology refers to the integrated stack of hardware, software, and AI-driven systems that manage restaurant operations end to end, from order capture and kitchen execution to inventory, labor, compliance, and customer retention. It is the layer connecting the front counter, the back kitchen, and the supply chain into one reporting system.

food service technology

How It Differs from Generic Business Software

Generic ERP or retail POS platforms are not built for food service math. Retail software handles a static SKU count and predictable shelf life. A restaurant runs real-time order throughput across dine-in, delivery, and pickup at once, carries HACCP compliance requirements, and manages inventory that spoils in days rather than months. That gap is why category-specific architecture exists instead of retrofitted retail software.

Where Food Service Technology Sits in Your Operations Stack

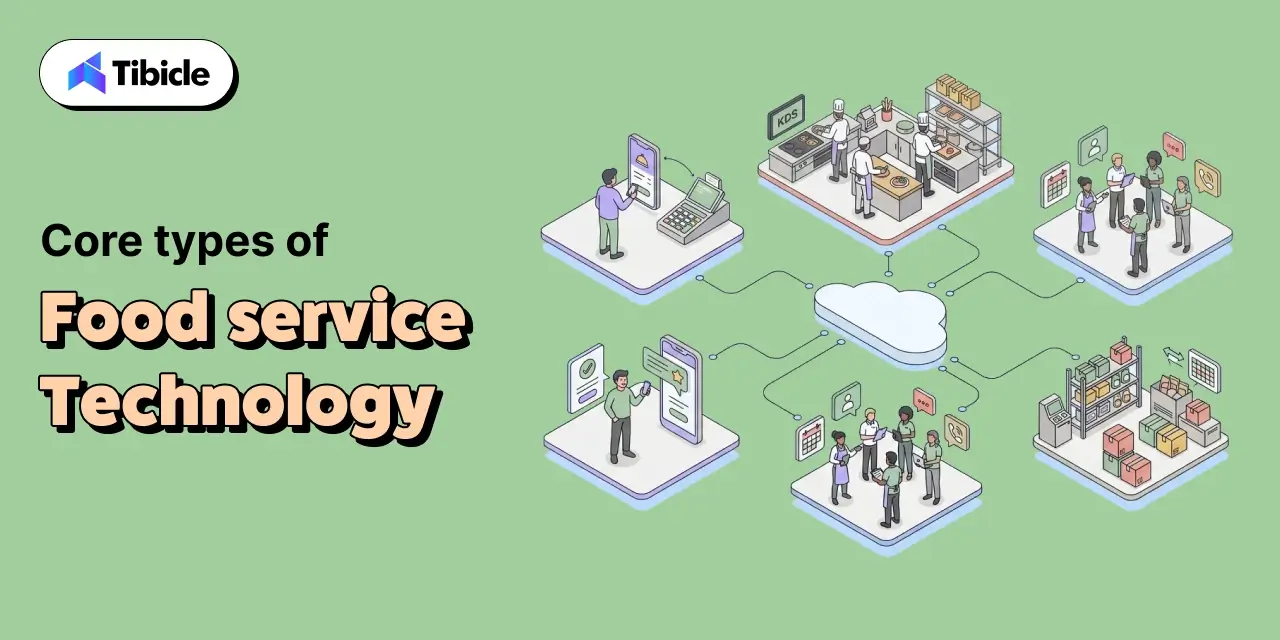
Four layers make up the stack. Front-of-house handles order capture and guest interaction. Back-of-house handles kitchen execution and prep. Supply chain covers procurement and inventory. The data layer sits above all three, turning transaction records into reporting and forecasting.

Core Types of Food Service Technology

food service technology

Point-of-Sale (POS) Systems

Modern POS software is no longer a transaction terminal; it functions as the central data hub for a restaurant. Multi-location support, real-time reporting, and native integrations with loyalty and delivery platforms determine which POS actually operates as infrastructure rather than a cash register with a screen. Toast, Square, Lightspeed, and Clover cover most of the market across different price and complexity tiers.

Kitchen Display Systems (KDS) and Automation

Kitchen display systems replace paper tickets with digital, updatable order queues visible across the entire back of house. This removes the miscommunication that paper handoffs cause during a rush and keeps modifiers and special requests visible in real time. Restaurants running a connected KDS report measurable improvement in table turn speed during peak service hours.

Inventory and Procurement Management Software

Inventory and procurement software tracks stock at the ingredient level, flags variance in real time, and generates AI-powered reorder recommendations tied directly to supplier data. Restaurants implementing modern inventory platforms report ROI above 150% in year one. (Supy, 2025)

Online Ordering and Digital Channels

Online ordering spans third-party marketplaces, first-party ordering apps, and QR code menus, each carrying its own margin profile. Restaurants running digital ordering channels see average check sizes roughly 30% higher than dine-in-only locations.

Labor Scheduling and Payroll Platforms

Labor is the single largest controllable expense in food service, typically 30 to 35% of revenue. Scheduling software targets that cost directly through demand forecasting, compliance tracking, and overtime alerts, catching problems before payroll processes them.

Food Safety and Compliance Technology

Cloud-based HACCP logging, IoT temperature sensors, and audit trail software turn compliance from a paper binder into a searchable record. A single safety violation or foodborne illness outbreak can cost an operator millions in lost sales and recall expenses, which is why this category functions as risk management rather than admin overhead.

Customer Loyalty and CRM Platforms

Loyalty and CRM platforms tied directly to POS data allow personalized offers based on actual visit and spend history instead of generic discounting. A 5 percentage point improvement in customer retention through loyalty programs can lift profit by up to 95%. (Bain, 2025)

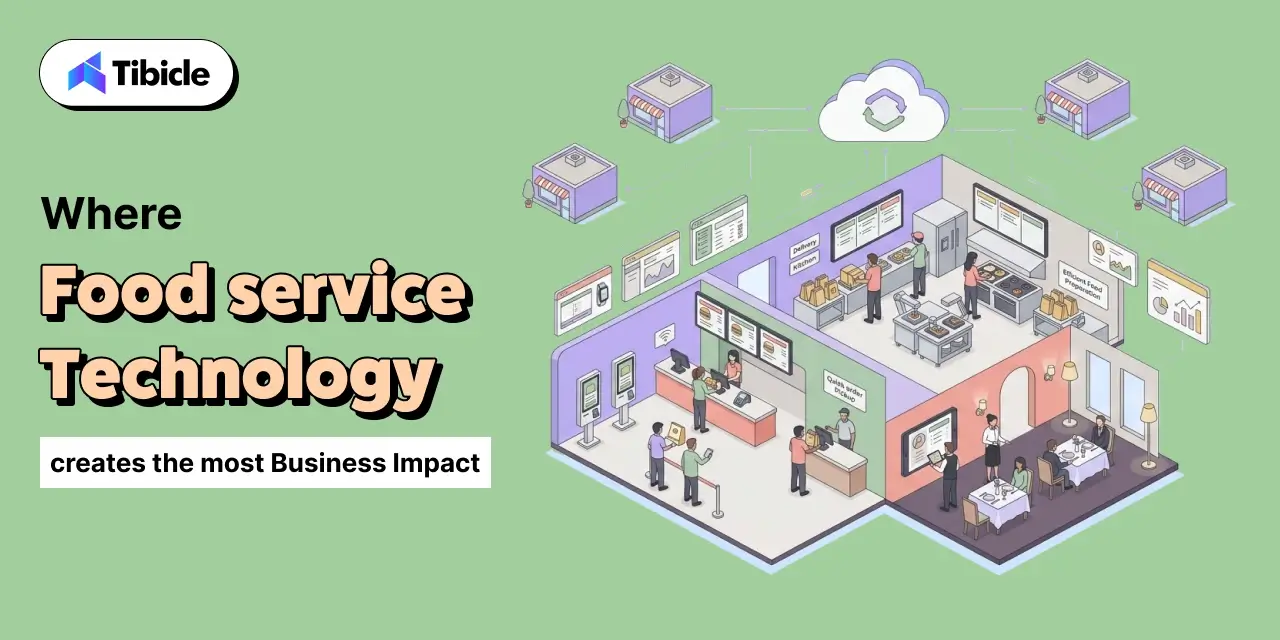
Where Food Service Technology Creates the Most Business Impact

restaurant business models

Multi-Location Chains

At a multi-location scale, manual reporting and inconsistent operational controls stop working. Centralized data visibility, standardized processes, and cross-location benchmarking turn restaurant operations technology into required infrastructure rather than a convenience.

Fast-Casual and QSR Operators

Speed is the core KPI for fast-casual and QSR operators. Self-ordering kiosks, AI-powered drive-thru voice systems, and dynamic menu pricing all target throughput directly. IHOP and Applebee’s have both deployed voice AI agents to manage phone order volume at scale.

Fine Dining and Hospitality Groups

For fine dining and hospitality groups, CRM-driven personalization, reservation integration, and guest preference tracking build the ROI case around lifetime customer value rather than transaction speed.

Ghost Kitchens and Delivery-First Operators

For ghost kitchens and delivery-first operators, digital ordering systems are the entire operation, not supporting infrastructure. Integration between delivery aggregators, POS, and inventory data decides whether the business runs at a profit or bleeds margin on order errors.

Food Service Technology Comparison: Core Platforms by Function

Each technology category serves a distinct operational function at a different price point and payback window. Use the table below to match the category to your segment and expected ROI timeline before shortlisting vendors.

Technology CategoryCore FunctionBest For Avg. Monthly Cost ROI Timeline 
POS Systems Order management, payments, reporting All segments $0–$399/location 3–6 months 
Inventory Management Stock tracking, AI ordering Multi-unit, high volume $169–$429/month 3–9 months 
Kitchen Automation / KDS Back-of-house speed and accuracy QSR, fast-casual $50–$150/station 3–6 months 
Labor Scheduling Software Staffing, overtime, compliance All segments $50–$200/location 6–12 months 
Digital Ordering / Delivery Online channels, third-party integration Ghost kitchens, QSR Variable + commissions 3–6 months 
Food Safety & Compliance Tech HACCP, IoT monitoring, audit logs All segments, regulated $100–$300/month Ongoing risk reduction 
Loyalty & CRM Platforms Guest retention, personalization Multi-unit, full service $99–$500/month 3–6 months 

Enterprise pricing is custom across most categories. The figures above reflect mid-market tiers.

Not sure which stack fits your operation? Tibicle’s food tech consultants can map the right architecture to your scale and margin goals. Book a discovery call.

Food Service Technology Pricing: What Operators Actually Pay

Software Licensing vs. Total Cost of Ownership

Monthly SaaS pricing is one line item in a longer cost model. Hardware, including terminals, KDS screens, and IoT sensors, implementation and training, transaction processing rates, and integration fees all add to the total cost of ownership. A $189 per month POS plan commonly reaches $800 to $1,200 per month, all-in, once hardware and processing fees are factored in for a single location.

Free Tier vs. Paid Tier; When Free Stops Working

Free plans, such as Square, are the most common example and suit early-stage, single-location operators. Three signals indicate a business has outgrown the free tier: reporting needs span more than one location, inventory tracking requires ingredient-level detail rather than item counts, or the operation needs API access to connect third-party systems. At that point, paid tiers stop being optional.

Enterprise Pricing; What to Negotiate

Above a certain location count, custom pricing becomes standard. The levers worth negotiating are multi-location bundling, annual billing discounts of roughly 10 to 15%, dedicated support SLAs, and onboarding fee waivers.

ROI and Business Impact: The Numbers That Matter

Measured Returns by Technology Category

  • Inventory software: ROI above 150% in year one, with 10 to 15% reduction in food waste. (Supy, 2025)
  • AI forecasting: 20 to 50% reduction in inventory errors. (McKinsey, 2025)
  • Food cost control: 2 to 5% cost reduction through real-time variance detection.
  • Digital ordering: average check is roughly 30% higher than dine-in only.
  • Scheduling automation: $15,000–$40,000 in avoided manager replacement costs over three years.
  • Loyalty programs: a 5% retention improvement lifting profit 25 to 95%. (Bain, 2025)
  • AI phone reception: $3,000–$18,000 in recovered monthly revenue per location.

Payback Timelines by Segment

Payback windows run 3 to 6 months for POS and digital ordering, and 6 to 12 months for labor scheduling platforms, since scheduling ROI compounds through avoided overtime and turnover cost rather than an immediate transaction gain. A 2025 National Restaurant Association survey found that 76% of operators consider technology a measurable competitive edge. (NRA, 2025)

The Margin Math: Why Every Percentage Point Matters

At 3 to 5% margins, a 2 percentage point food cost reduction changes the outcome of a full year. For a five-unit operator running $1M in annual revenue per location, a 2% food cost reduction recovers $100,000 across the group, well above what most inventory platforms cost annually.

Risks and Implementation Challenges Operators Don’t Talk About

Integration Failure – When Systems Don’t Talk to Each Other

The most common hidden cost of new restaurant management software is a system that does not connect cleanly to what is already running. A platform that fails to integrate with existing POS or accounting software creates data silos, operational disruption, and unplanned custom development spend.

Data Quality Dependency

AI-powered forecasting and inventory tools only produce useful output when the data feeding them is accurate. Operators migrating from manual processes carry real exposure here, since messy historical data produces wrong predictions before anyone notices.

Staff Resistance and Change Management

Technology that staff refuse to use, or were never properly trained on, returns zero value regardless of cost. Skipping structured training and change management is one of the most predictable ways an implementation fails.

Cybersecurity Exposure

Every additional connected system, from payment processing to loyalty databases to supplier integrations, adds another point of vulnerability. Vendors should be evaluated directly on security certifications, specifically PCI DSS and SOC 2, not on sales assurances.

Over-Automation Risk

In full-service segments, particularly, removing too much human interaction erodes the guest experience that drives repeat visits and loyalty.

Vendor Selection Checklist for Food Service Technology

Before You Shortlist – Internal Readiness Questions

  • What is the current tech stack, and where are the integration dependencies?
  • Is there a dedicated implementation owner internally?
  • What payback timeline is acceptable?
  • Is the goal a single-point solution or a unified platform?

Vendor Evaluation Criteria

CriteriaWhat to Verify
Integration capabilityNative connectors to your existing POS/ERP 
Pricing transparency All-in TCO, not just the SaaS fee 
Security compliance PCI DSS, SOC 2 certification 
Scalability Multi-location support, API flexibility 
Implementation support Onboarding, training, go-live SLA 
Reference customers Same segment, similar scale 
Support model 24/7 vs. business hours, matters on a Friday night 

Red Flags to Watch For

Vague pricing, no reference customers in your segment, thin integration documentation, and contracts with no clearly defined data ownership terms are all reasons to keep looking.

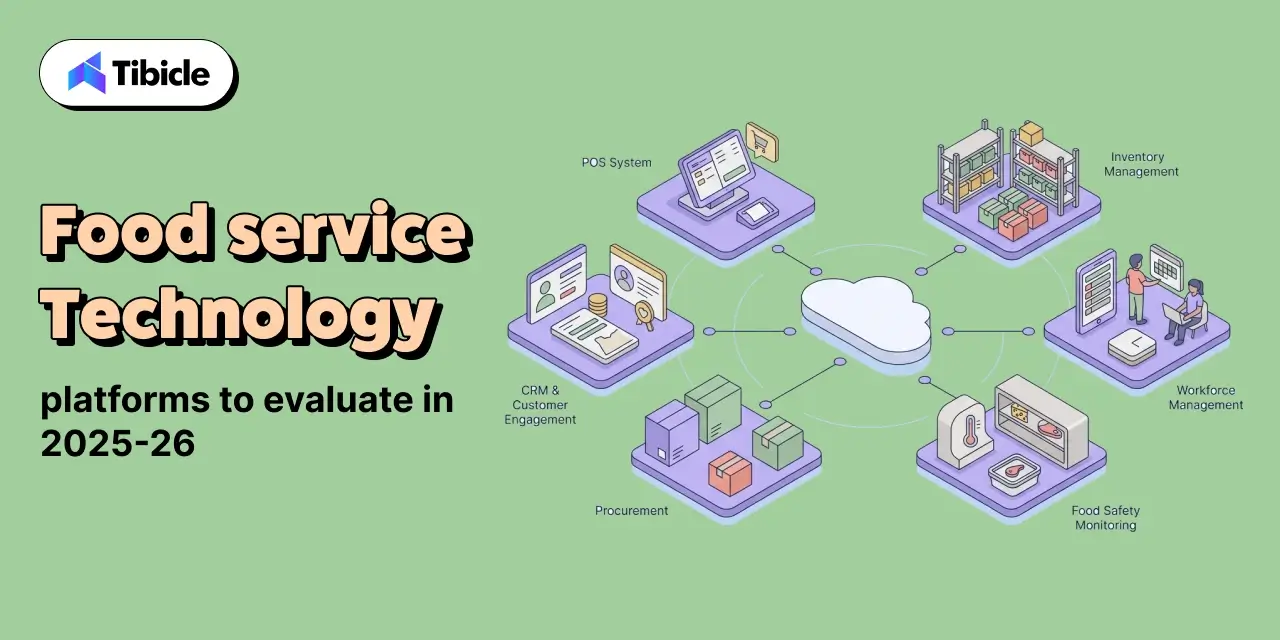
Top Food Service Technology Platforms to Evaluate in 2025–26

restaurant business models

This is a neutral, informational list, not ranked and not endorsed. These platforms are frequently evaluated by operators at different scale points. Match them against the checklist above rather than brand recognition alone.

  • Toast – Full-stack restaurant management: POS, payroll, and marketing.
  • Square for Restaurants – Strong free tier, suited to early-stage and single-location operators.
  • Lightspeed Restaurant – Enterprise-grade, multi-location inventory and reporting.
  • Oracle Food and Beverage – Large chain and hospitality-grade infrastructure.
  • 7shifts – Labor scheduling and workforce management specialist.
  • Supy – Inventory and procurement for F&B, strong AI-driven ordering.
  • Smart Food Safe – Food safety, compliance, and HACCP automation.

No ranking is implied. Best fit depends on operator type, scale, and existing stack.

Why Tibicle LLP Is a Considered Choice for Food Service Technology Implementation

Tibicle  works with food and hospitality operators at the intersection of software development, integration architecture, and custom food tech builds. Where off-the-shelf platforms hit a ceiling, in custom ordering flows, proprietary loyalty engines, POS integrations with legacy infrastructure, or multi-channel delivery orchestration, Tibicle’s development team builds to spec instead of forcing a workaround.

The difference is not price. It is the ability to close the gap between what a SaaS vendor ships out of the box and what a scaling operator actually needs to run in production, day to day.

Evaluating a custom food tech build or integration project? Talk to Tibicle’s team.

Conclusion

Thin margins, labor cost pressure, and food waste are not abstract industry complaints. They are measurable line items that food service technology is proven to move. The operators pulling ahead in 2025 to 2026 are not running the most technology; they are running the stack matched correctly to their scale, deployed with real training discipline, and measured against actual operational benchmarks rather than vendor promises.

Ready to build or optimize your food service technology stack? Tibicle’s team helps operators at every scale, from integration audits to full custom builds. Schedule a consultation.

FAQs

What is food service technology and what does it include?
Food service technology covers all hardware, software, and AI systems used to manage restaurant operations, from POS and inventory to scheduling, safety compliance, and customer loyalty platforms.

How much does food service technology cost for a mid-size restaurant group?
Costs vary by category and scale. Mid-market inventory platforms run $169–$429/month per location, POS solutions run $189–$399/month. Enterprise plans are custom, and total cost of ownership including hardware and integrations typically runs 3 to 5 times the base SaaS fee.

What ROI can operators realistically expect from restaurant operations technology?
ROI timelines range from 3 to 12 months depending on category. Inventory software delivers 150%+ ROI in year one for many operators, AI forecasting reduces inventory errors 20 to 50%, and scheduling automation can save $15,000–$40,000 in management costs over three years.

What are the biggest risks when implementing food service technology?
Integration failure with existing systems, poor data quality undermining AI tools, staff resistance without structured training, cybersecurity exposure from connected systems, and over-automation that degrades guest experience in full-service segments.

How do I choose the right food service technology solutions for my operation?
Start with a tech stack audit and map integration dependencies before shortlisting vendors. Evaluate on total cost of ownership, integration capability, security certifications, scalability, and reference customers in your specific segment, not brand recognition alone.

Is custom food service technology development better than off-the-shelf platforms?
Off-the-shelf platforms suit most operators at standard scale. Custom development becomes justified when ordering flows, loyalty architecture, or multi-system integrations exceed what SaaS vendors support natively, particularly for chains with proprietary processes or complex supplier ecosystems.

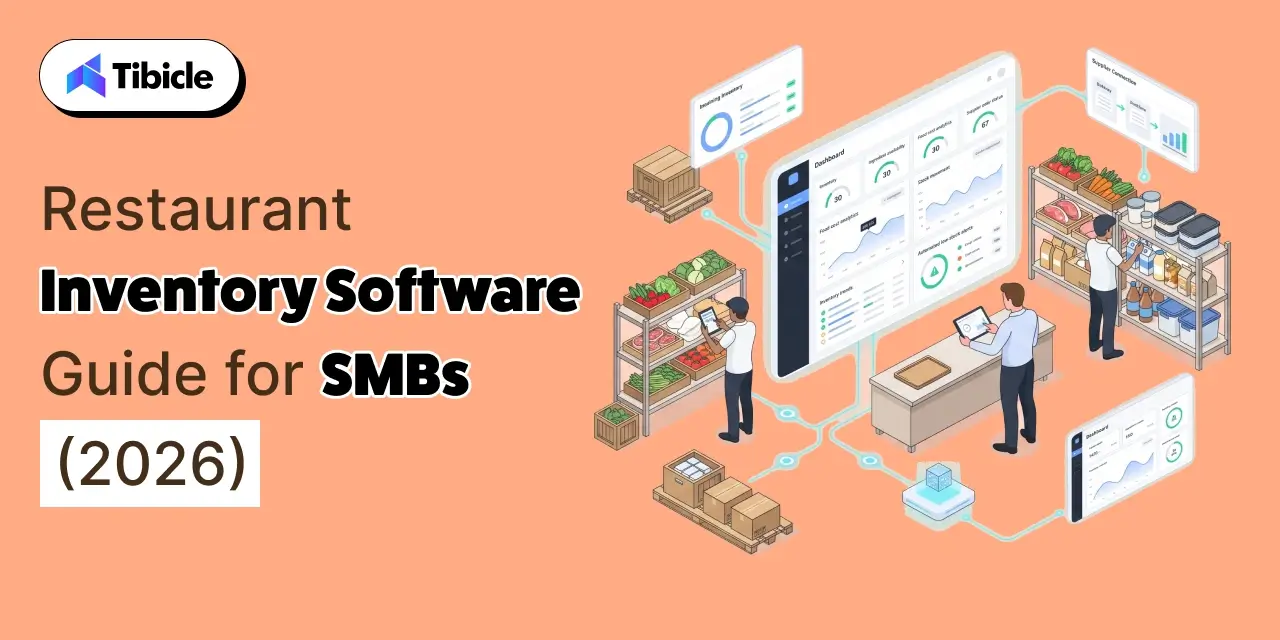
Restaurant Inventory Software Guide for SMBs (2026)

What This Guide Covers

Who this is for: SMB restaurant owners, multi-unit operators, and finance-conscious GMs running food cost 3–5 points above target on spreadsheets or manual counts, who are evaluating whether a dedicated restaurant inventory software can close the gap between theoretical and actual food cost.

Search intent: Evaluation and decision — the reader isn’t asking what restaurant inventory software is. They’re deciding which pricing tier fits their operational scale, whether the ROI justifies the switch from spreadsheets, and which platform matches their POS and location count.

What you will walk away with: A breakdown of four core capabilities (real-time depletion, recipe costing, automated reordering, shrinkage detection) with the business outcome each one drives, a three-tier pricing comparison across six platforms with hidden first-year costs, ROI benchmarks tied to real food-spend numbers, a 12-point vendor selection checklist, and a clear framework for when off-the-shelf software fits versus when a custom build makes more sense.

restaurant inventory software

Introduction

Most restaurants running food costs 3–5 points above target are not dealing with a kitchen problem. They are dealing with a tracking problem. Thirty to forty percent food waste, end-of-week surprise variances, and shrinkage that never shows up with a name attached, these are the outputs of broken inventory processes, not broken recipes. Restaurant inventory software is not a technology upgrade. It is a financial control layer that replaces the guesswork currently sitting between your food spend and your margin.

This guide is a decision-making resource for SMB restaurant owners, multi-unit operators, and finance-conscious GMs, not a software list.

Here is what the data, the platforms, and the real operators actually show.

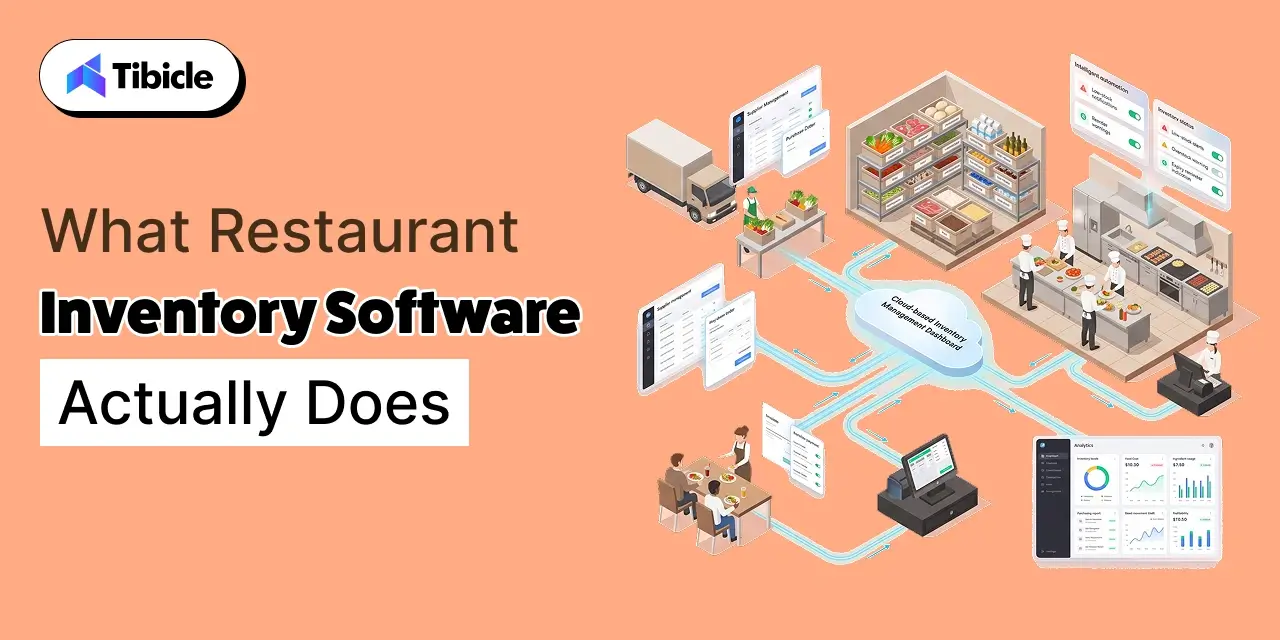
What Restaurant Inventory Software Actually Does

restaurant inventory software

Beyond Counting Stock

The four core functions that define this category: real-time stock tracking, recipe costing, automated reorder triggers, and POS integration. Each one addresses a specific failure mode in manual inventory management, and none of them are replicable in a spreadsheet at any meaningful operational speed.

Real-time tracking knows what is in the walk-in based on what has been sold and received, not based on when someone last counted. Recipe costing connects ingredient costs to menu items so margin is calculated at the dish level, not estimated at the month-end. Automated reorder triggers prevent the stock-out that happens when a manager forgets to place a Tuesday order. POS integration makes all of the above continuous rather than periodic.

What spreadsheets cannot catch: the slow variance that accumulates between counts. A spreadsheet shows you what you had and what you have. It cannot tell you what happened in between.

Why Manual Inventory Fails SMBs at Scale

Seventy-five percent of restaurants struggle to maintain profitability due to poor food cost management. The mechanism is not dramatic, it is incremental. Shrinkage control failures, human counting error, and food cost variance accumulate week over week, invisible until the P&L shows a margin that does not match the menu pricing. By then, the loss is already three weeks old.

Software functions as a financial control layer: it closes the gap between theoretical food cost and actual food cost by making variance visible in real time rather than in retrospect.

Core Capabilities That Drive Business Outcomes

Real-Time Stock Depletion via POS Integration

A perpetual inventory system auto-decrements ingredient counts with every POS sale. A burger sells, the bun, the patty, the portion of sauce all decrement simultaneously. No manual count required between transactions. The operational outcome is the elimination of end-of-week surprise variances: if the system shows 12 pounds of salmon on hand and the walk-in has 8, that 4-pound gap is a variance report, not a mystery discovered during prep.

This is the core distinction between inventory software and inventory counting. One tracks what you have. The other tracks what you should have and flags the difference.

Recipe Costing and Menu Profitability

Recipe costing maps ingredient costs to every menu item at the portion level. When a supplier raises the price of chicken thighs, every dish that uses chicken thighs updates its theoretical cost automatically. Menu engineering becomes a data exercise rather than an intuition exercise: which dishes carry the margin, which ones bleed it, and which ones sell well but contribute minimally to profit.

Food costs typically run 30–35% of revenue. The gap between theoretical food cost, what the recipe math says it should cost, and actual food cost is where margin recovery lives. Recipe costing closes that gap by making it visible at the item level, not just at the category level.

Automated Reordering and Par Level Management

Par level management sets the minimum stock threshold for each ingredient and triggers a purchase order automatically when that threshold is crossed. The distinction between platforms at this level: rule-based reordering fires when stock hits a set number. AI-driven demand forecasting in higher-tier tools adjusts par levels based on upcoming covers, seasonal patterns, and historical velocity, so the order placed on Monday reflects what Thursday actually needs, not what last Thursday used.

For SMBs with lean back-office teams, the operational value is not just automation. It is the elimination of the stock-out and over-order cycle that inflates both food cost and waste simultaneously.

Vendor Management and Invoice Processing

Platforms like MarketMan and BlueCart handle supplier catalogs, price comparison across vendors, and invoice processing in the same system that manages stock levels. The xtraCHEF model uses OCR-based invoice scanning, a photo of the invoice creates a digitized record that flows into food cost calculations without manual data entry.

For SMBs with one or two managers handling purchasing, accounts payable, and operations simultaneously, the time value of automated invoice processing is measurable in hours per week that currently go into data entry that produces no operational insight.

Shrinkage Detection and Theft Prevention

Shrinkage control is a financial function before it is a kitchen hygiene function. Seventy-five percent of restaurant inventory shrinkage in the US is attributed to employee theft, costing an estimated $20 billion annually. Variance reports the gap between what the perpetual system expects and what the physical count finds. This surfaces the problem at the location level and the item level without requiring surveillance.

A variance report that shows consistent shrinkage on high-value proteins at one location, on one shift, is actionable. A general sense that food cost is running high is not.

Where SMBs Use Restaurant Inventory Software: Real Operational Scenarios

Single-Location Independents

Owner-operated restaurant, one to two managers, no dedicated back-office. The primary need is food cost management software that takes under 30 minutes weekly to run and does not require a finance background to interpret. At this scale, recipe costing and weekly variance reporting are the features that move the margin. Supplier catalog management and multi-location reporting do not add complexity without adding return at one location.

The right tool for this profile keeps the weekly process simple: count, compare to system, review variance, adjust ordering. Anything that requires daily touchpoints or dedicated setup time will be abandoned within 60 days.

Multi-Location Groups (2–5 Sites)

Centralized purchasing, location-level variance reporting, and consolidated restaurant inventory tracking across two to five sites. This is where the cost of not having unified software becomes quantifiable: an average 8% food cost variance across 12 locations equals approximately $187,000 in annual loss. The same variance at three locations is still a five-figure problem that a centralized dashboard surfaces and a location manager reviewing a spreadsheet does not.

The operational shift at this scale is from tracking to comparison: which location is running variance, on which items, in which time window. That question requires multi-location consolidation that spreadsheets cannot provide without significant manual assembly.

High-Volume Fast Casual

Ingredient-level depletion speed, batch recipe costing, and labor-efficient counting are the defining requirements. An automated inventory system that reduces weekly count time by 50% or more frees the kitchen manager to run production rather than count it. At high volume, the depletion rate on key ingredients, proteins, dairy, and produce, moves fast enough that daily variance visibility is operationally useful, not just analytically interesting.

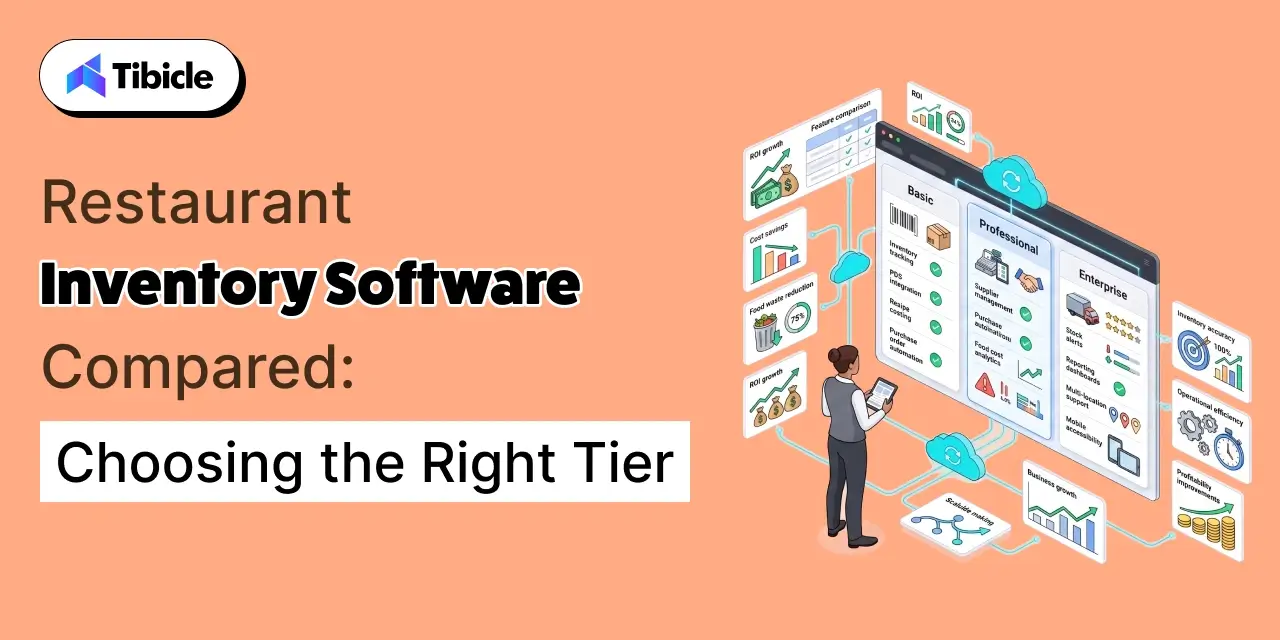
Restaurant Inventory Software Compared: Choosing the Right Tier

restaurant inventory software

The three pricing tiers in this category reflect different operational realities. Matching the tier to actual complexity matters more than chasing the most features, an over-specified platform creates setup overhead that prevents the ROI it was purchased to deliver.

PlatformBest ForKey StrengthPOS IntegrationStarting Price / MonthOnboarding Fee
MarketManMulti-unit SMBsFull inventory management + vendor catalogToast, Square, Lightspeed, Clover$239~$500
MarginEdgeFood cost visibilityFinancial reporting + invoice synchronizationToast, Aloha, Brink$330Included
Restaurant365Restaurant groups with accounting needsAll-in-one inventory, payroll, and accountingMost major POS systems$469Separate (typically high)
xtraCHEF (Toast)Toast-only operatorsAI-powered invoice scanningToast native onlyIncluded in some Toast plansMinimal
BlueCartBudget-conscious operatorsSupplier ordering and procurementSquare (limited integrations)$10 (Basic)None

Per-location fees apply on most platforms above $200/month. Always request the total first-year cost, not the monthly subscription alone.

What the Price Tiers Actually Tell You

Low tier ($10–$50/month): ordering workflow only, no recipe costing or variance reporting. Mid tier ($200–$400/month): full restaurant stock control for most independent and small-group operators. This is where the ROI case is clearest. Full systems ($400–$600+/month): justified when accounting consolidation and multi-unit financial reporting are active operational needs, not aspirational ones.

What Restaurant Inventory Software Actually Costs and What Gets Hidden

The Visible Cost vs. The Total First-Year Cost

The monthly subscription is the visible number. The total first-year cost includes per-location fees that compound at scale, onboarding (MarketMan runs approximately $500; Restaurant365 significantly higher), and internal setup time for recipe libraries and ingredient mapping. A platform with a $300/month headline can cost $6,000–$8,000 in year one when all components are included.

Frame this as a total cost of ownership question before the contract conversation, not after.

When the Cost Is Justified: A Simple ROI Benchmark

A restaurant doing $80,000 per month in food purchases, running food cost at 32% against a 29% target, loses $2,400 per month every month. A $300/month platform pays back in under two weeks of food cost improvement at that gap. Modern inventory tools improve margins by 2–10%, with up to 15% reduction in shrinkage. The ROI case does not require optimistic assumptions. It requires a baseline food cost number and a target.

When It Is Not Worth It Yet

If food purchases are under $40,000 per month and weekly count discipline has not been established, a $300/month platform will not fix the process problem. Start with BlueCart or a structured spreadsheet. Software accelerates good process. It does not create it. Operators who deploy inventory software before establishing count consistency get accurate reports on an inconsistent operation and conclude the software does not work.

ROI and Business Impact: What Changes After Implementation

Food Cost Reduction: The Primary Return

Operators who implement inventory software properly, completing recipe builds, running weekly counts, and reviewing variance against theoretical, typically see food cost drop 1–3 percentage points within the first few months. On a $1M annual food spend, a 2-point improvement equals $20,000 recovered. That number does not require a perfect implementation. It requires a consistent one.

Labor Efficiency on Inventory Tasks

Weekly inventory counts drop by 50–75% in time cost with a perpetual system active. For multi-location groups, this translates to 10–15 manager hours per week redirected to operations rather than counting. At a $25/hour manager labor rate, 12 hours per week is $15,600 annually in recovered management capacity before any food cost improvement is included in the return calculation.

Waste and Shrinkage Recovery

Every $1 in saved food creates additional revenue when the relationship between food cost and revenue is applied at the margin level. Shrinkage control through variance reporting reduces theft exposure and spoilage without surveillance through data accountability. A variance that must be explained is a variance that is less likely to recur.

Decision Speed for Ownership and Finance Teams

Real-time food cost data versus weekly spreadsheet reconciliation changes the timing of three decisions that compound in value: menu pricing adjustments, supplier negotiation timing, and promotional planning. An owner who knows food cost is running 2 points high in week two can act in week two, not in week six when the monthly report confirms it.

Risks and Challenges SMBs Face When Implementing Inventory Software

Recipe Library Setup: The Hidden Time Cost

Most platforms require 20–80 hours of setup to build ingredient libraries and map recipes before meaningful data flows. This is the most consistently underestimated implementation cost. Operators who skip or rush this step see no ROI, not because the platform does not work, but because the data it reports against is incomplete. Budget the setup time as part of the investment, not as a problem to solve after go-live.

POS Integration Depth Varies: Do Not Assume Compatibility

“Integrates with Toast” can mean full real-time depletion sync or a daily sales file import with a 24-hour data lag. The operational difference is significant: one enables real-time variance tracking, the other enables better-than-spreadsheet weekly reporting. Confirm native integration with your specific POS version before signing, not just the brand name. BlueCart has no POS integration at all.

Staff Adoption and Count Discipline

Inventory software fails when counts are not done consistently. The platform does not enforce the process, management does. Weekly count accountability requires a defined owner, a defined time window, and a defined review process for variance reports. None of that is built into the software. Build it into the operating cadence before go-live, not after the first month of missing data.

Switching Costs and Data Lock-In

Recipe libraries, historical variance data, and supplier catalogs built inside one platform do not export cleanly to another. This is a long-term vendor decision, not a monthly subscription. Evaluate data portability terms before signing, specifically: what exports are available, in what format, and what happens to historical data on account cancellation.

Vendor Selection Checklist for Restaurant Inventory Software: What to Ask Before Signing

Operational Fit

  • Does it integrate natively with your exact POS version, not just the brand?
  • Does it support multi-location reporting if expansion is planned within 18 months?
  • Can it handle your ingredient count and recipe volume without tiered pricing increases?

Pricing Transparency

  • What is the total first-year cost, including onboarding fees and per-location charges?
  • Are per-location fees added on top of the base subscription at your current and projected location count?
  • What happens to your data, recipe library, variance history, and supplier catalog, if you cancel?

Implementation Reality

  • How long does recipe library setup take, and who is responsible for completing it?
  • Is onboarding included in the subscription or charged separately?
  • What does the support model look like after the initial onboarding window closes?

Growth Alignment

  • Does the platform scale to accounting and payroll consolidation if the operation grows?
  • Is AI-driven demand forecasting available now or on the product roadmap with a confirmed timeline?
  • Are there commission fees on orders placed through the platform’s supplier network?

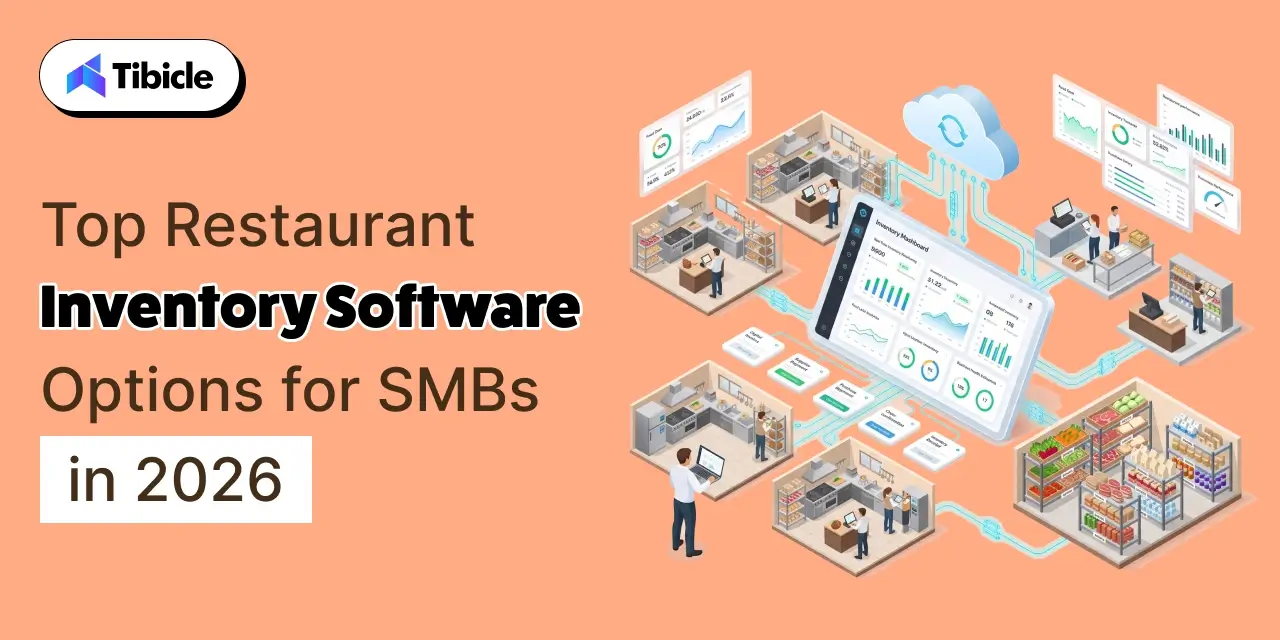
Top Restaurant Inventory Software Options for SMBs in 2026

options for SMBs

MarketMan is the strongest fit for multi-unit SMBs that need full inventory management combined with vendor catalog control. Native integration with Toast, Square, Lightspeed, and Clover covers most POS environments. Best for operators who need recipe costing and vendor management in the same system.

MarginEdge fits operators where food cost visibility and financial reporting are the primary gaps. Invoice sync and daily P&L output make it the strongest choice for independents where the back-office is one person doing three jobs. Integration with Toast, Aloha, and Brink covers the major full-service POS environments.

Restaurant365 is the right evaluation for groups that need inventory, payroll, and accounting consolidated. The implementation investment is significant, onboarding fees are charged separately and setup timelines run long. Justified at five or more locations where the cost of fragmented systems exceeds the platform cost.

xtraCHEF by Toast is purpose-built for operators already in the Toast ecosystem. AI-powered invoice scanning eliminates manual AP entry. No independent utility outside Toast, if a POS change is possible within 24 months, this creates lock-in risk worth evaluating in advance.

BlueCart is the right starting point for budget-first operators under $40,000 per month in food spend who need supplier ordering structure before they need recipe costing. No POS integration and no variance reporting, position this as a process-building tool, not an inventory analytics platform.

Lightspeed Restaurant includes inventory management within its POS suite, making it a reasonable consideration for operators evaluating POS and inventory simultaneously who are not yet ready for a dedicated inventory platform.

Why Tibicle LLP Is Worth Considering for Custom Restaurant Inventory Software

Wht Tibicle LLP is Worth Considering

When Off-the-Shelf Does Not Fit

Non-standard POS environments, proprietary supplier systems, franchise-level reporting requirements, or the need to consolidate inventory with kitchen display, HR, and accounting in one codebase, these are the scenarios where off-the-shelf platforms reach their limit. Per-location and per-module fees that compound at five or more sites change the total cost of ownership math significantly. At that point, the recurring subscription cost versus a one-time build cost becomes a legitimate financial comparison, not an edge case.

What a Custom Build Gets You

Full data ownership with no per-location fees, purpose-built workflows that match actual operational process rather than a platform’s default configuration, and integrations with any supplier or POS API, not just the ones the platform has prioritized. Tibicle’s development work in this space starts from the existing stack and builds toward the data layer the operation actually needs, without vendor lock-in on either the inventory logic or the reporting layer.

Exploring a custom-built inventory system? Tibicle’s team can scope the build against your current stack, no vendor lock-in required.

Conclusion

Food cost is the most controllable cost line in a restaurant’s P&L. The right restaurant inventory software matched to operational scale and actual POS environment is not a technology expense. It is a margin recovery tool with a calculable payback period.

The ROI benchmark is straightforward: a 2-point food cost improvement at $80,000 per month in food spend covers a $300/month platform in under two weeks. The checklist above surfaces the integration, pricing, and implementation variables that determine whether that return materializes in 60 days or gets delayed by a setup problem nobody planned for.

Match the platform to the operation. Build the process before deploying the software. Review variance weekly. The rest follows.

Ready to tighten your inventory control? Whether you are evaluating a platform or building a custom system, Tibicle’s team works with SMB restaurant operations to get the fit right. Talk to us →

FAQs

What is the difference between perpetual and periodic restaurant inventory management?
A perpetual inventory system updates automatically with every POS sale, and stock levels reflect real-time depletion without manual counting between transactions. Periodic inventory requires manual counts at set intervals, leaving variance invisible in between. Most SMBs moving off spreadsheets should target perpetual tracking as the baseline, since it is the mechanism that makes real-time food cost visibility possible.

How much does restaurant inventory software cost for a small restaurant?
Mid-tier dedicated platforms like MarketMan and MarginEdge run $200–$400 per month, plus onboarding fees that can reach $500 or more. Budget-first operators can start with BlueCart at $10 per month for basic purchasing and restaurant stock control. Always calculate the total first-year cost, including setup, onboarding, and per-location fees, the monthly rate alone understates the real investment by 30–50% in year one.

Does restaurant inventory software integrate with my POS system?
Most major platforms, MarketMan, MarginEdge, Restaurant365, integrate with Toast, Square, Clover, Lightspeed, and Aloha. Integration depth varies significantly: confirm whether your specific POS version supports real-time depletion sync or a daily sales file import. The operational difference between those two integration types determines whether the platform enables real-time variance tracking or better-than-spreadsheet weekly reporting.

How long does it take to see ROI from inventory management software?
Operators who complete recipe setup, run weekly counts, and review variance reports consistently typically see food cost variance improvement within 60–90 days. At $80,000 per month in food spend, a 2-point food cost improvement covers a $300/month platform in under two weeks of savings. The implementation variable that determines this timeline is recipe library completeness, not the platform itself.

Can restaurant inventory software reduce food waste?
Yes. An automated inventory system aligned to demand forecasting and par level management cuts over-ordering by matching purchase volume to actual demand rather than habit. Industry data shows restaurants using food cost management software report up to 15–25% reduction in food waste and a 2–10% improvement in gross margins within the first year of consistent use. When per-location fees across five or more sites make a purpose-built system financially competitive, when major platforms do not support your POS, or when you need deep integration across inventory, kitchen display, HR, and accounting in one system, a custom build eliminates ongoing subscription costs and frees your business from another company’s product roadmap.

When should an SMB consider a custom-built inventory system instead of off-the-shelf software?
A custom build becomes the better choice when per-location fees across five or more sites make it financially competitive, if major platforms do not support your POS, or when you need deep integration across inventory, kitchen display, HR, and accounting in one system. It eliminates ongoing subscription costs and frees your business from another company’s product roadmap.

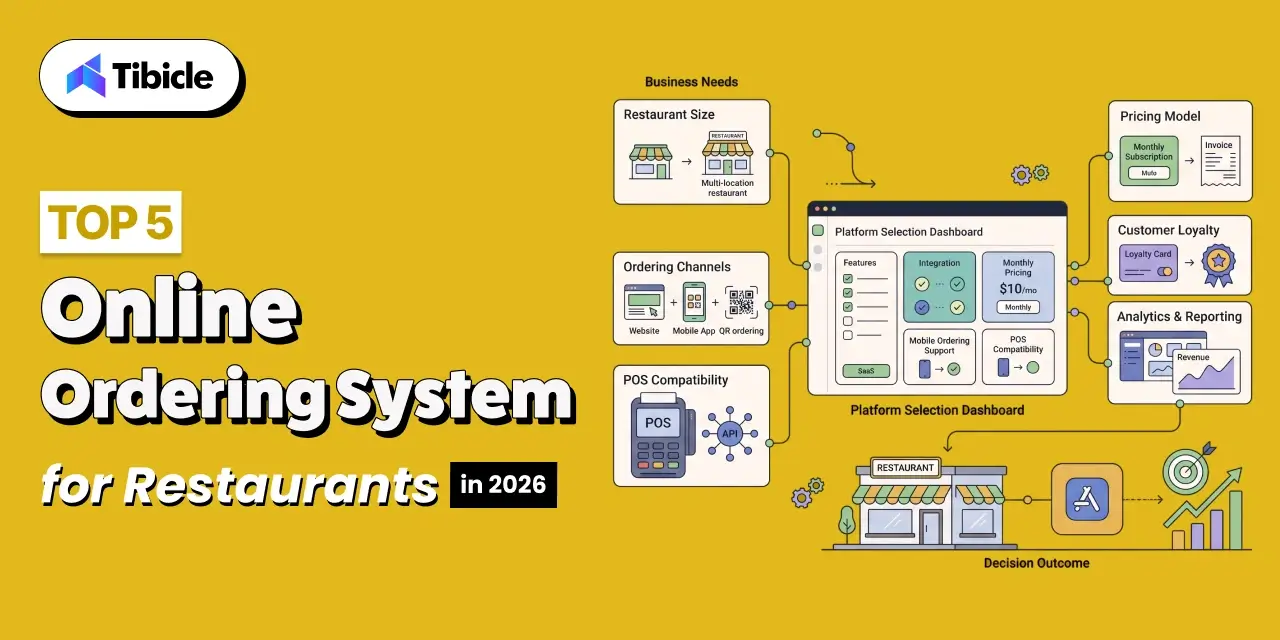
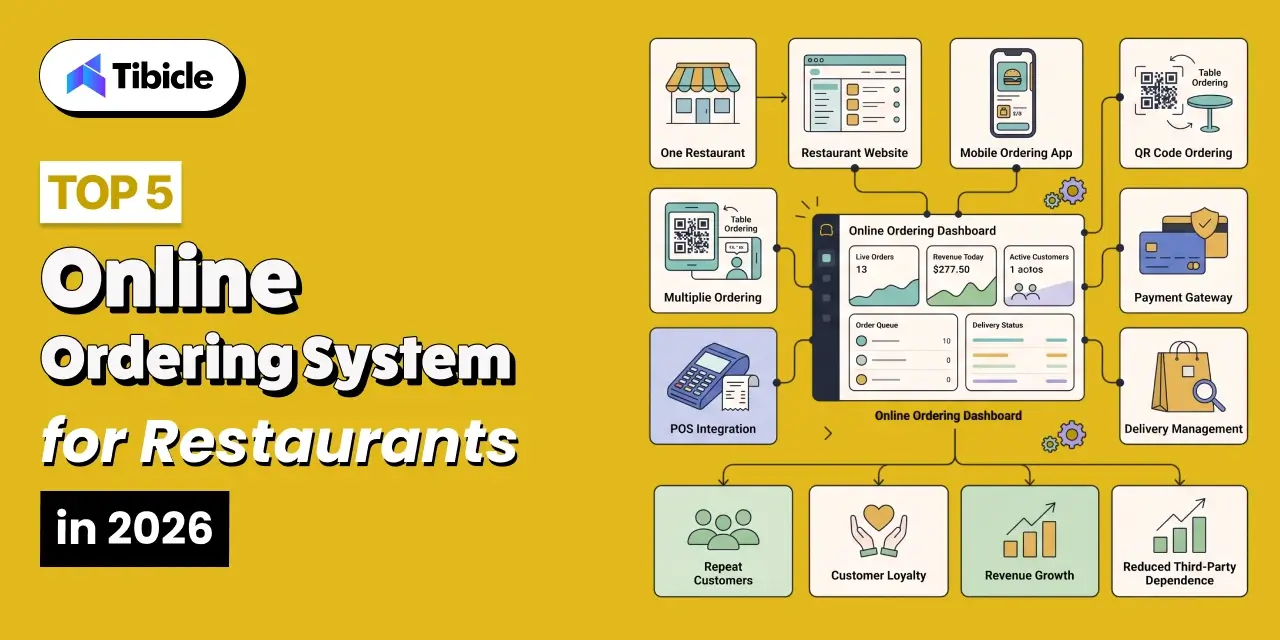
Online Ordering Systems for Restaurants: Top 5 in 2026

What This Guide Covers

Who this is for: Independent restaurant owners, multi-location restaurant operators, cloud kitchen businesses, and F&B decision-makers who are evaluating online ordering systems to reduce third-party delivery commissions, improve profit margins, and choose the right platform for direct customer ordering in 2026.

Search intent: Commercial investigation and platform comparison. The reader already understands online ordering and is actively comparing vendors based on pricing, POS compatibility, commission structure, customer ownership, implementation costs, scalability, and expected ROI before selecting a platform.

What you will walk away with: A detailed comparison of the top 5 online ordering systems for restaurants in 2026, including pricing, commission models, POS integrations, hidden Year-1 costs, ROI calculations, break-even analysis, platform limitations, vendor evaluation checklist, and guidance on selecting the right solution based on restaurant size, order volume, and operational requirements.

Introduction

online ordering systems

The best online ordering systems for restaurants aren’t the ones with the longest feature list. They’re the ones that stop the margin bleed. A restaurant running 200 weekly orders at a $35 average ticket through a 25% commission platform loses more than $90,000 a year to that platform alone, before food cost, labor, or occupancy take their share.

This guide is for operators past the awareness stage. You know what direct ordering means. What you need is a clear decision on which platform fits your order volume, your POS stack, and your growth plan for the next 12 months. That’s what this comparison delivers.

The right online ordering system isn’t the cheapest option or the most recognized brand. It’s the one that aligns with how your restaurant grows.

Why 2026 Is a Turning Point for Restaurant Direct Online Ordering Systems

Third-party delivery apps built the discovery infrastructure for restaurant ordering over the last decade. What’s changed is the cost of using that infrastructure for customers who already know and order from you, and the quality of the direct alternatives now available.

The Commission Model Is Structurally Broken for Repeat Business

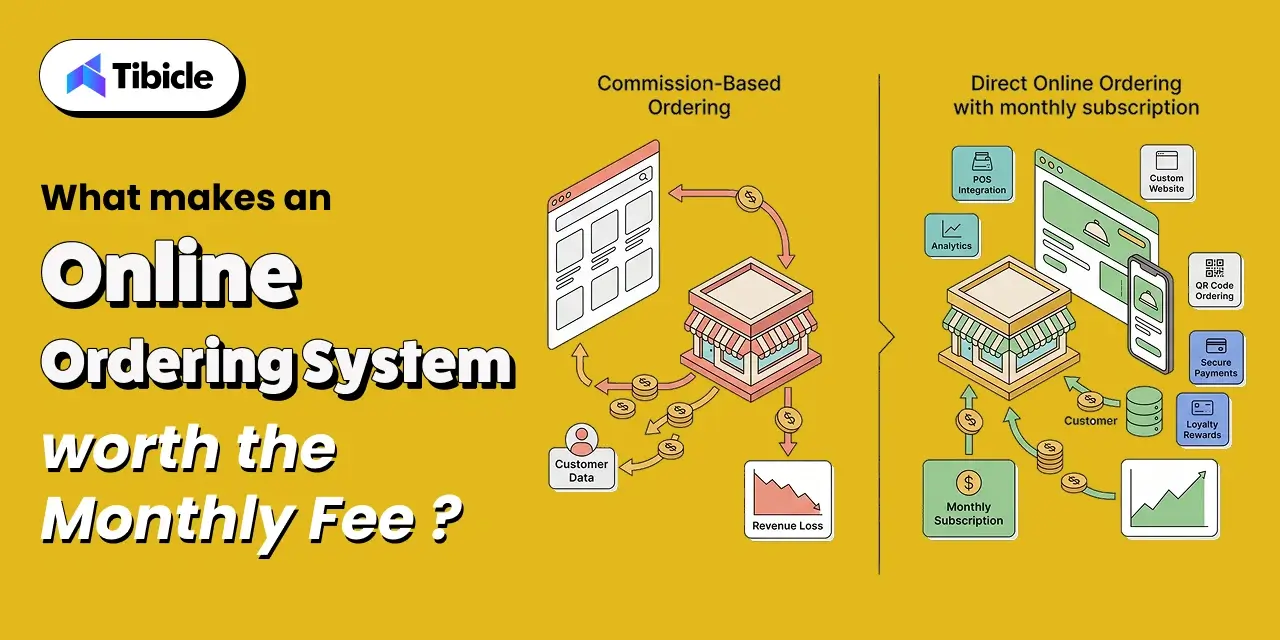
Third-party platforms publish 15 to 30% commission rates. The real effective cost hits 30 to 40% once mandatory promotions and processing fees are stacked in. On $10,000 a month in online orders, a 30% commission structure costs $3,000 every month, $36,000 a year through a single channel. The less-visible cost is structural: third-party platforms retain the customer relationship. The email address, purchase history, and remarketing access belong to DoorDash, not to the restaurant. The operator cooked the food and handed it to the customer.

What Restaurants Are Doing Differently in 2026

The operators gaining ground aren’t cutting third-party apps out entirely. They’re using marketplace platforms for first-time customer discovery, then pulling repeat customers into direct channels where the economics are entirely different. Restaurants that have completed this shift report 35% savings per order compared to commission-based platforms. The channel is also increasingly mobile: 72% of online food orders are placed on a phone, which makes POS-connected, mobile-first ordering a baseline requirement, not a differentiating feature, for any platform considered in 2026.

What Makes an Online Ordering Systems Worth the Monthly Fee

online ordering systems

The monthly fee question is only answerable in the context of what it replaces. Operators who frame platform cost as a software expense rather than a margin-recovery decision consistently choose the wrong tool for their order volume.

Commission Structure vs. Monthly Fee: What the Math Actually Says

Flat-fee platforms and commission-based models cross at different monthly order volumes, and the crossover is closer than most operators realize. At $8,000 a month in online orders, a $499 flat-fee platform already outperforms a 10% commission model by over $300 a month. At $15,000 a month, the monthly gap widens past $1,000. Run that break-even calculation against your actual order volume before comparing feature sets or sitting through demos. Commission-free platforms can still apply processing fees, so model those against your average ticket before assuming the headline rate is the real rate.

Five Criteria That Separate Good Systems from Expensive Mistakes

These five factors determine whether a platform reduces the cost structure or adds a new line item to it:

  • Commission structure: zero percent flat fee versus a percentage deducted from every transaction
  • Customer data ownership: unrestricted export of emails, order history, and behavioral data versus platform-controlled access
  • POS integration depth: native connection versus middleware that breaks during software version updates
  • Mobile ordering experience: one-tap checkout with Apple Pay and Google Pay built in, not bolted on
  • Loyalty and direct marketing: SMS, push notifications, and automated offer tools included in the base plan versus sold as add-ons

Top 5 Online Ordering Systems for Restaurants in 2026

Each platform below is assessed on what it does, who it’s built for, its standout capability, its real pricing signal, and the one limitation that matters most before committing to a contract.

online ordering systems

1. Toast: Best for Full-Service Restaurants Wanting an Integrated Ecosystem

What it is: Toast is built exclusively for restaurants, combining POS, online ordering, kitchen display systems, and labor management in a single platform. For operators who want consolidated vendor relationships rather than disconnected tools, that integration argument is the core value proposition.

Standout capability: Tableside ordering via Toast Go 2 handhelds, paired with AI-driven sales forecasting and fraud detection. These capabilities are relevant specifically to full-service dining, where tableside interaction defines the guest experience; they don’t exist in comparable form in standalone food delivery software.

Pricing signal: $69 a month base plus add-ons, hardware purchased upfront, and a $0.99 per-order transaction fee at higher volume tiers. The advertised starting price understates the real cost once terminals and feature tiers are added.

Limitation: Pricing goes quote-based as complexity increases, making total year-one cost difficult to model without getting into a sales process. Hardware lock-in is a real constraint, switching platforms later means replacing terminals, not just canceling a subscription.

2. Owner: Best for Established Restaurants Scaling Direct Orders

What it is: Owner charges a flat $499 a month with all features included. Commission-free direct ordering pairs with an AI-powered website builder optimized for local search and an automated marketing suite that runs without manual management.

Standout capability: Native POS integration with both Square and Toast removes the middleware dependency that breaks many competing platforms during updates. For restaurants with consistent online order volume, the commission-free model compounds in value as monthly orders grow.

Pricing signal: $499 a month flat, no processing fees passed to the restaurant, no add-on tiers required. All features are in the base price.

Limitation: The flat fee is a poor fit for restaurants in the early digital transition with low online order volume. The savings model activates at volume; operators who haven’t yet built a digital ordering habit among their customers will pay $499 a month for a platform whose economics don’t work at low order counts.

3. ChowNow: Best for Restaurants Prioritizing POS Flexibility

What it is: ChowNow offers three pricing tiers, Hub at $119 a month, Pro at $229 a month, and Premier at $328 a month, and connects with more than 30 POS systems. That’s the widest POS compatibility range in this comparison, making it the practical answer for operators locked into a specific POS they’re not replacing anytime soon.

Standout capability: Commission-free on direct orders, with Flex Delivery adding last-mile logistics through flat-fee pricing and smart driver dispatching. This gives operators a branded delivery channel without a marketplace intermediary taking a cut of every order.

Pricing signal: Commission-free on direct orders with a 2.95% plus $0.29 per transaction processing fee applied. The processing fee doesn’t disappear from the cost equation; at lower average ticket sizes or high order volumes, it can erode a significant portion of the commission savings.

Limitation: Lower tiers hit a feature ceiling quickly, and the processing fee creates a hidden cost that the headline pricing doesn’t surface. Operators need to model the fee against their actual average ticket before assuming ChowNow is cheaper than alternatives at scale.

4. Square Online: Best for Small Restaurants and Food Trucks Getting Started

What it is: Square Online offers a free entry plan where the only cost is a 2.9% plus $0.30 processing fee per transaction, with paid tiers starting around $60 a month. No long-term contracts, no setup complexity, fully transparent pricing from day one.

Standout capability: Native integration with Square POS and a solid mobile ordering experience make this the lowest-friction starting point for operators building an online ordering presence from zero. There’s no procurement process and no implementation timeline; it’s live within hours.

Pricing signal: Free plan available with processing fees only. Paid tiers start at approximately $60 a month with additional features at higher levels.

Limitation: Square Online is a multi-industry platform, not a restaurant-specific order management system. Advanced loyalty programs, delivery logistics, and restaurant-specific workflow tools are thin or absent compared to dedicated platforms. Most operators outgrow it as volume and menu complexity increase.

5. Olo: Best for Multi-Location and Enterprise Restaurant Groups

What it is: Olo is purpose-built for restaurant chains and franchise operators managing high-volume ordering across multiple locations with centralized menu control. It’s the only platform in this comparison designed from the ground up for that level of operational complexity.

Standout capability: Deep POS connectivity and custom integrations with loyalty, CRM, and delivery partners give enterprise operators a single system of record for ordering across a large portfolio. No other platform in this comparison handles multi-location ordering at chain scale without significant customization.

Pricing signal: Enterprise contracts with custom pricing. Olo is not a self-serve purchase and requires a sales process and contract negotiation before onboarding.

Limitation: Olo is not designed for independent restaurants or small groups. The pricing model, implementation scope, and contract structure are mismatched to operations below a meaningful multi-location threshold.

Side-by-Side Comparison: Online Ordering Systems Ranked

Side By Side Comparison

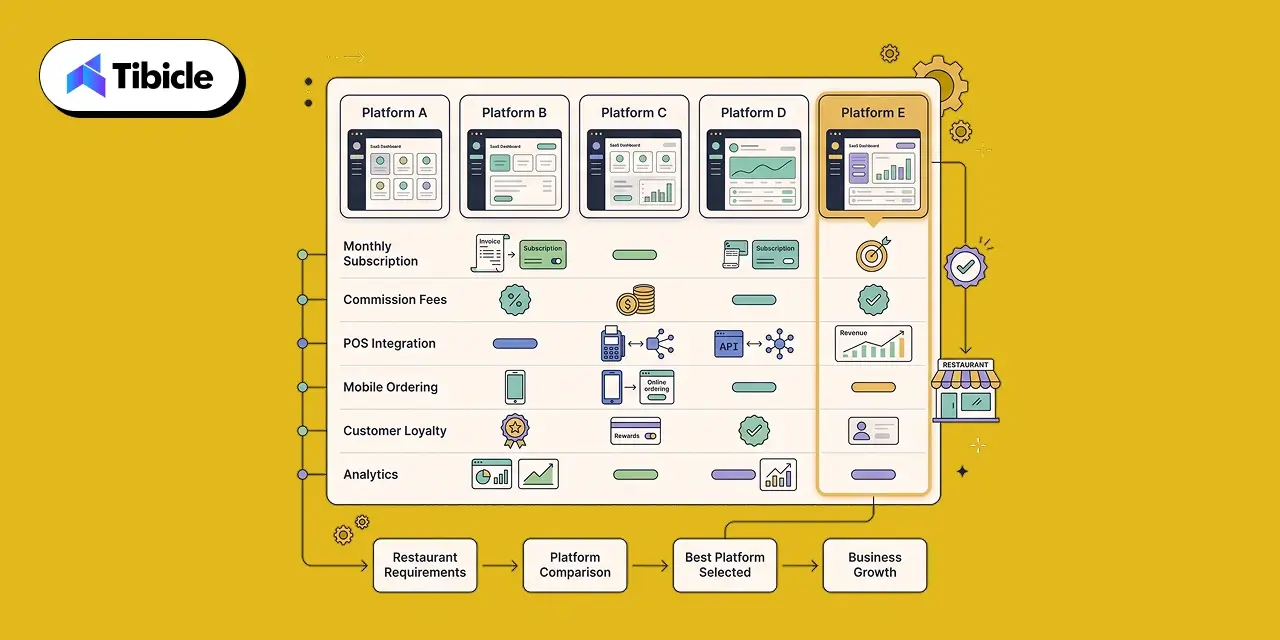
Use this table to narrow the field before going deeper on any platform. Pricing reflects publicly available 2026 figures and varies with contract terms, hardware, and add-ons. Verify directly with vendors before building a year-one budget.

PlatformMonthly CostCommissionPOS IntegrationsBest ForLoyalty Built-In
Toast$69+ (add-ons)$0.99/orderNativeFull-service restaurantsYes
Owner.com$499 flat0%Square, ToastHigh-volume direct orderingYes
ChowNow$119 to $3280% (+ processing fee)30+ systemsPOS-flexible independentsPartial
Square OnlineFree to $60+0%Native SquareSmall / entry-level restaurantsLimited
OloCustom0%Enterprise-gradeMulti-location chainsYes

Pricing Reality Check: What You’ll Actually Pay in Year One For Online Ordering Systems

The number on a vendor’s pricing page is a starting point. Year-one costs for restaurant ordering platforms consistently run higher once hardware, onboarding, and per-transaction fees are accounted for. Budget from the full picture, not the headline.

The Hidden Costs Operators Miss Before Signing

  • Hardware: Toast requires proprietary terminals purchased upfront; Square Online works on existing iPads, significantly lowering the entry cost
  • Setup and onboarding fees that don’t appear in the advertised monthly subscription
  • Processing fees underneath commission-free claims: ChowNow charges 2.95% plus $0.29 per transaction; Owner.com passes no processing fee to the restaurant
  • Add-on pricing for loyalty, SMS marketing, and delivery logistics that fall outside the base plan on several platforms

Rough Year-One TCO Snapshot by Restaurant Type

Food truck or cafe generating $5,000 a month online: Square Online on the free plan runs approximately $1,800 a year in processing fees alone, with no monthly subscription cost.

Independent full-service restaurant at $15,000 a month: ChowNow Pro runs $2,748 a year plus processing. The same monthly volume through a third-party marketplace at 30% commission costs $54,000 a year. The platform choice at this volume materially changes the P&L.

Established multi-location group: Owner.com runs $5,988 a year at a flat fee across locations versus Olo’s custom enterprise pricing. The right answer depends on whether centralized multi-location management at the group’s unit count justifies the Olo contract structure.

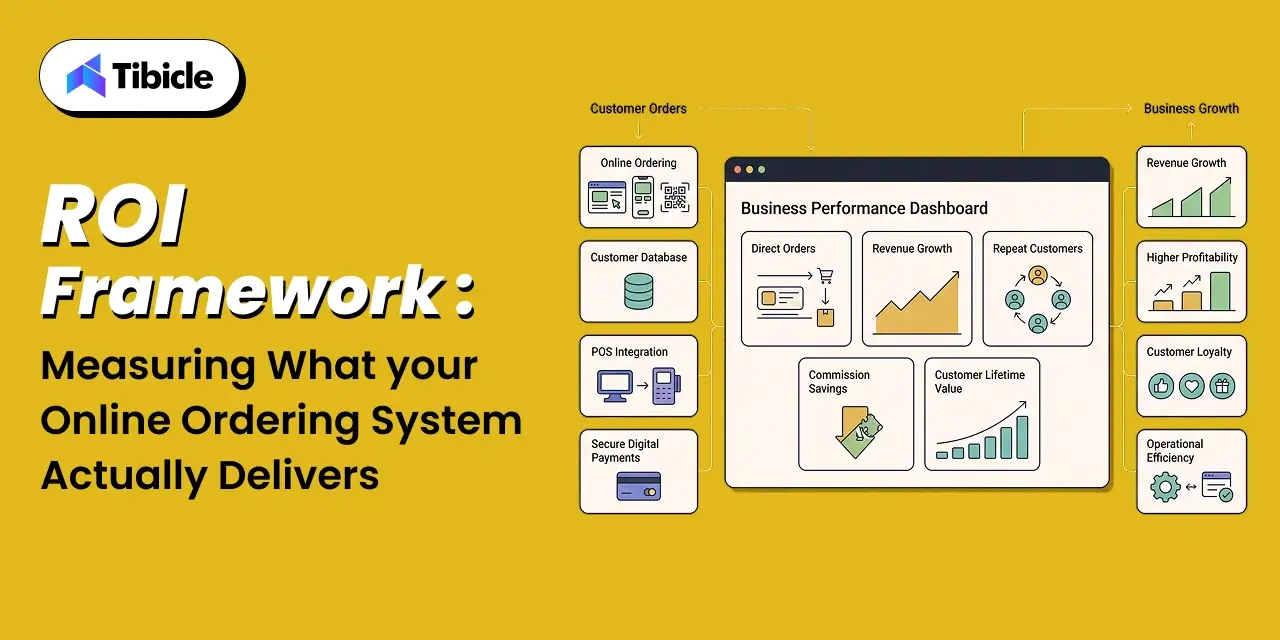
ROI Framework: Measuring What Your Online Ordering System Actually Delivers

ROI on a direct ordering platform isn’t a single figure. It’s three levers operating at once. Operators who track only commission savings typically undercount the financial impact by 30 to 40%.

ROI Framework

The Three ROI Levers That Matter

  • Commission savings: the dollar amount retained per order when volume shifts from a marketplace platform to a direct channel
  • Customer lifetime value: owning customer data directly increases customer lifetime value by 67% through direct marketing and loyalty programs, based on industry research
  • Operational efficiency: a consolidated order management system reduces kitchen errors, eliminates multi-tablet workflows, and cuts the labor cost of managing fragmented ordering channels

Break-Even Calculator Logic

At 50 delivery orders a week, a $35 average ticket, 25% third-party commission, the annual fee to the marketplace is $22,750. Switching to a $ 229-a-month flat-fee platform costs $2,748 a year plus processing. Net year-one saving: approximately $19,000 before loyalty uplift or repeat-order growth is counted. Restaurants implementing direct online ordering platforms report a 10% increase in overall sales post-implementation, which means the commission savings figure typically understates the full financial outcome.

What Strong ROI Looks Like at 12 Months

  • A measurable reduction in effective cost per order across the online channel
  • Growth in an owned customer contact list, emails, and SMS numbers that the restaurant controls
  • A higher repeat order rate from the direct channel compared to third-party referrals
  • A higher average order value on direct orders, driven by upsell prompts and loyalty integration that marketplace platforms don’t surface

Risks and Failure Modes Restaurants Don’t Talk About

Most platform evaluations focus on the upside. These three failure modes show up consistently after the contract is signed and the credentials are issued.

Choosing a Platform That Owns Your Customer Data

Data portability is a contract issue, not a feature. Some platforms restrict export formats or require specific data structures that make the customer list difficult to use in external email or SMS tools. Full, unrestricted access to customer emails, order history, and behavioral data should be confirmed in writing before signing. Running a hybrid model that keeps third-party apps for discovery doesn’t change this: DoorDash and Uber Eats retain guest data even when the restaurant fulfills the order directly.

POS Mismatch and Integration Failures

Middleware integrations introduce a dependency layer that fails during POS software updates in ways that native connections don’t. A Square-to-Square or Toast-to-Toast integration is built to stay synchronized across version changes. A middleware-dependent connection relies on a third party maintaining compatibility between two systems it didn’t build. If staff is managing incoming orders across multiple tablets, that’s an integration failure, not an operational preference. It signals that data isn’t moving cleanly between the ordering platform and the POS.

Scaling Without a Direct Marketing Channel

A restaurant processing 10,000 monthly orders through a direct platform but with no owned customer contact list hasn’t captured the full value of the switch. The restaurant online ordering platform should feed directly into SMS campaigns, email sequences, and loyalty programs from day one. A direct ordering system that operates in isolation from the marketing stack reduces the investment to a commission-saving exercise and misses the customer lifetime value increase that makes the economics compelling in the long term.

Vendor Selection Checklist for Online Ordering Systems: Before You Sign Anything

These are the questions that separate a platform that pays for itself from one that becomes a recurring cost. Work through this list with every vendor before committing to a contract.

  • Does the platform charge commission per order or a flat monthly fee?
  • Do you have full, unrestricted export rights to all customer data?
  • Does it connect natively with your current POS, or through a middleware layer?
  • Is mobile ordering built for one-tap checkout with Apple Pay and Google Pay?
  • Does the base plan include loyalty, SMS, and email marketing, or are these billed separately?
  • What is the true year-one cost, including hardware, setup fees, and processing?
  • Is delivery logistics built into the platform, or does it require a separate third-party delivery integration?
  • Is the contract month-to-month, or does it carry an annual lock-in with early exit terms?

Why Tibicle LLP Is Worth Considering for Online Ordering Systems Implementation in Restaurant Tech

Choosing the right platform is the first decision. Implementing it correctly is what determines whether it pays off. Restaurant operators regularly select a strong platform and then miss POS sync configurations, skip loyalty setup, or never build the direct marketing funnel that makes the economics compound over time.

Tibicle handles end-to-end restaurant technology implementation: matching the platform to actual order volume and POS infrastructure, integrating it with existing systems, and building the direct-ordering funnel, branded app, loyalty program, and SMS channel from day one rather than as an afterthought six months into the contract.

The difference between a vendor relationship and a Tibicle engagement is that the vendor issues a login and a documentation link. Tibicle maps the entire setup to revenue goals. The checklist above is the same framework the team applies before recommending a platform to any restaurant client.

Speak with Tibicle’s restaurant tech team before your next contract renewal.

Conclusion

The five online ordering systems in this comparison each solve a specific problem. Toast is an ecosystem decision for full-service restaurants that want one vendor across POS, ordering, and labor. Owner.com delivers margin recovery for restaurants with enough order volume to make a flat fee work. ChowNow gives operators broad POS compatibility without forcing a system replacement. Square Online removes the cost and complexity barrier for food trucks and smaller operations getting started. OLO handles the operational complexity of enterprise chains at a scale the other four platforms aren’t built for.

The platform decision comes down to order volume, POS stack, and 12-month growth targets, not which brand has the most recognition or the most features listed on a pricing page. Third-party marketplaces remain part of the customer acquisition strategy for most restaurants in 2026. But the operators building durable margins are the ones who own the repeat customer relationship and the revenue that comes with it.

Frequently Asked Questions

What is an online ordering systems for restaurants?
A software platform that allows customers to place food orders through a restaurant’s website, branded app, or QR code, without routing the transaction through a third-party delivery marketplace.

How much do restaurants lose to third-party delivery commissions?
Headline commissions run 15 to 30% per order. The effective cost reaches 30 to 40% once processing fees, promotional discounts, and refund adjustments are included. At $10,000 a month in order volume, that’s $3,000 to $4,000 leaving the business every month through one channel.

Can an online ordering systems integrate with my existing POS?
Most current platforms support POS integration. ChowNow connects with more than 30 POS systems. Toast and Square offer native integrations within their own ecosystems. Owner.com integrates directly with both Square and Toast. Always confirm your specific POS version is on the vendor’s supported list before signing a contract.

What is a commission-free online ordering systems?
A platform that charges a flat monthly fee rather than a percentage of each transaction, letting the restaurant retain full revenue per order regardless of volume. Some commission-free platforms still apply per-transaction processing fees; confirm the full cost structure before assuming zero commission equals zero per-order cost.

How long does it take to see ROI from a direct online ordering systems?
Most operators see measurable margin improvement within 60 to 90 days of migrating repeat customers from third-party platforms to direct ordering. Time to ROI depends on current monthly order volume and how much commission exposure the restaurant was carrying before making the switch.


Restaurant Management System: Complete Guide to Features, Cost, and ROI in 2026

Introduction

A restaurant management system has moved from a back-office convenience to the operational core of how restaurants run in 2026. The global restaurant management software market was valued at $5.79 billion in 2024. It is  projected to reach $14.70 billion by 2030, growing at a 17.4% CAGR. That growth is not happening in a vacuum. It is a direct response to margin pressure: in 2025: 42% of operators reported that their restaurants were not profitable, and more than 9 in 10 cited food and labor as significant cost challenges.

 Restaurant Management System

The problem most operators run into is not whether to adopt a restaurant management system. It is choosing a system that removes cost instead of adding it. If it does not integrate with the restaurant POS system, cannot handle multi-location reporting, or gets abandoned by kitchen staff after two months does not protect margin; it erodes it. This guide breaks down what such system includes, what the core features do for the P&L, what such system costs in 2026, and how to calculate the return before signing anything.

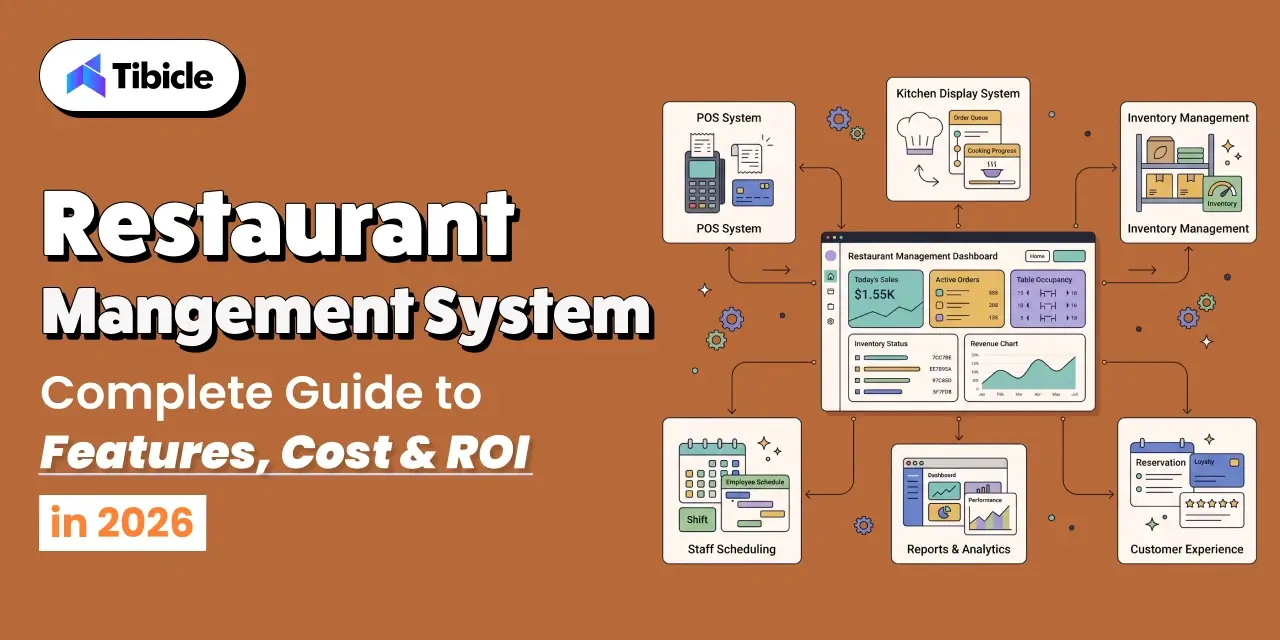
What a Restaurant Management System Actually Includes

A restaurant management system is not a single tool. It is a connected set of modules that share data, with the restaurant POS system acting as the hub that every other component reads from. When operators evaluate, the distinction that matters is how tightly these modules talk to each other, not how many features appear on the vendor’s sheet. A strong restaurant POS system feeds clean data to every module downstream.

A typical restaurant management system covers the following operational layers:

  • Point of sale: the restaurant POS system handles order entry, payment processing, and the transaction record that feeds every other module.
  • Restaurant inventory management: restaurant inventory management ties stock depletion to sales, plus purchase orders, recipe costing, and waste tracking.
  • Kitchen operations: order routing to a kitchen display system, ticket timing, and station-level coordination.
  • Staff and scheduling: labor scheduling, time tracking, and labor-cost reporting against sales.
  • Reporting and analytics: daily sales, food cost, and labor cost visibility, ideally by location and by day.

The value of a restaurant management system comes from these layers sharing one data source. When the restaurant POS system records a sale, restaurant inventory management should deplete stock in real time, and the reporting layer should reflect the margin impact without a manual export. Restaurant inventory management that runs on live POS data is the difference between control and guesswork. A collection of disconnected tools that each solve one problem is not a restaurant management system; it is a reconciliation burden.

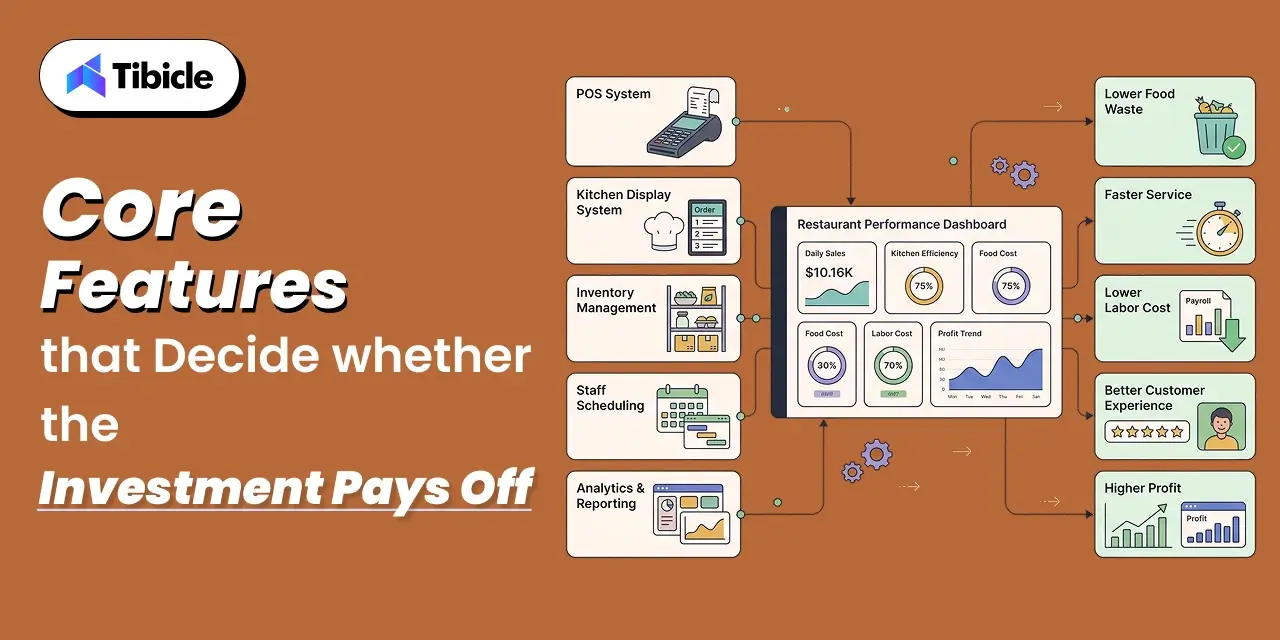
Core Features That Decide Whether the Investment Pays Off

Restaurant Management System

Not every feature in a restaurant management system moves the P&L. A short list does. These are the capabilities worth weighting heavily in any evaluation, because they map directly to cost recovery.

POS Integration Depth in a Restaurant Management System

The restaurant POS system is the center of the stack, so how the other modules connect to the restaurant POS system decides everything downstream. Real-time restaurant inventory management tied to POS sales is categorically different from an end-of-day sync. A restaurant management system that updates inventory once every 24 hours hands you yesterday’s problem. Ask vendors specifically about sync frequency and what happens when the restaurant POS system integration drops mid-service.

Recipe Costing and Food-Cost Visibility

Food and beverage costs run 28% to 35% of revenue for full-service restaurants, and most of the variance hides in the gap between theoretical and actual usage. A system with recipe costing that pulls live invoice pricing gives operators a real cost-per-plate number instead of a stale estimate. Without it, restaurant inventory management stays a counting exercise rather than a cost-control tool, and the restaurant management system never pays back what it promised.

Kitchen Display and Order Routing in a Restaurant Management System

A kitchen display system connected to the restaurant POS system replaces paper tickets with live, routed orders. Orders reach the correct station, get bumped when complete, and stay logged for reporting inside the restaurant management system. The operational payoff shows up during peak service, when missed or duplicated tickets cost more than the software does.

Labor Scheduling Against Sales

With labor consistently at 30% to 35% of revenue, a restaurant management system that schedules staff against forecast sales, not guesswork, directly affects margin. The scheduling module is only useful when it reads from the same sales data the restaurant POS system captures, the same source that drives restaurant inventory management.

Reporting That Is Current, Not Month-End

The operators who struggle most are the ones who learn their food cost was high when the month-end P&L arrives, weeks after the problem occurred. A system earns its cost when it surfaces daily food and labor cost by location, early enough to act on, with restaurant inventory management data feeding the numbers in real time.

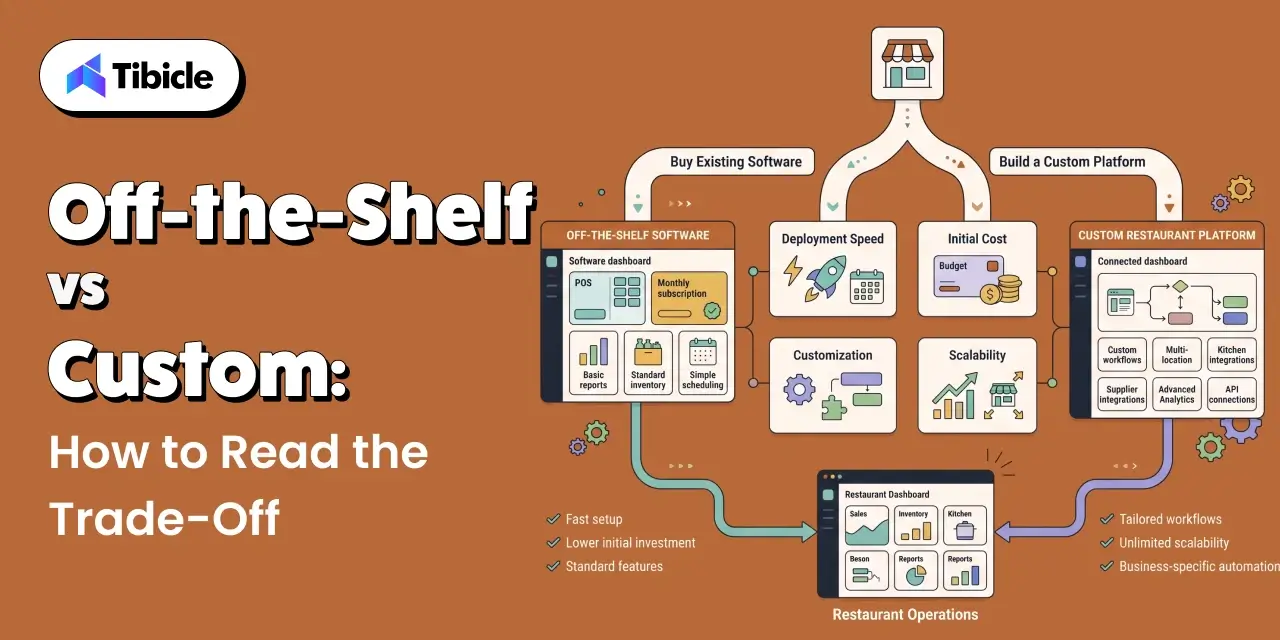
Off-the-Shelf vs Custom: How to Read the Trade-Off

Restaurant Management System

Most restaurants should start with an off-the-shelf system. Platforms like Toast, Square, and Lightspeed cover standard single-location and small-group operations well, deploy quickly, and spread cost across a predictable monthly fee. The decision gets harder when an operation has workflows a standard management system cannot model without expensive workarounds, or a restaurant POS system that resists third-party integration.

A practical way to read the trade-off:

  • Stay off-the-shelf when: you run one location or a small group, your menu and pricing are standard, and you need to launch in weeks. The restaurant POS system and its native modules will cover you.
  • Consider custom when: you run multiple concepts from one kitchen, carry proprietary supplier contracts, need tax logic across regions, or your restaurant inventory management has to behave in a way no off-the-shelf restaurant inventory management module supports.

The tipping point is cost-competitiveness. When the cost of customizing and maintaining workarounds on an off-the-shelf management systems approaches the cost of a purpose-built one, custom stops being the expensive option.

What a Restaurant Management System Costs in 2026

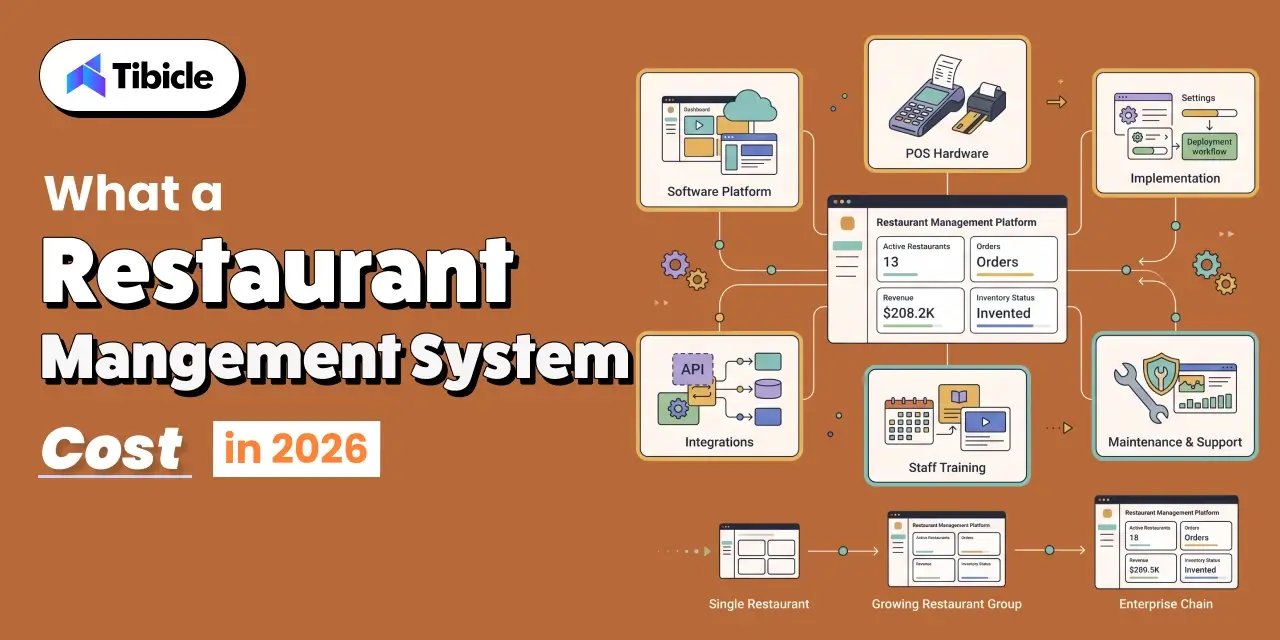
What a Restaurant Management System Costs

A restaurant management system is priced on published starting rates, but what vendors rarely publish is the total operators actually pay after setup, integration, training, and the tier upgrade that arrives when entry-level features fall short. 

The ranges below reflect publicly available 2026 restaurant management system pricing and should anchor a budget conversation, not replace vendor quotes.

Operation SizeTypical Monthly CostWhat Drives It
Single location$150 to $400 / locationPOS software, basic inventory, one terminal
Small group (3 to 10)$800 to $2,500 / monthMulti-location reporting, deeper inventory, integrations
Enterprise (20+)$5,000+ / monthChain-wide control, forecasting, custom contracts
Custom buildScoped per projectHigher upfront, no per-terminal license, full ownership

Two cost lines operators consistently underestimate: onboarding and setup fees, which can run several hundred dollars per location, and the internal labor cost of integrating the restaurant POS system with restaurant inventory management and the rest of the stack. Budget an extra 15% to 20% on top of the subscription for the first year.

Restaurant Management System ROI: What the Numbers Say for 2026

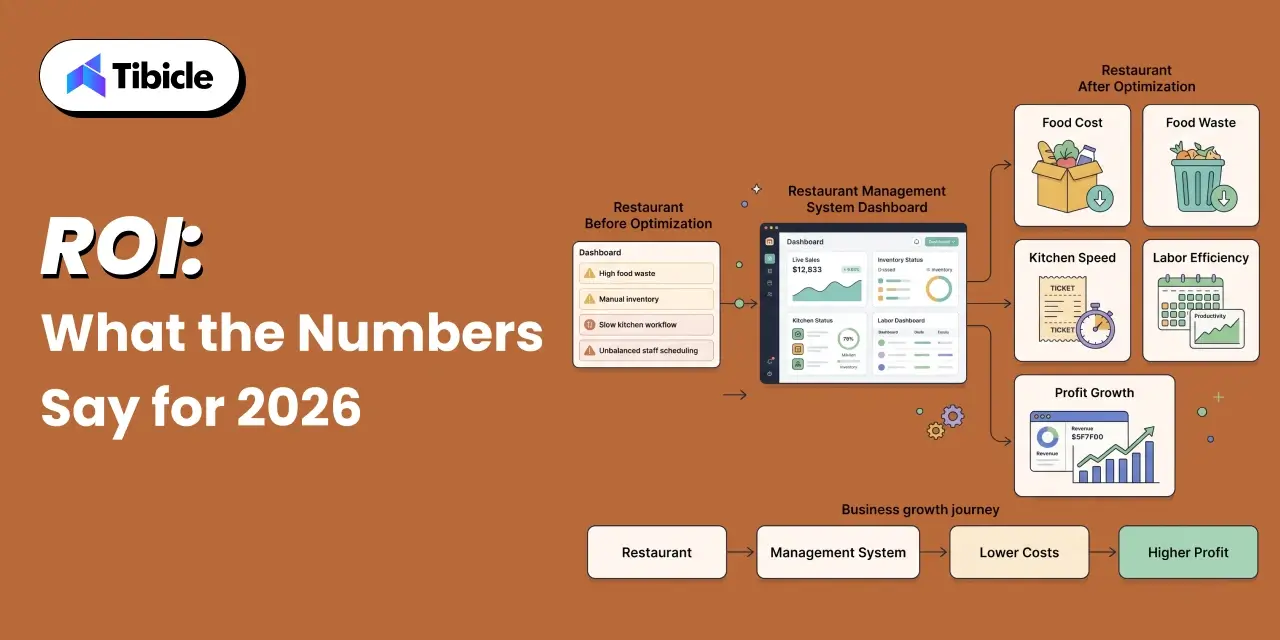
ROI: What the Numbers Say for 2026

The return on a restaurant management system is a math problem with established inputs, not a leap of faith. Two levers do most of the work in any management system rollout: food cost and labor.

Food Cost Recovery

Restaurants using inventory software report roughly 35% less food waste and a 2% to 5% drop in food-cost percentage. For a restaurant generating $1 million in annual revenue at 32% food cost, cutting food cost by two points saves about $20,000 a year, often more than the software and the labor to run it. Disciplined restaurant inventory management inside a system is where that recovery comes from.

Labor Recovery

Manual stock counting eats management hours every week. Restaurants that move counting into software report an 80% reduction in counting time. Folding restaurant inventory management into a system recovers that management labor and improves accuracy over clipboard estimates at the same time. Most operations see measurable food-cost change within 30 to 60 days of going live.

Payback Timeline

  • Independent restaurants (1 to 2 locations): 3 to 6 month payback is typical.
  • Mid-market groups (3 to 10 locations): often under 90 days when food-cost variance is addressed directly.
  • Enterprise chains: ROI compounds across waste reduction, restaurant inventory management gains, and purchasing efficiency at scale.

The efficiency case is backed at the industry level: among operators who increased technology investment over the past two to three years, 69% say it made operations more efficient and productive.

Risks Operators Underestimate Before They Sign

The system fails more often from implementation than from a bad product. 

  • Integration failure with the existing POS: not every restaurant POS system connects cleanly to every module. Verify API compatibility and sync frequency between the restaurant POS system and restaurant inventory management, and ask for a reference running your exact POS version.
  • Data accuracy in the first 90 days: recipe libraries, unit-of-measure mismatches, and supplier catalog errors corrupt restaurant inventory management data early. Assign one internal owner for data hygiene before go-live.
  • Kitchen staff adoption: the fastest-failing rollouts skip change management. If back-of-house staff do not trust the restaurant inventory management workflow, counts stop happening accurately and the restaurant POS system data loses its value.
  • Outgrowing the platform: choosing a system built for your current size, not your 3-year plan, sets up an expensive migration to a bigger system later. Ask vendors about customers at your target scale.

Restaurant Management System Buyer Checklist: What to Verify Before You Commit

Use these questions to separate a good system demo from a good fit:

  • Does the system integrate with your current restaurant POS system without custom development?
  • Does restaurant inventory management update in real time, or on an end-of-day sync?
  • Can you see daily food and labor cost by location, not just month-end totals, with restaurant inventory management feeding the food-cost number?
  • Does restaurant POS system pricing scale predictably as you add locations?
  • What is the onboarding timeline, and who owns setup and staff training?
  • Does the vendor have reference customers at the scale you are planning for?

When a Custom Restaurant Management System Makes More Sense Than a Platform

Off-the-shelf platforms cover most restaurants well. They fall short for operations with non-standard workflows: dark kitchens running multiple brands from one facility, cloud-kitchen aggregators managing proprietary supplier contracts, and vertically integrated chains with custom procurement logic. For those, the customization required to force-fit a standard system often costs more than a purpose-built system that models the operation as it actually runs.

Tibicle LLP builds AI-powered web and mobile applications, custom POS software, and connected kitchen systems for restaurant operators in that category. Its restaurant tech, custom POS, and kitchen systems services run from a scoped MVP to a full restaurant management system partnership. For deeper context on controlling food cost through software, see Tibicle’s guide to the best restaurant accounting software in 2026.

Conclusion

Choosing a system is not about counting features. It is about selecting the system that removes the most cost from your structure with the least implementation risk. The restaurant POS system anchors the stack, restaurant inventory management protects the food-cost line, and the reporting layer turns both into decisions you can act on before month-end.

Single-location operators have a different right answer than growing groups, and growing groups a different answer than enterprise chains. The decision logic holds across all three: match the restaurant management systems to your cost structure and your growth plan, not to the demo that looked best in the room. 

Ready to map the right restaurant management system to your operation, or scope a custom build? Talk to the Tibicle team.

Frequently Asked Questions

What is a restaurant management system?
A restaurant management system is a connected set of modules- POS, restaurant , kitchen display, inventory management, scheduling, and reporting- that share one data source. The restaurant POS system records sales, and the other modules in the system read from it to control cost and coordinate operations.

How is a restaurant management system different from a POS?
A restaurant POS system records transactions. A restaurant management system uses those transactions to run restaurant inventory management, cost recipes, schedule labor, and report margin. The restaurant POS system captures revenue; the wider system controls cost.

How much does a restaurant management system cost in 2026?
A system for a single location typically costs $150 to $400 per month. Groups of 3 to 10 locations budget $800 to $2,500 monthly. Enterprise system platforms start above $5,000 a month. Add 15% to 20% for setup, restaurant POS system integration, and training in year one.

How long before a restaurant management system pays for itself?
Most operators see measurable food-cost improvement within 30 to 60 days once restaurant inventory management is live. Full payback on such system is typically 3 to 6 months for independents, and often under 90 days for multi-unit groups with high food-cost variance.

When should a restaurant build custom instead of buying?
When workflows are non-standard, multiple kitchen formats, proprietary supplier contracts, or multi-brand aggregation, that a standard system cannot handle without costly workarounds. A custom system becomes cost-competitive above that complexity threshold, especially when restaurant inventory management has to follow rules no vendor supports.

10 Ways Table Management Software Boosts Restaurant Revenue

What This Guide Covers

Who this is for: Restaurant owners, GMs, and multi-location operators running the dining room on paper wait lists or verbal host-server updates, who are evaluating whether table management software can convert unused floor capacity into measurable revenue.

Search intent: Evaluation and decision, the reader isn’t asking what table management software is. They’re deciding whether the ROI on turnover, no-show recovery, and labor forecasting justifies the switch, and which platform fits their cover volume and service model.

What you will walk away with: 10 specific, revenue-tied mechanisms (no-show recovery, turn optimization, waitlist conversion, dynamic staffing, and more), each with a dollar-figure business outcome, a 2026 pricing breakdown across five platforms, including cover-fee traps, a full ROI model for a 60-seat restaurant, and a 12-point vendor selection checklist to run before signing a contract.

table management software

Introduction

A 60-seat restaurant running a 10% no-show rate on just 30% reservation traffic loses an estimated $420 every week, not from poor food or slow service, but from how the dining room is managed. That is a recoverable number, and it is only one of the ways manual floor operations drain revenue that the P&L never labels correctly.

The status quo in most independent and mid-size restaurants is invisible: paper wait lists, verbal table updates between host and server, and no record of why Tuesday at 7 pm consistently underperforms. Every gap between covers, every no-show that goes unrecovered, every section running at 60% while another is overloaded, none of it shows up as a line item. It just shows up as a margin that does not move.

A table management system is not an operational convenience. It is a revenue tool built on the capacity you already own. This guide covers 10 specific, measurable ways the right software converts empty seats into revenue, written for restaurant owners, GMs, and operators accountable to P&L, not technology procurement.

What a Table Management Software Actually Does

Beyond Reservations: The Revenue Layer a Table Management Software Adds

The table management software category is not about replacing a reservation widget. It is about creating real-time visibility into every seat in the dining room, what is occupied, what is turning, what is running behind dwell time, and what is recoverable before the service window closes.

The market signal confirms the direction: the table and delivery management segment is growing at a 19.6% CAGR through 2030. Operators who delay adoption are not holding a position. They are falling behind competitors who are building a 12-month data advantage in cover history, peak-period performance, and guest behavior data that compounds in value the longer it is collected.

How Table Management Software Differs from a Basic POS or Reservation Widget

A POS records a transaction after it happens. A seating management system optimizes the conditions that create more transactions before and during service. The distinction is guest flow intelligence versus transactional record-keeping. A table management system tells you how many more sales were possible and what prevented them.

Floor plan management, waitlist sync, real-time table tracking, and reservation coordination are the operational layer. Revenue velocity is the output.

10 Ways a Table Management Software Boosts Restaurant Revenue

1. Cuts No-Show Losses with Automated Confirmation Workflows

Automated SMS and email confirmations, combined with deposit prompts at booking, reduce the empty table time that no-shows create during peak hours. The mechanism is behavioral: guests who confirm a reservation or provide a card on file cancel or adjust at a higher rate than guests who book without friction.

Business outcome: A restaurant running 30% reservation volume at a 10% no-show rate recovers approximately $420 per week through waitlist management backfill when an automated confirmation workflow is active. Annualized, that is $21,840 recovered from a problem that costs nothing to fix at the system level.

2. Increases Table Turns Without Rushing Guests

Real-time table status tracking combined with predicted dwell time alerts allows hosts and managers to pace the floor proactively, identifying tables approaching the end of their service window before the next party arrives, not after they are already waiting. Restaurants that build turnover optimization into front-of-house operations see 20–30% more covers during peak service without measurable negative impact on guest satisfaction scores.

Business outcome: Each additional turn on 10 tables at a $45 average check generates $450 per shift. Across five service days, that is $2,250 per week from the same floor space, the same staff, and the same kitchen.

3. Eliminates Dead Time Between Covers

Manual floor management creates gaps: a table is cleared, the busser signals the host, the host checks availability, a party is pulled from the wait list, and two to four minutes pass while the next cover waits. A table management system collapses that sequence. Cancellations, walk-ins, and reservation updates sync in real time, vacant tables resurface in the host view the moment they become available.

Business outcome: Fewer minutes between parties across 30 tables per service compounds into measurable cover count improvement over a week of operations. Real-time table tracking replaces guesswork with a live floor view that any staff member can read in seconds.

4. Optimizes Floor Layout for Revenue Per Square Foot

Visual floor plan management tools allow operators to test seating configurations, section allocation, and the ratio of 2-tops to 6-tops before service, not during it. Historical analytics surface which sections consistently underperform on revenue, which server sections turn fastest, and where the floor layout is creating bottlenecks that cost covers.

Business outcome: Operators who track section performance by revenue generated, not just seats occupied, identify yield gaps that are invisible in manual systems. A section running at 70% occupancy with 90% of a neighboring section’s revenue is a layout problem, not a demand problem.

5. Converts Waitlist Guests Into Confirmed Revenue

A digital waitlist with SMS notification keeps walk-in guests engaged when the dining room is at capacity, reducing walkaway rate during peak hours when demand exceeds available covers. Seventy-two percent of guests will wait no more than 30 minutes; the variable is whether they stay engaged during that window or leave for a competitor. An automated text update every 10 minutes is the difference between a covered table and a lost party.

Business outcome: Higher waitlist-to-seated conversion during peak periods directly increases covers per service without adding capacity. The restaurant capacity management value here is not more seats, it is fewer seats wasted.

6. Builds Guest Profiles That Drive Repeat Visits

An integrated guest CRM captures visit history, seating preferences, dietary flags, occasion notes, and spend patterns across every interaction. That data transforms the service from generic to personalized, and personalized service drives both larger checks and stronger return rates. A guest whose anniversary dinner is remembered without prompting is not a satisfied customer. They are a loyal one.

Business outcome: Guest retention is cheaper than acquisition at every revenue stage. The data captured by a table management system reduces churn through relevance — the server already knows the table prefers the back corner and ordered the tasting menu last time. That is not a nice-to-have. That is a retention mechanism.

7. Enables Upselling Through Smarter Seat Assignment

Pre-arrival guest data allows hosts to match high-value guests to premium sections, experience seats, or tables suited to their party size and history before they walk in. Servers can prepare table setup, review previous orders, and personalize the interaction before the first greeting. The commercial outcome is incremental spend driven by service quality, not upselling pressure.

Business outcome: A guest assigned to a premium section based on spend history and preference data spends differently than a guest assigned at random. The guest experience improvement is the mechanism, the revenue uplift is the result.

8. Powers Revenue Decisions with Real-Time Analytics

Peak period identification, bottleneck mapping by section, server performance data by cover count and average check, and shift-level occupancy trends, all of this is surfaced by restaurant table turnover and floor analytics within the platform. Managers stop reacting to problems identified after service closes and start pre-empting them before the first party is seated.

Business outcome: A manager who knows that Thursday at 8pm consistently creates a 12-minute gap between covers in section three can staff, pace, and sequence differently. That is a decision only real-time data makes possible.

9. Reduces Labor Waste During Low-Occupancy Periods

Demand forecasting built from historical booking data enables right-sized staffing by shift, not by the manager’s estimate of how busy it “feels” on a given Tuesday. Overstaffing slow shifts and understaffing peak shifts is a margin drain that appears in the labor percentage but is rarely traced to its source. Scheduling decisions made against actual booking data close that gap before the shift is posted.

Business outcome: Labor cost optimization from forecast-driven scheduling is recoverable margin, and it scales directly with location count. Multi-location operators running the same manual staffing process across five units are compounding the same inefficiency five times over.

10. Supports Multi-Channel Bookings Without Operational Chaos

Reservations arriving from Google, Instagram, a website widget, and phone calls simultaneously create a coordination problem when each channel updates a different system. A restaurant reservation software layer funnels every booking source into a single floor plan view, eliminating double-booking, ensuring walk-in visibility is always current, and giving every front-of-house staff member the same real-time picture of the dining room.

Business outcome: POS integration combined with unified booking consolidation means the floor view, the ticket system, and the reservation record all reflect the same state. Dynamic pricing and cover fees by channel become manageable when all channels report to one system.

Manual vs. Digital: What the Operational Gap Actually Costs

table management software

FactorManual / Paper-BasedTable Management System
No-show visibilityNone — discovered at serviceReal-time; backfill automated
Table turn trackingEstimated by staffAutomatic; per-table dwell time
No-show recoveryWalk-in hopeWaitlist SMS backfill
Peak hour staffingBased on gut feelDriven by booking data
Guest data captureZero or fragmentedCentralized CRM per guest
Revenue analyticsWeekly manual talliesReal-time by section and shift
Multi-channel bookingsPhone + one widgetUnified across all channels

The gap is not about technology preference. It is about how many seats generate revenue per service. Every row in that table represents a decision that manual systems make slowly, inaccurately, or not at all, and that a table management system makes in real time.

What Does a Table Management Software Cost in 2026?

How Pricing Models Are Structured for Table Management Software

Three primary pricing models exist in this category: flat monthly subscription, per-cover fee, and hybrid structures that combine both. The per-cover fee model carries the most risk for high-volume venues. A restaurant doing 1,500 covers per month on OpenTable’s network rate faces $1,500–$2,250 per month in cover charges alone — on top of the subscription fee. That number is rarely visible in the headline pricing conversation.

Pricing Tier Snapshot  2026

PlatformStarting PriceCover Fee ModelBest For
OpenTable$149/monthYes — $0.25–$1.50 per coverHigh-visibility venues
Resy$249/monthNo cover feesUpscale and fine dining
SevenRooms~$700/monthNo cover feesEnterprise and multi-location restaurants
Eat AppFree / $129+No cover feesIndependent and mid-size restaurants
TableinFrom €37/monthNo cover feesBudget-conscious operators

The Right Question Is Not “What Does It Cost?”  It’s “What Does Inaction Cost?”

Every missed no-show, a gap between covers, or a manual seating error that sends a high-value guest to the wrong section each one carries a real dollar cost. The software cost is a line item. The revenue at stake is not, because it never appears on the P&L as a loss. It simply never appears as income.

ROI Breakdown What Operators Actually Get Back

Calculating the Return for a Mid-Size Restaurant

Working example: 60-seat restaurant, $45 average check, five service days per week.

Recovering one additional turn on six tables per night generates $270 per night, $1,350 per week, and $70,200 per year. No-show recovery at $420 per week adds $21,840 annually. Combined impact at conservative assumptions: more than $90,000 in annual revenue upside against a software cost of $250–$700 per month. The business case is not close at this revenue scale.

Metrics That Signal ROI Is Working

  • Table turnover rate improvement: target +0.5 to 1 additional turn per peak service period
  • No-show rate reduction: baseline 10–15%; optimized target under 5%
  • Average covers per service: tracked as a trend line, not a single-night result
  • Revenue per available seat hour (RevPASH): the metric that serious operators use to evaluate floor performance across shifts and sections

When ROI Timelines Are Longer Than Expected

Staff training lag, POS integration delays, and behavioral change at the host stand all add time between software deployment and measurable return. Operators who phase implementation  starting with reservations and floor plan visibility, then adding guest CRM — see faster adoption and faster payback than those who activate every module simultaneously before staff are comfortable with the core workflow.

Risks and Challenges to Anticipate Before You Buy

table management software

Integration Complexity with Existing POS Systems

Not all platforms integrate cleanly with all POS systems. A patchwork connection, one that requires a manual export to sync reservation data with transaction records, defeats the analytics value proposition entirely. Verify native integration with your specific POS model before committing, not after the contract is signed.

Staff Resistance and Training Overhead

System capability is not system utilization. A front-of-house team that does not trust the floor view will revert to verbal table updates within two weeks of go-live. Budget for structured training time, not just the vendor onboarding call, and build adoption tracking into the 30-60-90 day post-launch review.

Per-Cover Fee Structures That Erode Margin at Scale

At high reservation volumes, per-cover pricing outpaces the subscription cost of flat-fee alternatives without the operator noticing until the monthly invoice arrives. Run a six-month projection at current reservation volume before signing any per-cover agreement.

Vendor Lock-In and Data Portability

Guest history is an operational asset. A platform that holds that data without export rights creates a switching cost that does not serve the operator. Confirm data portability terms in writing before signing, specifically: what format does the export use, what data is included, and what happens to the data after account cancellation.

Vendor Selection Checklist What to Evaluate Before Committing

Before committing to any table management software, require clear answers to the following:

  • Does it include visual floor plan management with real-time status updates?
  • Does it sync reservations, walk-ins, and waitlists in a single floor view?
  • What is the true all-in monthly cost at your current cover volume, including per-cover fees?
  • Are there per-cover fees and from which booking channels do they apply?
  • Does it integrate natively with your existing POS system?
  • What guest data is captured, stored, and exportable on account exit?
  • Does it offer real-time analytics by section, shift, and server?
  • Can it handle multi-location or multi-floor plan configurations?
  • What is the onboarding and training timeline and is dedicated support included?
  • What happens to your guest data if you cancel the subscription?
  • Is a free trial available before a contract commitment is required?
  • What are the contract terms  monthly versus annual, and what are the exit provisions?

Running a restaurant with over 60 seats and still managing the floor manually? Talk to a specialist at Tibicle LLP to see how the right restaurant reservation software pays for itself in the first quarter.

Top Table Management Software Worth Evaluating in 2026

 top software worth evaluating

OpenTable – Largest diner discovery network; strongest for visibility-driven venues where inbound reservations from new guests are the primary goal. Watch per-cover fees closely at volumes above 1,000 covers per month.

Resy (American Express) – Premium positioning with no cover fees; strong fit for fine dining and upscale casual where the guest relationship is the primary asset.

SevenRooms (acquired by DoorDash, 2025) – Enterprise-grade guest CRM and multi-location management; the strongest option for groups running five or more locations with complex guest data requirements.

Eat App – Cost-effective with a free tier available; strong for independent operators and mid-size restaurants evaluating their first digital floor management tool.

Toast Tables – Native POS integration for restaurants already on the Toast ecosystem; eliminates the integration layer entirely for existing Toast users.
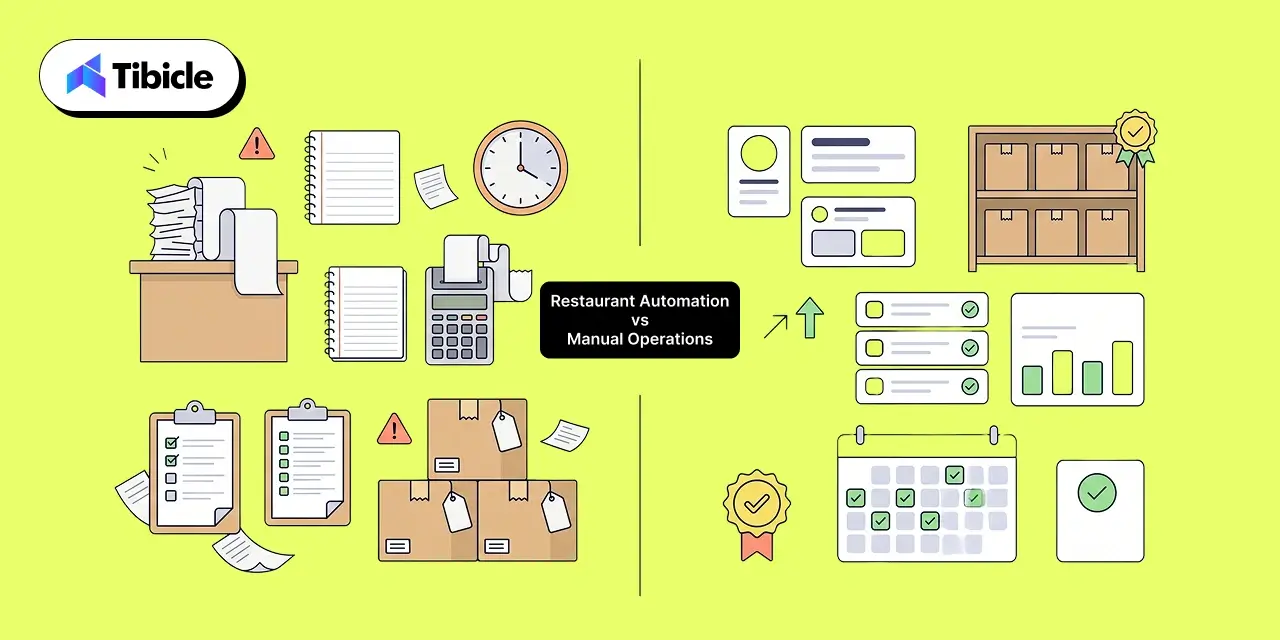
Tablein – Budget-friendly flat pricing suited for smaller independent restaurants where cost per seat is the primary evaluation criterion.

TheFork Manager – Strong European market presence with TripAdvisor-backed diner network access; most relevant for operators with significant European diner traffic.

Pricing accurate as of Q2 2026. Verify directly with vendors before purchase, as pricing structures in this category change frequently.

Why Tibicle LLP Is Worth Considering for Your Table Management Implementation

why tibicle llp

Operators frequently choose the right software and implement it incorrectly, losing the ROI in the first 90 days before the system has a chance to perform. The failure point is rarely the platform. It is the integration architecture, the staff training sequencing, and the absence of a post-launch adoption protocol that holds the gains.

Tibicle LLP works with restaurant groups at the selection and implementation stage — before the contract is signed. The value is cross-platform expertise: Tibicle is not locked into one vendor ecosystem, which means the recommendation starts with the operation’s floor plan complexity and revenue priorities, not a preferred partner relationship.

For multi-location operators and restaurants mid-migration from manual to digital front-of-house operations, that independence matters. The right system implemented correctly outperforms the best system implemented poorly every time.

Evaluating platforms and not sure which fits your floor plan complexity? Tibicle LLP works with restaurant groups at the selection and implementation stage before the contract is signed.

Conclusion

A table management system is not overhead on the P&L. It is a revenue multiplier on the capacity you already own the same seats, the same kitchen, the same staff, generating more covers per service through better information and faster decisions.

The 10 ways covered here are not independent levers. They compound. Turnover improvement funds itself in the first quarter. Guest data becomes more valuable with every visit recorded. Analytics prevent the staffing waste that erodes margin on slow nights. Each function reinforces the others, and the data advantage grows the longer the system runs.

Talk to Tibicle LLP about restaurant tech selection and implementation before you commit to a vendor contract.

FAQs

What is a table management system and how is it different from a reservation tool?
A table management system manages the full lifecycle of a table from reservation intake through seating, service pacing, and turnover while a basic reservation tool handles bookings only. The distinction is operational scope: one manages the transaction, the other manages the floor conditions that determine how many transactions happen per service.

How much does table management software cost for a mid-size restaurant?
Expect $129–$700 per month, depending on platform and feature set. Per-cover fee models can add significantly to total cost at high reservation volumes. Always calculate the all-in monthly cost at your current cover count, not just the subscription headline.

What is a good table turnover rate for a full-service restaurant?
Casual dining benchmarks are 2–3.5 turns per table per dinner service. 

Can a table management system reduce no-shows?
Yes. Automated confirmation requests, deposit collection at booking, and SMS reminders are the primary mechanisms. Reducing the no-show rate from 10% to under 5% has a direct, calculable revenue impact of approximately $21,840 annually for a 60-seat restaurant running 30% reservation volume.

What should restaurants look for when comparing table management platforms?
Prioritize: true all-in cost including per-cover fees at your current volume, native POS integration compatibility, guest data portability on exit, real-time floor plan functionality, and the depth of analytics available by section and shift in that order.

Restaurant Automation: Complete Operations Guide (2026)

What This Guide Covers

Who this is for: Restaurant operators, multi-location F&B group owners, and general managers who are running disconnected tools and evaluating whether a dedicated restaurant automation stack can reduce labor costs, food waste, and manual reconciliation time.

Search intent: Evaluation and decision  the reader is not researching what restaurant automation is. They already know they need it. They are deciding what to automate first, what it will actually cost, and whether the ROI justifies the investment.

What you will walk away with: A breakdown of the six core areas of restaurant automation with real pricing data, documented ROI and payback-period benchmarks, a 6-part vendor selection checklist, and a clear decision framework mapped to your restaurant’s location count and operating model.

restaurant automation

Introduction

Labor and food costs together consume 60–71% of revenue at a full-service restaurant before rent is paid. That is not a staffing problem or a menu problem. It is a structural margin problem, and restaurant automation is the structural response.

Twenty-six percent of operators already use AI in daily operations, with adoption accelerating across both independent restaurants and multi-location groups, according to the National Restaurant Association’s State of the Restaurant Industry report. The operators driving that number are not chasing technology. They are protecting margin by removing high-repetition, high-cost tasks from human workflows before those costs compound.

This guide covers what to automate first, what it costs in 2026, and how to calculate return before signing any vendor contract.

What Is Restaurant Automation?

Restaurant automation is the deployment of software, AI, and connected hardware to remove high-repetition, margin-eroding tasks from human workflows across both front-of-house and back-of-house operations. It is not a single platform or product category. It is an operational architecture decision one that determines how labor, inventory, and guest data move through the business without requiring manual intervention at each step.

The distinction that matters for operators: restaurant automation is not about replacing staff. It is about removing the work that consumes management time without producing proportional revenue. It’s a theme we cover in more depth in our breakdown of the restaurant industry’s technology shift.

Front-of-House vs. Back-of-House Automation

Front-of-house automation covers the guest-facing layer: self-ordering kiosks, digital ordering systems, automated reservation management, and guest messaging sequences. Back-of-house automation covers the operational core: inventory management systems, AI-powered scheduling, kitchen display systems, and automated invoice processing.

Both areas deliver ROI. The sequencing of which to address first depends on where your highest-cost inefficiencies currently sit.

The Six Core Areas of Automated Restaurant Operations

restaurant automation

Order Management and POS Integration

Digital ordering systems synced directly to POS eliminate order entry errors, reduce ticket times, and connect online channels without manual input. The integration point between ordering and POS is also the most common failure point in food service automation. Fragmented POS stacks create data gaps that undermine every downstream reporting and scheduling function built on top of them, one of the reasons operators increasingly opt for a custom POS and restaurant management system built around their actual workflow instead of stitching together disconnected tools.

Inventory and Supply Chain Automation

Automated reordering triggered by real-time sales data, stock threshold alerts, and AI-driven demand forecasting removes the guesswork from purchasing. The numbers here are material: automated inventory systems reduce food waste by an average of 26% and over-ordering by 31%, translating to $18,000–$45,000 in annual savings for a typical $1M–$2M revenue restaurant. Food waste reduction at this scale is not incremental, it changes the cost structure of the operation. Much of this depends on connected sensors and real-time data feeds, which is where IoT and smart solutions come in.

AI-Powered Staff Scheduling

Forecasting-based scheduling that pulls from POS history and demand patterns reduces idle labor costs by 15–25%. The secondary benefit is often undervalued: predictable schedules reduce voluntary turnover, which costs an estimated $5,864 per hourly replacement when recruiting, training, and productivity loss are factored in, per Cornell University’s turnover cost research. Platforms like 7shifts and HotSchedules are the category leaders here, though many operators eventually fold scheduling into a broader AI automation consulting engagement so it shares data with inventory and POS.

Kitchen Automation Technology

Kitchen display systems, automated cooking equipment, and smart batching workflows define kitchen automation technology for most operators in 2026. Robotics, like the fry-station systems from Miso Robotics,  is part of this category, but not the starting point. Most operators begin with software-driven kitchen flow improvements, reducing ticket times and error rates before committing to hardware capital expenditure.

Guest Communication and Marketing Automation

Automated SMS sequences, loyalty program triggers, review request flows, and win-back campaigns constitute guest experience automation. Independent and multi-location restaurants using automated guest campaigns see 20–35% higher repeat visit rates compared to those relying on manual outreach. The compounding effect on customer lifetime value is where this category pays back disproportionately, and it’s closely related to the retention gains we’ve seen play out in broader retail and e-commerce digital transformation work.

Finance and Invoice Automation

Automated invoice processing platforms eliminate more than 90% of manual AP coding. The average independent restaurant burns 17 hours per month on invoice reconciliation. Automation reduces that to under 4 hours, freeing management time for decisions that actually require judgment. If this is the function costing you the most time, it’s worth reading our companion piece on the best restaurant accounting software in 2026 before you shortlist vendors.

Where Restaurant Automation Delivers the Fastest Business Impact

Single-Location Operators

Prioritize inventory automation and AI-powered scheduling. These two functions deliver the fastest payback, typically within 60–90 days on software-only platforms with low implementation overhead and no hardware capital requirement. Robotics and complex back-of-house automation should come later, after the software layer is generating measurable returns.

Multi-Location and Chain Operators

Unified restaurant technology solutions become operationally essential beyond three locations. Point solutions that work independently create data silos that slow decision-making and obscure unit-level performance. Forty percent of restaurant operators cite data availability gaps as a major operational issue. The shift in 2026 is toward integrated platforms that consolidate multi-location restaurant management, not toward adding more best-of-breed tools that do not share data, a challenge that overlaps closely with what we solve for clients through enterprise and internal tools development.

Ghost Kitchens and Delivery-First Operations

Automation is native to the ghost kitchen model. Digital ordering systems, automated dispatch, and real-time menu sync across aggregators are table stakes. Margin protection depends on eliminating commission leakage and manual reconciliation across delivery platforms like Olo and Checkmate, both of which automation addresses directly.

Restaurant Automation vs. Manual Operations Side-by-Side Comparison

restaurant automation

Operational AreaManual ProcessAutomated ProcessEfficiency Gain
Inventory Counting15–20 hrs/week Real-time POS-synced tracking75% time reduction
Invoice Processing17 hrs/month, error-proneAuto-coded, ERP-integratedReduced to 4 hrs/month
Staff SchedulingIntuition-based, reactiveForecast-driven, POS-powered15–25% labor cost reduction
Order ManagementManual ticketing, high error rateDigital ordering + KDS syncNear-zero order errors
Guest Re-engagementManual campaigns, low frequencyAutomated triggers based on behavior data20–35% higher repeat visits
Food Waste ManagementNo real-time visibilityThreshold alerts + demand forecasting26% waste reduction

At the P&L level, what this table represents is the difference between a 3–5% net margin and a 7–10% net margin for a mid-market operator running two to five locations. The efficiency gains above are not additive in isolation they compound across the cost structure when the underlying platforms share data.

What Does Restaurant Automation Actually Cost?

Software-Only Platforms

Scheduling tools like 7shifts and When I Work are priced on a per-employee-per-month model. Inventory management platforms start at $200–$400/month for mid-market operators. Marketing automation ranges from $0–$149/month at the entry level to $149–$399/month for full-featured platforms. All-in-one POS bundles from providers like Toast and Square for Restaurants run approximately $69/month per terminal plus hardware, which starts at $799 upfront or is available on lease terms.

The real cost question for most operators is not what each platform costs individually, it is whether to consolidate or continue stacking point solutions. Most operations that have grown organically are over-stacked and under-integrated.

Hardware and Robotics

Kitchen automation hardware, robotic fry stations, self-ordering kiosks, and smart cooking equipment carry capital costs ranging from $15,000 to $125,000 or more per installation. Hardware ROI timelines run 18–36 months, compared to 60–90 days for software-layer automation. Scaling hardware from two or three pilot locations to fifty or more remains an unresolved operational challenge across the industry.

Hidden Costs Operators Miss

  • POS integration fees are not included in base platform pricing
  • Staff retraining hours, which are rarely quantified in vendor proposals
  • API connection costs for non-native integrations
  • Ongoing maintenance and vendor support contracts
  • Data migration from legacy systems

Not sure which automation tier matches your operation? Tibicle helps restaurant operators map the right stack to their margin goals without over-engineering.

ROI Framework Calculating Real Returns on Restaurant Automation Investment

The Three ROI Levers

Food cost reduction through inventory automation typically delivers a 3–8 percentage point improvement in food cost variance. On $1.5M in revenue, a 5% food cost reduction equals $24,750 per year more than the annual cost of most platforms in this category.

Labor efficiency from scheduling automation reduces idle labor by 15–25%. A single understaffed peak shift costs $400–$1,200 in lost table turns. Multiply that across a year and the lost revenue from reactive scheduling becomes significant.

Revenue recovery is the lever most operators ignore. Fifteen to twenty percent of inbound calls go unanswered during peak hours. Voice AI and automated communication systems the kind we build through AI integration and automation capture this lost revenue without adding headcount.

Payback Period by Automation Type

Automation CategoryAvg. Annual SavingsTypical Platform CostPayback Period
Inventory management$18,000–$45,000$2,400–$4,800/yr30–90 days
Scheduling automation$12,000–$30,000$1,800–$3,600/yr45–90 days
Invoice/AP automation$8,000–$15,000$3,000–$6,000/yr90–120 days
Marketing automation$10,000–$25,000 $1,800–$4,800/yr60–90 days

What ROI Is Not

ROI from restaurant automation is not only cost-cutting. It includes revenue that was never earned because phones went unanswered, tables turned slowly, or repeat guests lapsed without a re-engagement trigger. Operators who calculate only labor savings are underestimating total return by 30–50%.

Implementation Risks Operators Underestimate

Integration Fragmentation

The most common failure mode in restaurant technology rollouts is buying platforms that do not connect. Without a unified data architecture, AI-powered scheduling and inventory tools become disconnected additions layered onto the same operational gaps they were meant to close. Choose vendors with robust API documentation and named integration partners for your existing POS, not just a general mention of API availability.

Staff Adoption and Change Resistance

Automation rollouts fail at the floor level when staff are not trained or are not bought into the change. The operators who see the fastest gains frame automation as workload relief, not headcount reduction. Implementation must include structured training before go-live, not just a vendor onboarding call after the contract is signed.

Scaling Hardware Before Software Is Proven

Early robotics pilots at 2–13 locations rarely scale predictably to 200 or more units. Operators should not commit hardware CapEx until software-layer automation is generating measurable and consistent returns. The sequence matters: software first, hardware second.

Cybersecurity and System Downtime Exposure

A crashed POS system during a Friday dinner service can cost three hours of revenue and trigger guest walkouts that do not come back. Multi-cloud redundancy and system failover planning are no longer optional considerations for operators running five or more locations this is exactly what our 24/7 monitoring and support service is built to prevent.

Vendor Selection Checklist for Restaurant Automation

Before committing to any restaurant management software or automation platform, evaluate against these criteria:

Integration Depth

  • Native integration with your current POS, not just API mention
  • Named integration partners that are listed and independently verifiable

Scalability

  • Pricing model that works at one location and at twenty or more
  • Multi-location management dashboard included in base plan, not treated as an add-on

Data Ownership

  • You own your guest and operational data upon exit
  • Full export functionality without vendor lock-in

Support and Implementation

  • Dedicated onboarding support beyond documentation
  • SLA commitments for uptime and issue resolution

ROI Transparency

  • Vendor provides performance benchmarks, not just feature comparisons
  • Reference customers in your specific segment same size, format, and location count

Contract Terms

  • Month-to-month or short-term contracts available for the initial phase
  • Clear, complete pricing, no undisclosed processing fees or hardware lease traps

Top Restaurant Automation Tools by Category (2026)

Tools by Category

CategoryLeading PlatformsBest For
All-in-One POS + OpsToast, Square for RestaurantsFull-service, QSR, chains
Inventory AutomationMarketMan, MarginEdge, ApicbaseCOGS tracking, enterprise chains
Scheduling7shifts, HotSchedules, When I WorkMulti-location shift management
Guest EngagementSevenRooms, Popmenu, FishbowlLoyalty, CRM, retention automation
Invoice/AP AutomationOttimate (formerly Plate IQ), MarginEdgeInvoice digitization, ERP integration
Kitchen AutomationMiso Robotics, BrightpearlQSR, high-volume BOH
Delivery OptimizationCheckmate, OloOmnichannel ordering, delivery aggregation

2026 is the year operators are consolidating stacks. The movement is away from accumulating point solutions that operate independently and toward fewer platforms that integrate deeply across the operational layer. The number of tools matters less than whether they share data.

Why Tibicle Is a Strong Choice for Restaurant Automation Implementation

Automation Implementation

Restaurant automation requires more than buying the right software. The gap between a platform’s feature list and its actual operational performance is where most implementations stall and where the ROI projections in vendor proposals fail to materialize.

Tibicle works with food service operators to close that gap: scoping the right automation tier for current revenue and operational complexity, managing vendor integration, and ensuring staff adoption before handoff. For restaurant groups managing multiple locations or evaluating a first automation investment, the approach is grounded in business impact first and technology selection second  the same philosophy behind our restaurant management system and custom POS development work.

If you’re evaluating your first automation stack or auditing an existing one, contact Tibicle to schedule a working session.

Conclusion

Restaurant automation is not a technology decision. It is a marginal decision. Operators who sequence it correctly  software before hardware, high-ROI functions first, integrated platforms over disconnected point solutions recover costs in weeks, not years.

The operators who stall are not those who moved too slowly on robotics. They are the ones still running fragmented systems while competitors operate with real-time visibility into labor, inventory, and guest behavior. The stack you build in 2026 will determine whether your margins are recoverable in 2027.

Talk to Tibicle about building your restaurant automation roadmap.

FAQs

What is the fastest-ROI area of restaurant automation?
Inventory management and scheduling automation consistently return investment within 60–90 days for software-based platforms. These two functions also carry the lowest implementation risk and require no hardware capital.

Can small restaurants afford  restaurant automation?
Yes. Cloud-based platforms start at $149–$400/month and scale with the business. Most independent operators see payback before month three, particularly when inventory or scheduling inefficiencies are the primary margin leak.

What is the biggest mistake operators make when implementing restaurant automation?
Buying platforms that do not integrate with their existing POS creates data silos that eliminate the efficiency gains the software was purchased to deliver. Working with a partner who handles restaurant management system and custom POS development end-to-end avoids this trap.

Is restaurant robotics worth the investment in 2026?
For most operators, not yet. Robotics capital costs are high, scaling beyond pilot locations is unproven, and software-layer automation still offers faster and lower-risk returns across every major cost category.

How do I know if my restaurant is ready to automate?
If labor and food costs together exceed 60% of revenue and you lack real-time visibility into either, the case for automation is already clear. The question is not whether to start, it is which function to address first.

Top 7 Restaurant Management Software for ROI in 2026

What This Guide Covers

Who this is for: Restaurant operators, multi-location F&B group owners, and operations decision-makers who are actively evaluating restaurant management software platforms for 2026 and need a procurement-grade comparison built on ROI data, not feature lists or vendor marketing.

Search intent: Comparison and vendor selection, the reader is not learning what restaurant operations software does. They are shortlisting platforms, trying to understand which one fits their location count and operational profile, and looking for the cost and ROI numbers to defend the decision internally before signing a contract.

What you will walk away with: A ranked comparison of the top 7 restaurant management software platforms by documented business impact, a full pricing breakdown across all three tiers including hidden Year-2 costs, an ROI calculation framework tied to food cost reduction and labor cost optimization, a 12-question vendor checklist, and a payback period model by platform category, so you sign the right contract the first time.

restaurant management software

Introduction

Restaurant net profit margins sit between 3% and 5% (National Restaurant Association, 2025), while labor costs consume up to 35% of revenue (Black Box Intelligence, 2025). With food cost volatility adding further pressure, the margin for operational error is essentially zero. The only sustainable lever left for operators is technology that replaces manual overhead with real-time data. This guide is a procurement-grade comparison not a product listing built for operators evaluating platforms based on one primary filter: measurable ROI. It covers what the software category actually does, where the returns come from, how to read vendor pricing, and which of the seven leading platforms fits which operator profile.

What Does Restaurant Management Software Actually Do And What It Doesn’t?

restaurant management software

Restaurant management software is not a category defined by features. It is defined by a specific problem: front-of-house and back-of-house operations generate data in silos, and those silos produce waste. A POS system records sales. An inventory sheet records stock. A scheduling tool records shifts. Without a unified operational layer connecting them, operators make decisions on lagging, incomplete information.

Restaurant management software solves for that gap. At its best, it creates a single data layer where sales data informs purchasing decisions, labor schedules adjust to forecast demand, and food cost variance is visible in near real-time not at month-end.

What it does not do: it does not replace operator judgment, it does not fix a broken menu cost structure, and it does not compensate for staff training failures. It amplifies what is already working. Operators evaluating platforms need to start with that framing.

What Core Module Does Restaurant Management Software Need to Include?

The modules that generate documented ROI for restaurant operations are:

  • POS and payments: transaction capture, tender type, table-level tracking
  • Food cost tracking and recipe costing: theoretical vs. actual cost comparison per dish
  • Inventory management and supplier ordering: real-time stock levels, automated purchase orders
  • Labor scheduling with cost forecasting: shift creation tied to projected revenue
  • Reporting and analytics dashboard: consolidated P&L, food cost %, labor cost % by location

Anything outside these five modules: loyalty apps, reservation widgets, gift card tools generates value only after the core operational layer is producing clean data.

All-in-One Restaurant Operations Software vs. Best-of-Breed Stack — The Real Trade-Off

All-in-one platforms (Toast, Lightspeed) simplify vendor management, reduce integration risk, and lower implementation time. The trade-off: they may underdeliver on specialized functions like food cost analysis or labor compliance compared to dedicated tools.

Best-of-breed stacks (MarginEdge for food cost + 7shifts for scheduling + a separate POS) maximize function per category but require API management, duplicate data entry risk, and higher integration maintenance overhead.

Single-location operators with limited IT resources typically fit all-in-one. Multi-location groups above 5 units increasingly build best-of-breed stacks with a consolidated reporting layer on top.

What Separates High-ROI Platforms from Expensive Overhead?

restaurant management software

Not all restaurant management software generates returns at the same rate. The platforms that produce documented ROI share four operational characteristics and the ones that drain budgets typically lack at least two of them.

What Are the 4 Signals That Predict Restaurant Management Software ROI?

  1. POS-to-inventory sync The actual vs. theoretical food cost gap is the clearest indicator of waste. Platforms that sync POS sales data to inventory depletion in real time allow operators to identify variance daily rather than weekly. A 2-percentage-point reduction in food cost on a $40,000/month food spend is $800/month recovered.
  2. Labor cost as a % of sales, visible in real time Platforms that surface labor cost as a live percentage not just total hours allow managers to cut shifts before the cost compounds. This is the single most actionable metric for floor managers making real-time decisions.
  3. Automated purchase order workflows Manual ordering introduces two failure points: over-ordering (tied capital, spoilage) and under-ordering (stockouts, menu gaps). Automated PO workflows based on par levels and sales velocity eliminate both.
  4. Multi-location consolidated reporting For operators running more than two units, the management time cost of reconciling separate reporting environments is typically 5–10 hours per week. Consolidated dashboards eliminate that overhead at scale. (Restaurant365 ROI Data, 2025)

When Does Low-Cost Restaurant Operations Software Actually Cost More?

Manual entry overhead on free or entry-tier plans can outpace subscription cost within 90 days at scale. (Lightspeed Restaurant Industry Report, 2025) The hidden cost structure includes:

  • Implementation fees: not reflected in monthly pricing; can reach $2,000–$10,000 for enterprise deployments
  • Per-location add-ons: flat pricing that becomes variable as units scale
  • API overage charges: triggered when integration call volumes exceed base plan limits
  • Support tier restrictions: emergency and after-hours support often locked behind premium tiers

Operators comparing monthly subscription rates without modeling total cost of ownership over 24 months are comparing the wrong number.

Top 7 Restaurant Management Software Ranked by Business Impact

The platforms below are ranked on five criteria: documented ROI outcomes, pricing transparency, POS integration depth, scalability across multiple locations, and real operator results not vendor marketing claims. Each platform has a documented use case where it outperforms the others.

1. Toast POS

Best for: Full-service and QSR operators in the US seeking an all-in-one ecosystem.

Toast runs on Android-based terminals with a free Starter plan entry point, making it accessible for early-stage operators. Its modular architecture allows operators to add online ordering, payroll, loyalty programs, and handheld ordering devices as the business scales. The POS, payments, and back-of-house reporting are native no third-party API required.

Watch out for: Toast is US-centric. Operators with international locations will need a separate solution. Hardware contracts can include lock-in terms that complicate future platform migrations.

2. Restaurant365

Best for: Multi-unit groups needing consolidated back-office financials.

Restaurant365 covers inventory, accounting, labor, and operations in one cloud-based restaurant platform. Its real-time P&L by location is the most cited feature among multi-location operators finance teams can close monthly books in hours rather than days. It integrates with over 50 POS systems.

Watch out for: Implementation costs range from $2,000 to $10,000 or more depending on unit count and data migration complexity. Pricing is enterprise-tier and custom-quoted. Not built for single-location operators.

3. MarginEdge

Best for: Operators prioritizing food cost visibility without a full platform switch.

MarginEdge connects directly to your existing POS and processes invoices automatically, producing a near real-time P&L tied to actual food purchases. Its flat-fee pricing of approximately $330/month makes cost modeling straightforward. For operators who already have a functioning POS and scheduling tool, MarginEdge adds the food cost management layer without requiring a full stack replacement.

Watch out for: MarginEdge is not a POS replacement and does not include labor scheduling. It works best as a specialized layer in a best-of-breed stack, not as a standalone all-in-one.

4. 7shifts

Best for: Restaurants with complex shift patterns and labor compliance requirements.

7shifts produces schedules with 95% labor accuracy by connecting historical sales data with forecasted demand. (7shifts Product Documentation, 2025) Its POS-linked labor cost forecasting allows managers to see the cost impact of scheduling decisions before they publish shifts. Team communication tools reduce no-show rates and shift swap friction.

Watch out for: 7shifts scheduling logic is US-centric and may require configuration adjustment for international compliance frameworks. Outside core scheduling and labor cost management, functionality is limited.

5. MarketMan

Best for: Multi-location operators managing food cost and supplier ordering centrally.

MarketMan covers recipe costing, real-time inventory tracking for restaurants, and supplier order automation in one platform. Operators can set par levels and trigger automated purchase orders, reducing over-ordering and stockout risk across locations. Food cost analysis reports allow operations teams to identify high-variance menu items before they impact monthly margins.

Watch out for: Mid-tier pricing of $200–$400/month becomes relevant only with POS integration. Without a connected POS, inventory depletion tracking requires manual entry, which offsets the efficiency gain.

6. Lightspeed Restaurant

Best for: International or multi-region restaurant brands.

Lightspeed operates across Europe, Canada, and APAC with multi-currency and multi-region POS coverage. Integrated payments and reservation management reduce the number of third-party vendors for operators running across jurisdictions. It is the clearest choice for brands that need consistent POS infrastructure across markets.

Watch out for: In US-only deployments, Lightspeed is less specialized than Toast. Operators concentrated in the US market with no international expansion plans will find fewer reasons to prefer it over domestic alternatives.

7. SevenRooms

Best for: Full-service restaurants prioritizing guest CRM and reservation-driven revenue.

SevenRooms is a guest data platform, not a POS or back-of-house tool. It captures reservation data, builds guest profiles, automates loyalty triggers, and personalizes outreach to drive repeat visits. Restaurant analytics dashboards within SevenRooms show repeat-visit rates, average spend per guest, and campaign attribution.

Watch out for: SevenRooms sits as a CRM layer above a POS it does not replace one. Operators evaluating SevenRooms should already have a functioning POS and operational stack before adding a guest intelligence layer.

Side-by-Side Comparison: Restaurant Management Software at a Glance

PlatformBest ForCore StrengthPricing RangePOS IntegrationMulti-Location
Toast POSQSR + Full-ServiceAll-in-one ecosystemFree–$165+/moNativeYes
Restaurant365Enterprise groupsBack-office financialsCustom quote50+ integrationsYes
MarginEdgeFood cost controlReal-time P&L~$330/mo flatPOS-nativeLimited
7shiftsLabor schedulingLabor cost accuracy$29–$135+/moPOS-linkedYes
MarketManInventory/procurementRecipe + supplier mgmt$200–$400/moVia APIYes
LightspeedInternational operatorsMulti-region POSCustomNativeYes
SevenRoomsGuest CRMReservation + loyaltyCustom quotePOS layerYes

Not sure which platform fits your operation? Tibicle LLP’s technology advisory team can run a fit analysis based on your location count, current stack, and margin targets. Book a consultation →

What Does Restaurant Management Software Actually Cost in 2026?

Software pricing in this category is structured across three tiers, and the monthly subscription number operators see during demos rarely reflects what they pay in Year 2 or Year 3. Understanding the full cost structure before shortlisting is non-negotiable.

What Are the 3 Pricing Tiers for Restaurant Management Software in 2026?

Entry tier ($0–$50/month) Basic POS functionality or limited inventory tracking. Suitable for single-location operators in early stages. The visible cost is low; the hidden cost is manual data entry time. At 10 hours/week of manual entry across one location, the labor cost of the “free” plan often exceeds a mid-tier subscription within 60 days.

Mid-tier ($100–$400/month) Covers food cost tracking, scheduling, inventory management for restaurants, or guest CRM. Most mid-market operators in the 1–5 location range operate at this tier. Pricing is usually per-location or flat-fee depending on the vendor.

Enterprise ($500+/month, often custom) Full back-of-house management, multi-location consolidated reporting, compliance management, and dedicated implementation resources. Expect onboarding fees of $2,000–$10,000 or more. Total cost of ownership over 24 months is the right number to compare, not the monthly rate.

What Pricing Red Flags Do Operators Miss Before Signing?

  • Per-location add-on fees that compound with scale a $150/month base rate becomes $750/month across five locations
  • Hardware lock-in on proprietary terminals switching platforms later requires writing off existing hardware investment
  • API overage charges on integrations triggered when call volumes exceed plan limits, particularly relevant in best-of-breed stacks
  • Support tier restrictions emergency and after-hours support locked behind premium plans creates operational risk for evening and weekend service
  • Year-2 budget blowouts from compliance add-ons, new module releases priced separately, or renegotiated contract terms

ROI Benchmarks: What Operators Actually See After Implementation

Implementation

The return on restaurant operations software is documented across four categories. The figures below reflect outcomes reported by platform providers and corroborated by independent operator case studies. (Technomic Restaurant Technology Survey, 2025)

Where Does Restaurant Management Software Generate Measurable Returns?

Food cost reduction Platforms with real-time POS-to-inventory sync consistently reduce food cost variance by 2–4 percentage points. For a restaurant spending $30,000/month on food, a 3-point reduction recovers $900/month.

Labor savings Restaurant scheduling software with POS-linked forecasting cuts excess labor spend by 5–15% within 90 days of implementation. (7shifts Labor Efficiency Report, 2025) On a $15,000/month labor budget, an 8% reduction generates $1,200/month in savings.

Repeat revenue Guest CRM platforms drive 15–25% higher repeat-visit rates compared to walk-in reliance alone. For full-service restaurants where repeat guests represent 30–40% of covers, this is a direct top-line impact.

Management time Consolidated reporting for restaurants eliminates 5–10 hours per week of manual back-office reconciliation per location. At a manager cost of $25/hour, that is $500–$1,000/month per location recovered as productive time.

What Is the ROI Calculation Framework Before You Buy?

Use this formula before finalizing any vendor shortlist:

(Monthly labor savings + food cost reduction + revenue uplift from loyalty) − (subscription cost + implementation cost amortized over 12 months) = net ROI per location

For a 3-location group spending $8,000/month on food and $12,000/month on labor: a 3% food cost reduction generates $720/month in savings. An 8% labor efficiency gain generates $2,880/month. Combined: $3,600/month in operational savings across three locations. Most mid-tier subscriptions break even within 60–90 days on that math.

What Is the Payback Period by Platform Category?

  • Restaurant scheduling software: typically 30–60 days
  • Food cost platforms: 60–90 days
  • Full back-office suites: 6–12 months, with returns compounding at scale as multi-location reporting replaces manual reconciliation

Risks and Implementation Pitfalls That Derail Restaurant Tech Investments

 Investments
Buying the right platform is step one. Implementing it successfully is where most projects fail. The failure modes are documented and repeatable which means they are also avoidable.

What Are the 5 Reasons Restaurant Software Implementations Fail?

  1. Staff adoption gaps: platforms chosen without frontline input from servers, kitchen staff, and floor managers get abandoned within 60–90 days. The team that uses the software daily needs to be part of the selection process.
  2. Integration mismatches: restaurant operations software that does not sync cleanly with your existing POS creates duplicate data entry, which eliminates the efficiency gain entirely.
  3. Underestimated implementation timelines: multi-location rollouts consistently take 3–6 times longer than vendor projections. Budget for it.
  4. Data migration failures: historical inventory data, recipe costing records, and supplier pricing not transferred cleanly to the new platform requires rebuilding from scratch, which delays time-to-value by months.
  5. Scope creep post-contract: adding modules at per-unit rates after signing balloons total cost of ownership beyond what the initial ROI model projected.

How Do You De-Risk the Buying Decision?

  • Demand a full cost breakdown including Year-2 and Year-3 projections before signing
  • Run a pilot on 1–2 locations before committing to an enterprise rollout
  • Verify integration compatibility with your current POS system before shortlisting not after

Vendor Selection Checklist for Restaurant Operators

Use this as a decision filter before finalizing any vendor shortlist. These are the questions that surface cost, fit, and risk factors that standard demos do not cover.

12 Questions to Ask Every Vendor Before You Sign

Operational fit

  1. Does it integrate natively with your existing POS, or via a third-party API?
  2. Does it support your current location count and your 12-month expansion plan?
  3. Can it handle multi-currency or multi-region operations if needed?

Total cost of ownership

  1. What are the implementation and onboarding fees itemized?
  2. Are per-location add-ons included in the quoted price or billed separately at scale?
  3. What does Year-2 pricing look like after the initial contract period?

Data and reporting

  1. Does it produce real-time food cost and labor cost reports tied to POS data?
  2. Can it consolidate multi-location reporting into a single restaurant analytics dashboard?

Support and adoption

  1. What is the SLA for critical support issues during service hours?
  2. Is onboarding and staff training included or a paid add-on?

Risk management

  1. What are the contract exit terms and hardware return policy?
  2. Does the platform have documented uptime SLAs and data security certifications?

Why Tibicle LLP Is Worth Evaluating for Restaurant Software Implementation

Tibicle LLP is not a software vendor. It is a technology partner that helps restaurant operators navigate the buying and implementation decision before committing budget to a platform that may not fit.

The risk operators face without external advisory support: shortlisting a platform based on a surface-level feature comparison, signing a 24-month contract, and discovering integration gaps or hidden costs three months into rollout. That scenario represents 6–12 months of sunk cost, interrupted operations, and a staff team that has lost confidence in the technology initiative.

Tibicle’s advisory work covers three areas directly relevant to this decision: fit analysis against your current tech stack and location structure, POS integration scoping to identify compatibility risks before they surface post-contract, and phased rollout strategy for multi-location groups that need to maintain operational continuity during implementation. The team has experience with multi-location hospitality tech stacks, custom POS integrations, and ROI modeling for operators at different stages of growth.

Speak to Tibicle’s restaurant technology team before you finalize your vendor shortlist. Schedule a fit review

Conclusion

The right restaurant management software is not the most feature-rich option on the market. It is the platform that integrates cleanly with your existing POS, delivers measurable improvement to food cost and labor efficiency, and scales without compounding your cost structure as you add locations. Use the vendor checklist above as the primary filter before any shortlist conversation surfaces the questions that demos are designed to avoid. The comparison table gives you the category fit. The ROI framework gives you the number to model before signing.

Ready to identify which platform fits your locations, stack, and ROI targets? Tibicle LLP’s advisory team works with restaurant operators at every stage. Get your free assessment

Frequently Asked Questions

What is the best restaurant management software for multi-location operators in 2026?
Restaurant365 and Toast POS are the strongest options for multi-location groups. Restaurant365 leads on back-office financial consolidation real-time P&L by location, accounting integration, and consolidated labor management. Toast leads on unified front-of-house and POS operations with a modular add-on structure that scales with unit count.

How much does restaurant management software cost per month?
Pricing ranges from $0 for basic entry-tier tools to $500 or more per month for enterprise platforms. Mid-tier options covering food cost tracking, scheduling, and inventory management typically run $100–$400/month per location, excluding implementation fees and hardware costs.

How long does it take to see ROI from restaurant management software?
Scheduling and labor tools typically show measurable returns within 30–60 days. Food cost platforms average 60–90 days to payback. Full back-office suite ROI compounds over 6–12 months, particularly for multi-location groups where consolidated reporting reduces management overhead at scale.

What is the difference between a POS system and restaurant management software?
A POS handles transaction capture and payment processing. Restaurant management software integrates POS data with inventory levels, labor schedules, food cost tracking, and reporting into an operational layer that supports business decisions not just transaction records.

What are the biggest risks when implementing restaurant software?
Staff adoption failures, POS integration mismatches, underestimated rollout timelines, and hidden Year-2 costs are the four most common implementation pitfalls. Operators who pilot on 1–2 locations before an enterprise rollout consistently report faster adoption and lower total cost of ownership.

Do I need separate tools for scheduling, inventory, and POS or one platform?
It depends on scale. Single-location operators typically benefit from an all-in-one platform that reduces integration complexity. Multi-location groups above five units increasingly use a best-of-breed stack specialized tools for food cost, labor scheduling, and inventory with one consolidated reporting layer connecting them.

Minimum Viable Product (MVP) App Development: A Full Guide

Introduction

According to CB Insights, approximately 42% of startups fail because they build products that nobody wants. MVP app development helps founders spend months developing features, hiring teams, and investing heavily in marketing before validating whether a real market exists for their solution.

mvp app development

At the same time, the global MVP development market is projected to reach between $541 million and $569 million by 2031, growing at an estimated CAGR of 8.7–9.5%. This growth reflects a significant shift in how businesses approach software development. Instead of committing hundreds of thousands of dollars to full-scale products, organizations increasingly rely on MVP app development to validate demand before making major investments.

Building a complete software platform without validation can easily consume $250,000–$500,000 in development costs. For founders, product leaders, and innovation teams, this creates unnecessary financial risk and delays critical market feedback.

What Is MVP App Development (And What It Is Not)

It is the process of building a functional product with only the essential features required to solve a specific customer problem and validate market demand.

The objective is not to launch an incomplete product. The objective is to collect real-world feedback, test assumptions, and measure customer behavior before committing substantial resources to a full-scale build.

A successful minimum viable product for startups focuses on learning rather than feature completeness. Instead of building everything at once, teams launch a smaller version that delivers the core value proposition while generating measurable business insights.

This approach follows the principles of the lean startup methodology, where learning speed is often more valuable than feature volume.

MVP vs. Prototype vs. Beta: A Functional Distinction

Many teams mistakenly use MVP, prototype, and beta interchangeably. In practice, these represent different stages of product development and serve completely different business objectives.

StagePurposeUser AccessFunctionality
PrototypeValidate concepts and designInternal stakeholdersLimited or non-functional
MVPValidate market demandReal usersFunctional core product
BetaTest before full launchSelected external usersBroad feature set

A prototype helps teams evaluate user flows and design assumptions. An MVP helps validate whether users actually want the product. A beta release focuses on refinement before a wider launch.

Understanding this distinction prevents companies from allocating budgets incorrectly and building products that solve the wrong problem.

Why the Definition Matters for Budget Allocation

One of the most common reasons MVP initiatives fail is that stakeholders treat them as smaller versions of a final product rather than validation tools.

Once additional features start entering the roadmap, development timelines expand, budgets increase, and learning cycles slow down. Industry research suggests that approximately 60–70% of MVP projects exceed their original schedules due to uncontrolled feature expansion.

This is why every successful MVP relies on a disciplined feature prioritization framework. The goal is to identify the smallest set of features required to test business assumptions and gather meaningful user data.

Organizations that maintain strict scope control generally reach validation milestones faster and at significantly lower cost.

Why MVP App Development Is a Business Strategy, Not a Technical Shortcut

Many founders assume MVP app development exists primarily to reduce engineering expenses. While lower development costs are certainly a benefit, the true value of an MVP is strategic rather than technical.

An MVP is fundamentally a business validation framework. It allows organizations to test demand, evaluate user behavior, and measure market interest before investing heavily in product expansion, infrastructure, and operational growth.

The companies that succeed are not always the ones that build the fastest. They are often the ones who learn the fastest.

Market Validation Before Capital Commitment

Launching a full-scale product without validation remains one of the biggest financial risks in software development.

Startups using MVP strategies report significantly higher success rates because they test assumptions before making long-term commitments. Investors have also shifted expectations. Nearly 70% of seed-stage investors now prefer companies that can demonstrate market traction rather than relying solely on product concepts.

A properly executed MVP generates measurable signals such as:

  • Customer acquisition data
  • User engagement metrics
  • Retention performance
  • Revenue validation
  • Product-market fit indicators

These metrics provide evidence that demand exists before significant capital is deployed.

Speed-to-Market as a Competitive Lever

Traditional software products often require 12–18 months of development before reaching users. By contrast, most MVP initiatives launch within 8–16 weeks, depending on complexity and scope.
This shorter timeline allows organizations to:

  • Validate ideas faster
  • Reach customers sooner
  • Gather competitive intelligence
  • Reduce opportunity costs
  • Improve decision-making speed

Research shows that companies performing product-market fit validation within the first month of launch are significantly more likely to identify sustainable growth opportunities than organizations that spend a year building before collecting user feedback.

An MVP is not designed to be the final product. It is designed to create a rapid learning cycle that informs future development decisions and reduces business risk.

Step-by-Step MVP App Development Process

mvp app development

A successful MVP is not created by simply removing features from a larger product vision. Effective MVP follows a structured process designed to validate assumptions, reduce risk, and maximize learning.

Organizations that skip discovery, prioritization, or validation stages often end up rebuilding products after launch, significantly increasing costs and delaying growth.

Problem Definition and Audience Analysis

Every successful MVP starts with a clearly defined problem.

Before writing code, teams should identify:

  • The specific customer pain point
  • The target audience
  • Existing alternatives in the market
  • The core value proposition

The goal is not to build features. The goal is to understand what problem users are willing to pay to solve.

This stage often includes market research, competitor analysis, customer interviews, and validation workshops. Organizations that invest time here generally avoid building features that customers never use.

Feature Prioritization Using MoSCoW and RICE Frameworks

One of the biggest challenges in MVP is deciding what not to build.

Two widely adopted prioritization frameworks include:

MoSCoW Method

  • Must Have
  • Should Have
  • Could Have
  • Won’t Have

The MoSCoW method helps teams focus on features that directly support validation goals while postponing lower-priority functionality.

RICE Framework

  • Reach
  • Impact
  • Confidence
  • Effort

The RICE framework helps product teams quantify feature value and prioritize development efforts based on measurable business outcomes.

Most successful MVPs launch with only 20–30% of the functionality originally proposed during planning.

Tech Stack Selection for Scalability

Technology decisions made during MVP development often influence long-term product scalability.

While the goal is rapid validation, teams should avoid selecting technologies that create expensive migration challenges later.

Common considerations include:

  • Frontend framework selection
  • Backend architecture
  • Database scalability
  • Cloud infrastructure
  • Security requirements
  • Third-party integrations

Many modern products adopt an API-first architecture, allowing future mobile apps, web applications, and integrations to share the same backend infrastructure.

This approach improves flexibility and reduces redevelopment costs as products evolve.

Agile MVP App Development Sprint Execution and QA

Once requirements are finalized, development typically moves into sprint-based execution.

An agile MVP sprint model enables teams to deliver features incrementally while maintaining stakeholder visibility throughout development.

Most MVP projects use:

  • 1–2 week sprint cycles
  • Continuous stakeholder reviews
  • Incremental testing
  • Ongoing backlog refinement

Quality assurance should occur throughout development rather than after development ends.

A common misconception is that MVPs can sacrifice quality because they are “minimum” products. In reality, poor user experiences generate misleading feedback and reduce the value of validation efforts.

Launch, Measure, and Iterate

Launching the MVP is not the end of the process.

It is the beginning.

The most valuable insights often emerge after users start interacting with the product.

Teams should establish metrics for:

  • User acquisition
  • Feature engagement
  • Retention
  • Conversion
  • Customer satisfaction

This creates a continuous user feedback loop that guides future product decisions.

The most successful MVP initiatives rely on post-launch iteration rather than attempting to predict every requirement before launch

MVP App Development Cost Breakdown (2026 Benchmarks)

mvp app development

One of the most common questions founders ask is:

“How much does MVP cost?”

The answer depends on product complexity, industry requirements, technical architecture, and development approach.

Understanding realistic cost benchmarks helps organizations avoid underbudgeting and vendor misalignment.

Cost by Complexity Tier

MVP TypeCost RangeTimeline
Simple (Landing Page + CRUD)$10,000–$30,0005–8 Weeks
Standard SaaS Product$55,000–$140,0008–14 Weeks
AI-Powered MVP$140,000–$300,000+3–6 Months
Enterprise / Compliance Heavy$200,000–$500,000+4–6 Months

Simple MVPs focus on validation and user acquisition.

Standard SaaS MVPs include user authentication, subscription workflows, dashboards, and reporting.

AI-powered products require model integration, training infrastructure, and additional testing.

Enterprise MVPs often include security, compliance, and integration requirements that increase both cost and complexity.

Hidden Costs Most Vendors Don’t Mention

The quoted development cost is rarely the complete investment.

Many organizations overlook expenses such as:

  • Discovery workshops
  • Product strategy sessions
  • Third-party APIs
  • Cloud infrastructure
  • Security testing
  • Compliance requirements
  • Analytics tools
  • Ongoing support

Discovery phases alone frequently cost between $2,000 and $10,000 depending on project scope.

Compliance requirements such as GDPR, HIPAA, or industry-specific regulations can add $25,000–$75,000 to overall project budgets.

Organizations should also allocate resources for post-launch iteration, as user feedback often drives significant product adjustments after launch.

Cost by Development Approach (Custom vs. No-Code vs. Hybrid)

The chosen development methodology has a significant impact on overall cost.

Custom Development

  • Highest flexibility
  • Best scalability
  • Highest upfront investment

No-Code MVP

A no-code mvp can reduce development expenses by up to five times compared to custom development.

Benefits include:

  • Rapid deployment
  • Lower validation costs
  • Reduced engineering effort

However, scalability and customization options are often limited.

Hybrid Development

Hybrid approaches combine low-code platforms with custom development components.

This strategy balances speed, flexibility, and long-term scalability while reducing initial investment requirements.

Industry analysts predict that nearly 70% of new applications will involve low-code or no-code technologies by 2026, making hybrid development increasingly attractive for validation-focused products.

ROI of MVP App Development: Where Returns Actually Show Up

ROI of MVP

The value of an MVP is not measured solely by development cost savings.

The primary return comes from reducing uncertainty before committing substantial resources.

Avoided Sunk Cost on Unvalidated Products

Many failed software products consume hundreds of thousands of dollars before teams realize there is insufficient market demand.

The average failed SaaS initiative can burn between $250,000 and $500,000 before meaningful customer validation occurs.

An MVP provides an early go/no-go signal, helping organizations identify whether additional investment is justified.

Even a failed MVP can create value by preventing significantly larger financial losses.

Investor Conversion and Valuation Engineering

Investors increasingly favor products with measurable traction rather than purely conceptual business plans.

Companies that bootstrap to $50,000–$100,000 in annual recurring revenue before fundraising often achieve significantly stronger valuations than businesses raising capital with only prototypes or pitch decks.

An MVP demonstrates:

  • Market demand
  • Customer interest
  • Revenue potential
  • Product viability

This makes fundraising conversations more data-driven and significantly less speculative.

Lower Post-Launch Churn

Products built around assumptions frequently struggle with adoption and retention.

MVP-driven development uses real customer behavior to guide product evolution.

As a result, teams make decisions based on evidence rather than internal opinions.

Continuous customer validation and structured feedback collection often reduce churn while improving retention, engagement, and overall customer satisfaction.

Organizations that actively iterate based on customer behavior typically build stronger products than teams that attempt to perfect every feature before launch.

MVP App Development Approaches Compared

There is no single development approach that works for every business. The ideal strategy depends on budget, validation goals, scalability requirements, and time-to-market expectations.

Custom Build vs. No-Code vs. Hybrid vs. Pre-Built

FactorCustom BuildNo-CodeHybridPre-Built
Cost$50K–$150K$5K–$15K$25K–$50K$10K–$40K
Timeline4–6 Months2–4 Weeks8–12 Weeks2–4 Weeks
ScalabilityHighLimitedModerateModerate
CustomizationHighLimitedStrongLimited
MaintenanceFlexiblePlatform DependentModerateVendor Dependent
Best ForNovel InnovationQuick ValidationModerate CustomizationProven Business Models

Custom development provides maximum flexibility but requires larger upfront investments.

No-code platforms enable rapid validation at significantly lower costs, making them attractive for early-stage founders testing demand.

Hybrid development combines custom engineering with low-code acceleration tools, often providing the best balance between speed and scalability.

Pre-built solutions work well when businesses are entering proven markets and can adapt existing frameworks rather than creating entirely new products.

Industries Where MVP App Development Delivers the Highest ROI

Certain industries benefit more from MVP strategies because market validation significantly reduces risk before major investments are made.

Fintech and Digital Lending

Fintech products often involve regulatory requirements, customer trust concerns, and complex financial workflows.

Launching an MVP enables organizations to validate:

  • Lending demand
  • User acquisition costs
  • Transaction behavior
  • Retention patterns

before investing heavily in compliance infrastructure and enterprise-grade systems.

Healthtech and Remote Patient Monitoring

Healthcare solutions require extensive validation due to strict compliance requirements and high development costs.

MVPs help healthcare innovators test:

  • Patient adoption
  • Provider engagement
  • Monitoring workflows
  • Operational feasibility

before expanding into broader healthcare ecosystems.

EdTech and Competency Platforms

Education technology products often depend on user engagement and learning outcomes.

MVP development helps teams validate:

  • Course completion rates
  • Student engagement
  • Subscription willingness
  • Content effectiveness

before scaling content production and platform capabilities.

PropTech

Among startup sectors, PropTech consistently demonstrates strong MVP performance.

Industry research suggests PropTech startups achieve some of the highest MVP-to-Series A conversion rates because property marketplaces, tenant services, and real estate automation platforms can be validated efficiently before large-scale investment.

Risks and Challenges in MVP App Development

While MVP strategies reduce risk, poor execution can create misleading results and expensive technical debt.

Treating “Minimum” as a Quality Excuse

One of the most common mistakes is assuming an MVP can be low quality because it contains fewer features.

This assumption is dangerous.

Users judge products based on functionality, performance, and usability—not development philosophy.

A buggy MVP often produces false-negative validation signals because customers abandon the product due to poor experiences rather than lack of demand.

Minimum should define scope boundaries, not quality standards.

Scope Creep After Scope Lock

Feature expansion remains one of the largest causes of budget overruns.

Once development begins, stakeholders frequently request:

  • Additional dashboards
  • Reporting systems
  • Notifications
  • Integrations
  • Advanced permissions

These additions create delays, increase costs, and reduce learning speed.

Poorly controlled scope creep can increase overall development costs by three to five times the original estimate.

Vendor Lock-In With No-Code Platforms

While no-code platforms accelerate validation, they may create long-term dependency on proprietary ecosystems.

Common challenges include:

  • Limited customization
  • Export restrictions
  • Platform pricing increases
  • Migration complexity

Organizations should understand migration pathways before committing to a no-code strategy.

Compliance Gaps Discovered Post-Launch

Many startups postpone compliance discussions until after launch.

This creates significant risks for industries such as:

  • Healthcare
  • Finance
  • Insurance
  • Education

Retrofitting security and compliance controls later often costs substantially more than incorporating them during planning.

MVP App Development Vendor Selection Checklist

Vendor Selection

Selecting the right partner often has a greater impact on outcomes than selecting the right technology stack.

10-Point Evaluation Criteria

Before selecting an MVP software development company, evaluate:

  1. AI-first architecture readiness
  2. Fixed scope commitment before Sprint 1
  3. Post-launch accountability is included in contracts
  4. Verified client reviews and references
  5. Compliance planning during discovery
  6. Hybrid low-code capability
  7. Transparent pricing structure
  8. Dedicated post-launch iteration support
  9. Cross-platform development expertise
  10. Measurable client success stories

Strong vendors focus on validation outcomes rather than feature volume.

Red Flags That Disqualify a Vendor

Warning signs include:

  • No paid discovery phase
  • Unrealistically low pricing
  • Lack of post-launch support
  • Monolithic architecture recommendations
  • No product strategy involvement
  • Absence of client references
  • Fixed timelines without discovery

The best vendors challenge assumptions and help refine product strategy rather than simply accepting feature lists.

Why Tibicle Is a Strong Choice for MVP App Development

Many organizations fail not because their idea lacks potential, but because they overspend before validating market demand.

Tibicle approaches MVP app development with a validation-first mindset focused on reducing risk, accelerating learning, and maximizing ROI.

The team combines:

  • Offshore development efficiency
  • Agile delivery methodologies
  • Cross-industry product experience
  • Scalable architecture planning
  • Post-launch support structures

Rather than building oversized products, Tibicle helps founders and enterprises launch focused MVPs that generate actionable market feedback while maintaining long-term scalability.

Whether you’re building a SaaS platform, marketplace, fintech product, healthcare application, or enterprise tool, Tibicle helps align product development with business validation goals.

Talk to Tibicle’s team about scoping your MVP before committing to a full-scale build.

Conclusion

MVP app development is not simply a way to reduce engineering costs. It is a strategic approach to allocating capital more effectively while minimizing market risk.

With 42% of startups failing because they build products without sufficient demand, validation has become one of the most important stages of modern product development.

Organizations that adopt MVP strategies often achieve higher success rates, faster market feedback, stronger investor confidence, and significantly lower development waste.

The potential savings are substantial. Avoiding a failed full-scale build can preserve $250,000–$500,000 in capital while creating valuable market insights.

Ready to validate your product idea? Get a free MVP scoping session with Tibicle’s development team and identify the fastest path to market validation.

FAQs

How much does MVP app development cost in 2026?
MVP app development costs typically range from $10,000 for simple products to $300,000+ for AI-powered platforms. Standard SaaS MVPs generally fall between $55,000 and $140,000.

How long does it take to build an MVP App?
Most MVPs launch within 8–16 weeks. No-code solutions may launch within 2–4 weeks, while enterprise MVPs often require 4–6 months.

What is the difference between an MVP and a prototype?
A prototype validates concepts and design flows. An MVP is a functional product used by real customers to validate demand and collect behavioral data.

Should I use no-code tools to build my MVP App development ?
No-code platforms work well for rapid validation and cost-efficient testing. However, businesses expecting significant growth should evaluate long-term scalability requirements before committing fully.

What features should an MVP App development include?
An MVP should contain only the features necessary to deliver the core value proposition. Most successful MVPs launch with 5–7 essential screens and a limited feature set.

How do I choose the right MVP App development company?
Evaluate discovery processes, post-launch support, technical architecture, compliance planning, pricing transparency, client references, and measurable success outcomes before selecting a vendor.

What is eCommerce Automation? How It Works

Introduction

The pace of online retail has outgrown manual management, and the cracks are showing. Inventory counts fall out of sync across channels. Orders slip through fulfillment gaps. Customer emails go unanswered for hours. Support teams burn out chasing routine queries instead of solving real problems. Margin quietly erodes with every manual error, delay, and missed upsell opportunity. This is not a staffing problem. It is a scaling problem and without eCommerce automation, it compounds fast.

eCommerce automation

According to industry research, 80% of retail executives expect AI-powered automation adoption to be mainstream by the end of 2025. More striking still: businesses already deploying eCommerce automations report up to 30% reductions in operational costs and conversion rate lifts of up to 77%. The operations that are pulling ahead are not hiring faster, they are automating smarter.

The root problem is straightforward. Manual order processing, inventory tracking, and customer follow-ups work reasonably well at 50 orders per month. At 5,000 orders per month, the same manual processes become bottlenecks that cost revenue, damage customer experience, and burn out teams.

For decision-makers evaluating the automation layer, the question is no longer whether to automate, it is what to automate first, at what investment level, and with which tools.

This guide breaks down precisely how eCommerce automations work, what they cost, where ROI is concentrated, and how to select the right vendor for your specific operational complexity.

What Is eCommerce Automation?

eCommerce automation is the software-driven execution of repetitive business tasks in online retail without requiring manual input for each transaction or event. Rather than having a team member update stock levels, send confirmation emails, or flag a suspicious order, automated eCommerce processes handle these tasks the moment a defined condition is met.

The scope of eCommerce workflow automation is broad. It covers inventory updates, order processing, customer communications, eCommerce marketing automation, fraud alerts, and fulfillment routing, essentially any task that follows a predictable pattern.

As of 2024, 40% of businesses globally have integrated some form of eCommerce automation tools, and this number is accelerating sharply into 2026.

It is worth addressing the most persistent misconception directly: automation does not replace teams. What it does is eliminate low-value manual work so that staff can focus on strategy, customer relationships, and growth. Automation handles the repetitive; humans handle the complex.

How eCommerce Automation Works

At the technical level, virtually every eCommerce automation runs on a three-part framework: trigger, condition, and action. Understanding this framework makes it straightforward to evaluate any automation tool or workflow.

The Trigger-Condition-Action Framework

Trigger: What initiates the workflow. A customer places an order, stock drops below a threshold, a cart is abandoned for more than two hours, or a customer reaches a spending milestone. Triggers are the “if this happens” component of trigger-condition-action workflows.

Condition: The rule that determines whether the action should fire. For example, “if customer lifetime spend exceeds $3,000” or “if inventory falls below 10 units.” Conditions add precision and prevent irrelevant actions from executing.

Action: The automated output that executes when both trigger and condition are satisfied. Send a recovery email, generate a reorder purchase order, apply a discount code, tag a customer segment in the CRM, or push a fulfillment request to a warehouse.

A practical example: A shopper adds three items to their cart and leaves the site. After two hours, the system checks whether the cart value exceeds $75. If yes, it automatically sends a recovery email with a 10% discount code, a classic abandoned cart recovery workflow that requires zero manual intervention.

Where Automation Sits in the Tech Stack

eCommerce automation tools function as connective tissue across the technology stack. They sit between the eCommerce platform (Shopify, WooCommerce, Magento) and the surrounding ecosystem: CRM systems, ERPs, email and SMS platforms, shipping providers, payment gateways, and accounting software.

94% of employees still perform repetitive or mundane tasks as a core part of their daily workflows (Zapier research). eCommerce workflow automation intercepts these tasks at scale, removing the manual loops that slow operations.

This is where no-code automation platforms like Zapier and Make have found strong adoption. They allow non-technical operators to build multi-step workflows across 7,000+ applications without writing custom integration code. For more complex requirements, RPA in eCommerce (robotic process automation) handles structured data processing and legacy system integration that modern API-based tools cannot reach.

Key Areas Where eCommerce Automation Drives Results

eCommerce automation

eCommerce automations deliver measurable impact across five core operational areas. Each represents a category of automated eCommerce processes where the frequency of repetition makes manual handling unsustainable at scale.

Order and Fulfillment Automation

Order fulfillment automation covers the full cycle from payment verification through delivery confirmation. When an order is placed, the workflow automatically verifies payment, generates a shipping label with the appropriate carrier, sends tracking information to the customer, and triggers a delivery confirmation notification when the package is scanned as delivered.

The operational gains are material: fewer processing errors, faster cycle times, and a significant reduction in customer service inquiries about order status. Fulfillment teams shift from administrative processing to exception handling.

Inventory and Restocking Automation

Inventory sync across multiple sales channels, your own website, Amazon, and wholesale portals, requires real-time data coordination that manual processes cannot sustain accurately at scale.As a result, automated systems maintain accurate stock counts across all channels and trigger reorders when inventory reaches predefined thresholds. This helps prevent stockouts and overstock situations that reduce profit margins.

eCommerce Marketing Automation

eCommerce marketing automation is where most businesses see the fastest return on investment. Abandoned cart recovery sequences, post-purchase upsell flows, loyalty program triggers, and segmented email and SMS campaigns all operate through trigger-condition-action logic.

Automated abandoned cart recovery messages recover approximately 10.5% of lost sales on average, a direct revenue impact with minimal ongoing effort after initial setup.

Post-purchase sequences review requests, cross-sell recommendations, and replenishment reminders extend customer lifetime value without requiring manual outreach for each transaction.

Customer Support Automation

AI-powered eCommerce customer support now handles a significant and growing share of inbound queries. Chatbots manage order status checks, return initiation, and FAQ responses around the clock without staffing costs.

AI chatbots handled 30% of customer service queries in 2025. This figure is projected to reach 50% by 2027 as natural language processing capabilities improve and customer comfort with AI support grows.

Automation also handles ticket routing, directing complex issues to appropriate agents, flagging VIP customer contacts for priority handling, and populating support tickets with order history before an agent sees the case.

Pricing and Merchandising Automation

Rule-based pricing adjustments allow eCommerce operators to respond dynamically to competitor price movements, demand signals, and margin targets without daily manual monitoring. Pricing automation enforces floor and ceiling rules while executing adjustments within defined parameters, protecting margin while maintaining competitive positioning.

eCommerce Automation Use Cases by Business Size

The right automation strategy depends heavily on operational scale. Applying enterprise-grade orchestration to a business doing $200K in annual revenue creates unnecessary complexity and maintenance overhead. Conversely, relying on basic email flows when processing thousands of orders daily creates bottlenecks that compound over time.

SMBs (Under $1M Revenue): The highest-priority automated eCommerce processes are cart recovery, welcome email sequences, and basic low-stock alerts. Tools like Omnisend or Shopify Flow provide native eCommerce workflow automation at low cost and implementation complexity. ROI is typically visible within 30 to 60 days.

Mid-Market ($1M–$20M): Multi-channel inventory sync, segmented eCommerce marketing automation, fulfillment routing, and CRM integration become critical. The Klaviyo and Zapier combination handles most requirements at this scale, with optional ERP connections as complexity grows.

Enterprise ($20M+): Cross-platform orchestration, AI-driven demand forecasting, dynamic pricing engines, and warehouse automation require purpose-built solutions. Salesforce Marketing Cloud, UiPath (for RPA in eCommerce), and custom-built workflows are common at this scale. Custom API integrations replace generic connectors.

The guiding principle: automation strategy must match operational complexity. Over-automating early creates maintenance debt. Under-automating late creates revenue-limiting bottlenecks.

Best eCommerce Automation Tools in 2026

The eCommerce automation tools market spans from free native platform extensions to enterprise-grade orchestration platforms. The table below covers the primary options evaluated by mid-market and growing eCommerce operations.

ToolBest ForPricing (Starting)Key StrengthLimitation
Shopify FlowShopify-native workflowsFree (with Shopify plan)Zero-cost entry, native triggersLimited to Shopify ecosystem
KlaviyoEmail/SMS marketing automationFree up to 250 contacts; paid scales by list sizePredictive CLV, churn scoringExpensive at scale
ZapierCross-platform integrations$19.99/mo (Starter)7,000+ app connectionsUsage-based pricing adds up fast
Make (Integromat)Cost-efficient multi-step workflows$9/mo for 10,000 operationsLower cost per operation vs ZapierSteeper learning curve
GorgiasCustomer support automation$10/moBuilt for eCommerce helpdesksNarrow scope (support only)
ActiveCampaignFull lifecycle email automation$29/moDeep automation sequencingComplex setup for beginners

Important note: Subscription price is not total cost. Factor in middleware and integration expenses when platforms do not connect natively, learning curve and onboarding time, scaling fees as contact lists and order volumes grow, and ongoing maintenance. Total cost of ownership often runs 2–3x the subscription price, a figure that must be part of any accurate ROI calculation.

How Much Does eCommerce Automation Cost?

eCommerce automation

Pricing Tiers

Entry-level ($0–$50/month): Basic email flows, Shopify Flow for native Shopify triggers, and free-tier tools from platforms like Omnisend or Klaviyo. Appropriate for businesses processing under a few hundred orders per month.

Mid-range ($50–$500/month): Multi-channel eCommerce marketing automation, inventory sync, CRM integration, and cross-platform workflow tools. This tier covers most growing DTC and wholesale operations.

Enterprise ($500–$5,000+/month): AI-driven personalization, warehouse automation, custom eCommerce workflow automation, and RPA in eCommerce platforms. Custom builds are common at this level when off-the-shelf tools create limitations.

Hidden Cost Factors

  • Middleware and integration tools when platforms do not connect natively via API
  • Staff training and onboarding time, particularly for tools with steeper learning curves
  • Maintenance: automations break when third-party APIs update, platforms push version changes, or business logic evolves. Ongoing monitoring is not optional
  • Scaling fees: most usage-based eCommerce automation tools charge more as order volume and contact list size grow

Total cost of ownership typically runs 2–3x the subscription price when integration, training, and scaling costs are included in the calculation.

ROI and Business Impact of eCommerce Automations

ROI and Business

The financial case for eCommerce automations is well-documented across multiple independent research sources. The ROI concentrates in three primary areas: cart abandonment recovery, post-purchase upsell sequences, and inventory accuracy improvements.

Companies deploying marketing automation see $5.44 in revenue for every $1 invested  a 544% three-year ROI across the customer lifecycle.

69% of retailers report revenue increases directly traceable to AI-powered eCommerce automation investments. 72% report measurable cost reductions.

eCommerce stores using automation tools report 10–12% average revenue increases attributable to automated flows alone.

A practical ROI formula for evaluating any automation investment:

ROI = (Incremental Gross Profit + Cost Savings − Total Cost) / Total Cost

Typical payback periods: 3 to 6 months for eCommerce marketing automation; 6 to 12 months for full operational automation including fulfillment and inventory systems.

For businesses new to automation, the highest-ROI starting point is almost always the same: abandoned cart recovery sequences, post-purchase upsell flows, and inventory reorder alerts. These are high-frequency, high-impact, and low-complexity to implement.

Risks and Challenges of eCommerce Automation

eCommerce workflow automation delivers significant upside, but the risks are real and worth addressing before implementation, not after.

Over-automation: Not every business process should be automated. Complex returns involving multiple parties, VIP customer complaints, and sensitive dispute situations require human judgment. Automating these creates friction and damages customer relationships that have real revenue value.

Data security: eCommerce automation tools access sensitive customer data, payment records, and behavioral data. Each integration expands the attack surface. Vendor SOC 2 compliance and data processing agreements are not optional considerations.

Integration fragility: Automated eCommerce processes break when third-party APIs change, platforms push updates, or data schemas shift. Workflows built on brittle integrations require active maintenance, not periodic check-ins.

Vendor lock-in: Deep integrations with a single platform make future switching expensive. Data portability and export capabilities should be evaluated before commitment.

The set-and-forget trap: 71% of eCommerce stores have experimented with AI-powered automation, but only 33% achieve full implementation and sustained results. The gap is almost always due to insufficient ongoing optimization. Automations that worked well six months ago may underperform today due to changed business conditions.

Mitigation approach: Start with a focused 2 to 4 week pilot on a single high-frequency workflow. Assign clear internal ownership for monitoring. Schedule quarterly workflow reviews. Expand only after the initial automation is performing and monitored.

Vendor Selection Checklist for eCommerce Automation Tools

Use this checklist when evaluating any eCommerce automation platform or tool. Each question targets a failure point that causes automation projects to underperform.

  1. Does it integrate natively with your eCommerce platform (Shopify, WooCommerce, Magento)  or does it require a middleware layer?
  2. Does pricing scale predictably with order volume and contact list growth, or do costs spike non-linearly at key thresholds?
  3. Is there real-time data sync, or does the tool batch-process on a delay that could cause inventory discrepancies or missed triggers?
  4. What is the realistic onboarding timeline? Under 2 weeks is acceptable. Over 8 weeks should prompt a closer look at implementation complexity.
  5. Does it include eCommerce-specific automation templates, cart recovery, post-purchase sequences, restock alerts, or does everything need to be built from scratch?
  6. What does support look like? Live chat support is a meaningful advantage over email-only for time-sensitive operational issues.
  7. Can you export your data if you switch vendors? Data portability is a standard that every credible vendor should meet.
  8. Does the tool support multi-channel automation (email + SMS + push notifications) or single-channel only?
  9. Are there active community forums, eCommerce-specific documentation, and an accessible knowledge base?
  10. Is the vendor SOC 2 compliant or equivalent? Data security requirements are non-negotiable for any tool handling customer payment and behavioral data.

Need help identifying the right eCommerce automation stack for your business? Talk to Tibicle’s technical team for a workflow audit and vendor-neutral recommendation.

Why Tibicle Is a Strong Choice for eCommerce Automation Projects

eCommerce Automation

Most eCommerce automation tools handle the standard use cases well. Where they fall short is custom business logic, complex multi-platform integrations, and the architecture required when an operation outgrows off-the-shelf eCommerce workflow automation.

Tibicle builds custom eCommerce solutions, including automation workflow layers, API integrations, and platform migrations for mid-market and enterprise brands that need automation architectures beyond what Zapier, Shopify Flow, or similar tools can deliver.

The Tibicle technical approach connects eCommerce platforms with CRMs, ERPs, payment gateways, and fulfillment systems under a unified workflow architecture. Rather than stitching together incompatible tools, Tibicle builds the integration layer that makes the full stack operate as a single coordinated system.

Differentiators: Offshore development cost advantage, full-stack engineering capability, proven experience across Shopify, WooCommerce, and Magento ecosystems, and dedicated QA processes that prevent the integration fragility that breaks automated eCommerce processes in production.

Use-case fit: Mid-market and enterprise eCommerce brands that need custom automation beyond what generic no-code platforms can handle.

Explore how Tibicle’s development team can build automation workflows specific to your store operations.

Conclusion

eCommerce automations are no longer a competitive advantage,they are an operational requirement at scale. Businesses that automate order processing, eCommerce marketing automation workflows, and inventory management report measurable, sustained gains in revenue, accuracy, and team productivity.

The right approach is systematic rather than ambitious. Audit your current manual workflows. Identify the highest-frequency, lowest-complexity tasks abandoned cart recovery, order confirmations, and restock alerts. Choose vendors based on total cost of ownership, not subscription price alone. Assign internal ownership for ongoing monitoring and quarterly optimization.

Contact Tibicle to discuss a custom eCommerce automation strategy built for your business operations and growth targets.

Frequently Asked Questions

What is eCommerce automation, and how does it work?
eCommerce automation uses software to execute repetitive tasks, such as order processing, inventory updates, and eCommerce marketing automation emails through trigger-condition-action workflows, without manual input for each event. When a defined trigger fires and the associated condition is met, the system executes the action automatically.

How much does eCommerce automation cost for a small business?
Entry-level eCommerce automation tools start at $0 to $50 per month. Mid-range setups with multi-channel eCommerce workflow automation and CRM integration cost $50 to $500 per month. Total cost of ownership is typically 2 to 3 times the subscription price when integration middleware, training, and ongoing maintenance are included.

What is the ROI of eCommerce automation?
Marketing automation alone returns $5.44 per $1 invested. eCommerce stores using automation tools report 10 to 12% average revenue increases from automated flows, with payback periods of 3 to 6 months for marketing automation and 6 to 12 months for full operational automation.

What are the best eCommerce automation tools in 2026?
Top eCommerce automation tools for 2026 include Shopify Flow for free native Shopify workflows, Klaviyo for eCommerce marketing automation, Zapier for cross-platform integrations, Gorgias for support automation, and Make (Integromat) for cost-efficient multi-step eCommerce workflow automation.

What tasks should I automate first in my eCommerce store?
Start with abandoned cart recovery sequences, order confirmation and shipping notification emails, and low-stock reorder alerts. These are the highest-frequency, highest-ROI automated eCommerce processes with the lowest setup complexity and the fastest path to measurable return.

Can eCommerce automation replace my customer support team?
No. AI-powered eCommerce automation handles routine queries, order status checks, FAQ responses, and return initiation with AI chatbots currently managing around 30% of support queries. Complex issues, VIP customer escalations, and situations requiring human judgment still require skilled agents. Automation extends team capacity; it does not replace it.

12 AI Marketing Tools That Actually Move Metrics in 2026

Introduction

The share of marketers using generative AI in at least one recurring workflow reached 87% in Q1 2026, according to Salesforce’s State of Marketing 2026 report. That is up from 51% in Q1 2024 and 76% in Q1 2025. Two years ago, AI in marketing was an experiment. In 2026, it is the operational baseline.

ai marketing tools

The challenge is no longer access. Every major marketing platform now ships with AI features. Every software vendor added ‘AI-powered‘ to their homepage in 2024. The problem is selection. The gap between AI marketing tools that move metrics and tools that look impressive in a demo is wider than it has ever been.

According to McKinsey’s Global AI Survey, AI content drafting delivers 3.2x ROI, personalization engines 2.7x, and audience research 2.4x. But only 19% of organizations track KPIs specific to generative AI, per McKinsey. Most teams are adopting AI marketing tools faster than they are measuring whether they work.

This guide covers 12 AI marketing tools across six categories: content, social, email, advertising, analytics, and workflow. Each tool is reviewed by what it actually does, who it is built for, and what problem it solves.

How to Evaluate AI Marketing Tools Before You Buy

ai marketing tools

Before adding any AI marketing tools to your stack, answer these seven questions:

  1. What specific bottleneck am I solving? Content production, ad optimization, email performance, or analytics?
  2. Does this tool integrate with my existing CRM and data sources?
  3. What does my current stack already do? Adding a tool that duplicates a capability you pay for elsewhere adds cost without adding value.
  4. How will I measure success? Define the KPI before onboarding, not after.
  5. What is the total cost of ownership? Include integration, training, and data migration.
  6. Does it support brand voice controls? AI tools that cannot be constrained to brand guidelines create as many quality problems as they solve.
  7. What is the vendor’s data use policy? AI marketing tools trained on customer data have significant privacy implications.

The median payback on AI marketing tool investments is now 4.2 months, down from 7.8 months in 2024, per HubSpot AI Trends 2026. For content-heavy teams, payback arrives in under three months. Start with the highest-leverage bottleneck and prove ROI before expanding.

AI Content Marketing Tools

1. Jasper: Brand-Consistent Content at Scale

Jasper is the leading AI marketing tool for enterprise content production. Its core value is brand voice: you configure tone, style, and vocabulary guidelines that persist across every output. For marketing teams producing high volumes of content across multiple formats, blog posts, ad copy, landing pages, email sequences, brand consistency at scale is the operational problem Jasper solves.

Jasper’s 2026 data shows 91% of marketers actively using AI marketing tools in their workflow. The teams getting the most from Jasper are those that invest in setting up brand voice documentation before generating content, not after. Without that configuration, Jasper’s output is generic.

Best for: enterprise marketing teams producing 50 or more pieces of content per month across multiple channels and formats.

2. Surfer SEO: Real-Time Content Scoring and Keyword Optimization

Surfer SEO integrates AI SEO tools with content production. As you write, Surfer scores your content against the top-ranking pages for your target keyword, surfacing gaps in topic coverage, keyword usage, and structural completeness. The real-time feedback loop reduces the editing cycle between writer and SEO reviewer from hours to minutes.

For teams targeting AI Overviews and GEO (Generative Engine Optimization), Surfer’s content scoring increasingly incorporates the passage-level quality signals that AI search systems extract. A well-structured, Surfer-optimized piece is more likely to be cited in an AI Overview than a piece that only optimized for traditional keyword density.

Best for: content and SEO teams writing blog content where organic ranking and AI citation visibility are both business objectives.

3. ChatGPT: Fast Drafting, Repurposing, and Brainstorming

ChatGPT is the most widely adopted AI marketing tool for general-purpose content tasks. 88% of marketers use AI marketing tools in their daily workflow per HubSpot, and ChatGPT accounts for a significant portion of that adoption. Its strength is breadth: it drafts, repurposes, brainstorms angles, rewrites for different audiences, and synthesizes research.

Its weakness is consistency. ChatGPT has no persistent memory of your brand, your audience, or your previous outputs unless you configure a custom GPT with those constraints. Teams that use it without a prompt engineering framework produce inconsistent output quality that requires heavy editing.

Best for: individual marketers and small teams who need a fast first draft or quick repurposing across formats, with human editing as a given.

AI Social Media and Visual Tools

4. Canva AI: On-Brand Visuals Without a Designer

Canva AI has become the default visual production tool for marketing teams without dedicated design resources. Its AI features include text-to-image generation, background removal, Magic Resize for adapting a design across formats, and an AI writing assistant integrated into the design canvas.

For social media specifically, Canva AI solves the production bottleneck: creating a single design and generating platform-specific variants for Instagram, LinkedIn, Facebook, and Twitter in minutes rather than hours. Brand Kit enforcement ensures colors, fonts, and logos stay consistent across AI-generated designs.

Best for: marketing teams producing social media content at volume without in-house designers.
5. Sprout Social: Sentiment Analysis and Crisis Prediction

Sprout Social’s AI layer focuses on listening and intelligence rather than content generation. Its sentiment analysis tracks brand mentions across social platforms in real time, flagging shifts in tone that may signal an emerging issue before it becomes a crisis. Its publishing AI suggests optimal posting times based on historical engagement data.
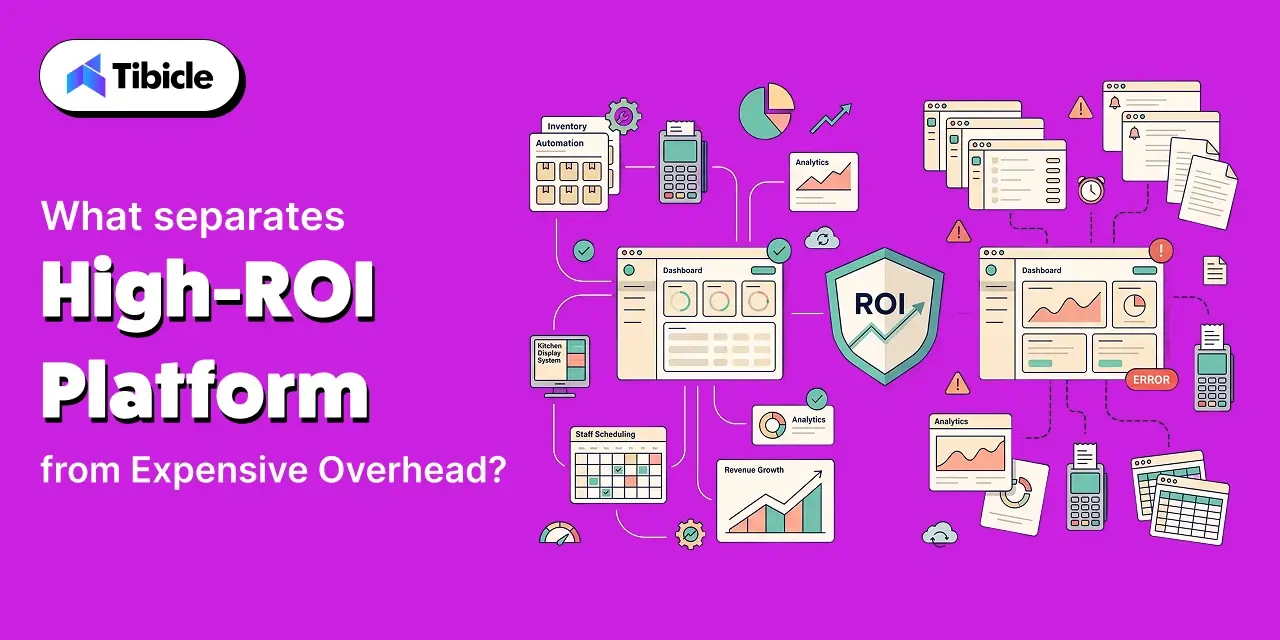
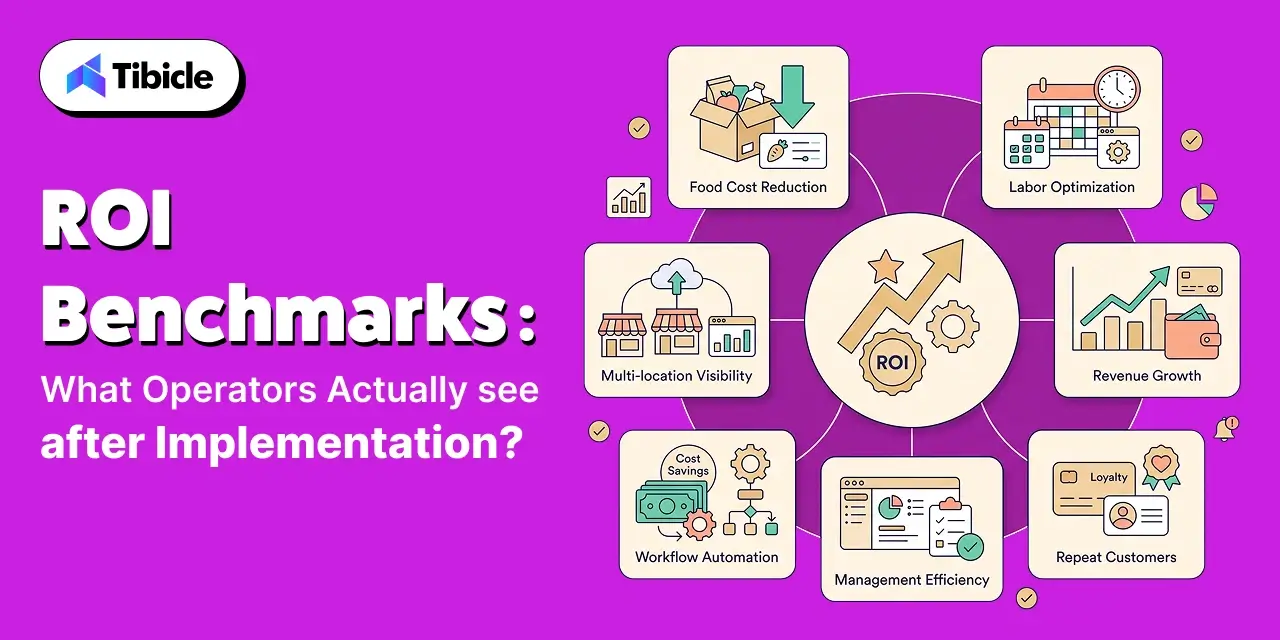
The AI marketing tools use case here is risk reduction and efficiency, not content production. For brands with significant social media presence, the cost of a missed crisis signal typically dwarfs the cost of the tool.

Best for: brands with significant social media followings where audience sentiment monitoring and crisis prevention are operational requirements.

6. Predis.ai: Product Catalog to Social Posts Automatically

Predis.ai generates social media posts directly from product catalogs and URLs. Feed it a product URL and it produces captions, hashtags, and visual assets sized for each platform. For e-commerce and retail marketing teams managing hundreds of SKUs, manual social content creation is an impossible volume. Predis.ai makes it tractable.

Best for: e-commerce and retail marketing teams needing to promote product inventory at scale across social channels.

AI Email Marketing and Automation Tools

7. HubSpot AI (Breeze): CRM-Powered Campaign Automation

HubSpot’s Breeze AI is the most integrated AI marketing tool for teams already living in the HubSpot ecosystem. Breeze generates email sequences, scores leads, suggests segmentation, and drafts content using the CRM data your team has already collected. Because it draws on behavioral history and contact attributes, its personalization is more contextually accurate than standalone AI marketing tools working from a blank slate.

Per HubSpot AI Trends 2026, marketers recover an average of 6.1 hours per week using AI marketing tools for email and campaign management. Senior practitioners save 8-10 hours weekly. The compounding ROI of that time across a team of five makes email automation one of the fastest payback categories in the AI marketing tools stack.

Best for: marketing teams already using HubSpot CRM who want native AI capabilities across their entire campaign lifecycle without additional integration.

8. Seventh Sense: AI Send-Time Optimization for Email

Seventh Sense does one thing: it determines the optimal time to send each email to each individual contact based on their historical engagement patterns. Most email platforms offer send-time optimization at the segment level. Seventh Sense operates at the individual level, analyzing each contact’s past open behavior and delivering email at the moment that contact is most likely to engage.

Companies using AI for email marketing see 28% higher open rates, per McKinsey Digital. Seventh Sense integrates with HubSpot and Marketo, adding individual-level timing intelligence without replacing the sending platform.

Best for: B2B marketing teams running large email lists where improving open rates by 20-30% would materially affect pipeline generation.

AI Advertising and Analytics Tools

9. Madgicx: Autonomous Facebook and Instagram Ad Management

Madgicx applies AI to Meta advertising performance, analyzing campaign data to identify which audiences, creatives, and placements are underperforming and autonomously shifting budget toward what is working. For teams running significant Facebook and Instagram ad spend, manual optimization cannot keep pace with Meta’s algorithm changes. Madgicx operates continuously rather than during weekly check-ins.

Best for: DTC and e-commerce brands spending $10,000 or more monthly on Meta ads where the optimization frequency of manual management is a documented bottleneck.

10. Google Performance Max: AI Asset Creation Across Channels

Google Performance Max is the channel-agnostic campaign type that uses Google’s AI marketing tools to allocate budget and serve ads across Search, Display, YouTube, Gmail, and Maps simultaneously. You provide assets, audience signals, and conversion goals. The AI determines where and when to show ads.

For advertisers comfortable surrendering granular placement control in exchange for AI-driven optimization across Google’s full inventory, Performance Max typically delivers lower cost-per-conversion than channel-specific campaigns at equivalent spend levels.

Best for: advertisers with conversion tracking in place who want Google’s AI marketing tools to handle cross-channel budget allocation.

11. Improvado AI Agent: Unified Marketing Analytics in Plain English

Improvado aggregates marketing performance data from across the stack, paid media, organic, email, social, CRM, and makes it queryable in plain English. Marketing leaders can ask ‘which campaigns drove the most pipeline this quarter’ and receive an answer drawn from unified data rather than manually cross-referencing five dashboards.

Only 19% of organizations track KPIs specific to their AI marketing tools investments, per McKinsey. Improvado addresses the measurement gap that prevents teams from proving ROI on their broader AI marketing tools stack.

Best for: marketing operations teams managing fragmented data sources who need a unified analytics layer without a dedicated data engineering team.

AI Workflow and GEO Tools

12. Zapier AI: Cross-Platform Workflow Automation

Zapier AI connects AI marketing tools to each other and to the broader software stack without requiring developer resources. A workflow might automatically send a Slack notification when a new high-intent lead comes in from Surfer-optimized content, route the contact to HubSpot Breeze for an automated email sequence, and log the attribution data in Improvado. Each of those handoffs is a Zap.

For AI marketing tools specifically, Zapier’s AI can interpret incoming data and make routing decisions based on natural language conditions, reducing the rule complexity that makes traditional Zaps brittle.

Best for: marketing teams using 4 or more disconnected tools who are losing time to manual data entry and tool switching.

Building Your AI Marketing Stack for 2026

ai marketing tools

Companies consolidating their martech stacks around AI-capable platforms report 50-77% cost reductions compared to maintaining a sprawling collection of specialized tools, per research cited in Gartner’s CMO surveys. Fewer, more capable platforms outperform many point solutions.

The practical approach: identify your single largest operational bottleneck, content production, ad performance, email engagement, or analytics fragmentation, and solve that first with the highest-ROI tool in the relevant category. Measure for 90 days. Then add the next tool.

AI marketing tools are not a stack to build all at once. They are a capability to develop systematically, starting where the leverage is highest and measuring every addition against a predefined KPI.

Why Tibicle Is the Right Development Partner for AI Marketing Infrastructure

Right Development Partner

The 12 tools reviewed in this guide cover the marketing workflow layer. The infrastructure layer the custom AI integrations, CRM connections, data pipelines, and automation logic that make those tools work together is where most marketing teams need a development partner.

Tibicle builds the backend that AI marketing stacks run on. Their AI/ML integration practice covers custom workflow automation, multilingual AI chatbots, CRM integrations, and predictive analytics  the exact capabilities that tools like HubSpot Breeze, Improvado, and Zapier AI are built to surface but often cannot fully deliver without custom engineering connecting them to a company’s specific data architecture.

One documented client outcome: a Tibicle-built AI chatbot handled over 75% of customer queries within one month of launch and cut manual ticket creation by 60%. That is the kind of metric movement that the McKinsey data attributes to well-implemented AI but it requires custom integration work, not just a SaaS subscription. Tibicle’s sprint-based model with weekly reviews and scope flexibility means marketing teams get a development partner who moves at marketing speed, not enterprise-IT speed.

For marketing teams evaluating whether to buy an AI marketing tool or build a custom workflow, Tibicle’s $25–$49/hour rate makes the build-versus-buy analysis more favorable than most marketing leaders expect.

Conclusion

The 12 AI marketing tools in this guide each solve a specific problem in a specific category. The teams getting the best ROI from these tools the ones inside that 19% who actually track AI-specific KPIs  are the ones who built the integration layer that connects tools to data and data to decisions.

If your marketing stack needs custom AI integration, workflow automation, or a development team to build what no off-the-shelf tool provides, Tibicle’s AI development team is the partner to talk to. Book a consultation to discuss your current stack, your highest-leverage bottleneck, and what a custom AI solution would cost to build.

Frequently Asked Questions

What are AI marketing tools?
AI marketing tools are software platforms that use machine learning, natural language processing, or generative AI to automate, optimize, or enhance marketing tasks. They cover content creation, social media management, email personalization, advertising optimization, analytics, and workflow automation.

Which AI tool is best for content marketing in 2026?
Jasper is the strongest option for enterprise teams that need brand-consistent content at volume. Surfer SEO is the strongest option for teams where organic ranking and AI citation visibility are the primary goals. ChatGPT works well for individual marketers and small teams who need a fast first draft with human editing as a given.

Can AI marketing tools replace human marketers?
No. McKinsey’s data shows AI marketing tools improve productivity and ROI, not headcount elimination. What changes is the work: junior copywriting roles are contracting, per Gartner’s CMO Spend Survey (23% of agencies reduced junior copywriting headcount in 2025), while demand for senior strategists, data analysts, and AI marketing tools operators is growing. The marketers who thrive are those who direct AI output rather than compete with it.

How do I choose the right AI marketing tool for my team?
Start by identifying your highest-leverage bottleneck: content production speed, ad performance, email open rates, or analytics visibility. Choose the tool with the strongest fit for that specific problem. Define a success KPI before onboarding. Measure for 90 days. Only add a second AI marketing tool after the first one has demonstrated ROI against its defined metric.

What is Generative Engine Optimization (GEO) and why does it matter?
GEO is the practice of optimizing content to be cited and extracted by AI search systems, including Google AI Overviews, ChatGPT Search, and Perplexity, rather than only ranking in traditional SERP positions. Gartner predicts traditional search volume will drop 25% as users shift to AI-powered search. GEO is how content remains visible in that shift. The core practices: write extractable, passage-independent sections, cite primary sources, use direct answer formats, and build topical authority through comprehensive coverage rather than isolated posts.