0%

Cloud-Based POS for Restaurants: How It Works & Costs

What This Guide Covers

Who this is for: Restaurant operators, F&B group owners, and operations decision-makers who are either running a legacy point-of-sale system they have outgrown or evaluating a cloud-based POS for the first time at single or multi-location scale.

Search intent: Decision and evaluation: the reader is not learning what a POS is. They are deciding whether a cloud-based POS is the right infrastructure move for their operation, what it will realistically cost across all three expense layers, and how to evaluate vendors without getting burned by hidden fees or a poor integration fit.

What you will walk away with: A clear breakdown of how cloud restaurant management architecture works, a 3-year TCO model with the exact formula to run it, a 12-point vendor checklist, real pricing benchmarks by vendor tier for 2025–2026, and an ROI framework tied to specific operational levers,  table turns, food waste, order errors, and processing fee differentials.

cloud-based POS

Introduction

The real cost of a legacy POS is not the hardware invoice. It is the revenue leaking every shift through slow service, zero real-time data, and no integration with the delivery platforms your customers are already ordering from. Restaurants that have outgrown their current system are not facing a software problem they are facing an operational infrastructure problem. Cloud-based POS is the operational backbone of modern restaurant management, not a line-item upgrade. This guide covers the architecture behind how it works, what it actually costs across all three expense layers, the ROI math decision-makers should run before signing, and a procurement-grade vendor evaluation framework. By the end, you will have everything required to make a system decision grounded in data, not sales decks.

What Is a Cloud-Based POS System?

cloud-based POS

A cloud-based POS is a point-of-sale system where transaction data, inventory records, menu configurations, and reporting all live on remote servers not on a machine behind your counter. Access is device-agnostic and available from anywhere with an internet connection. According to Software Advice, over 70% of restaurant operators who switched to a cloud POS system cited real-time data access as the primary driver of the decision. (Software Advice, 2025)

How It Differs from a Traditional POS at the Infrastructure Level

A legacy point-of-sale system routes every transaction through an on-premise server physically located at the property. Menu changes, voids, and end-of-day reports are all locked to that machine. If the server fails, operations stop. A cloud POS system pushes every transaction, menu update, and inventory movement to remote servers in real time. The operational implication is direct: a manager at location three can see table-level sales at location one without VPN access, remote desktop workarounds, or a daily export. That is not a convenience feature it is the structural difference between reacting to yesterday’s numbers and managing today’s service.

How Offline Mode Works (and Why It Matters More Than Vendors Admit)

True offline capability means the cloud-based POS continues processing orders locally when internet connectivity drops, queues every transaction, and syncs the full record automatically on reconnect. What it does not mean is that the system freezes at the moment your router goes down during a Friday dinner rush. Not all platforms handle this equally. Some queue orders correctly. Others lose transaction data or lock terminals entirely. Offline mode is a non-negotiable evaluation criterion particularly for high-volume environments where a 20-minute outage during peak service translates directly to revenue loss and table delays.

How a Cloud-Based POS Actually Works in a Restaurant Environment

cloud-based POS

The Data Architecture Behind Real-Time Sync

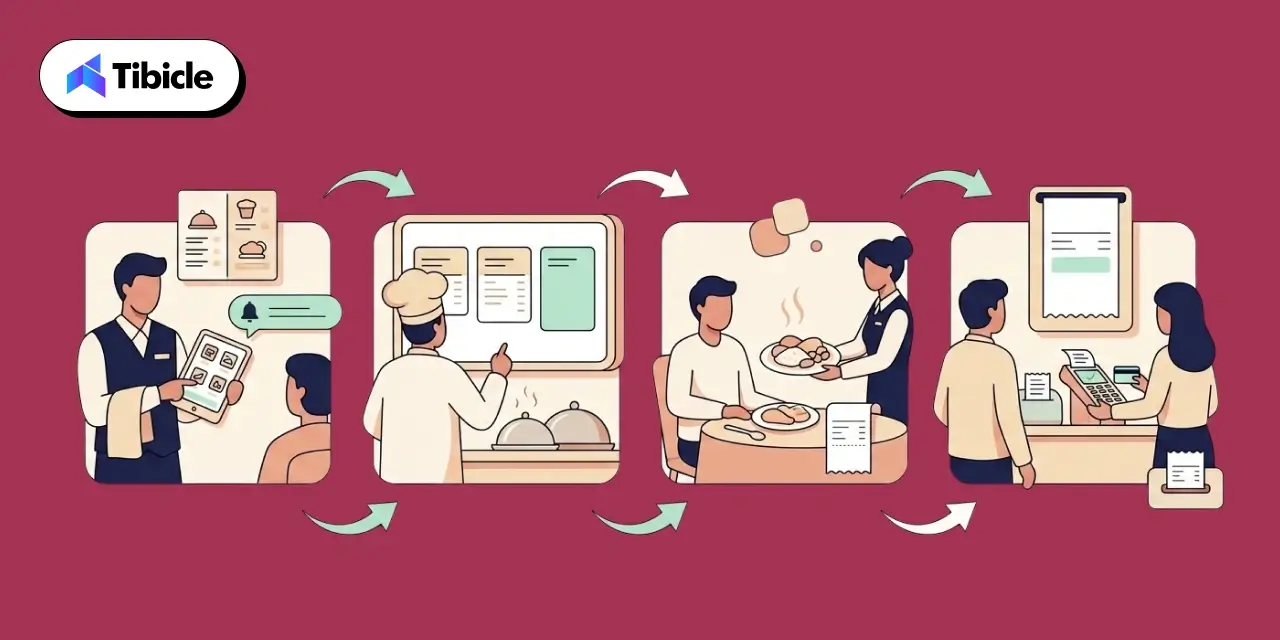
Every transaction cycle in a well-built cloud restaurant management system runs through a single connected flow: an order placed on a tablet triggers an update on the kitchen display system (KDS), which decrements the relevant inventory SKUs, which reflects immediately on the sales dashboard accessible to any manager on the floor or off-site. No manual sync. No batch upload at close. According to Toast’s 2024 Restaurant Technology Report, restaurants using integrated cloud-based POS systems with live kitchen display system connections reduced average ticket times by 12% compared to disconnected setups. (Toast, 2024) That throughput improvement is the operational gain not the dashboard itself.

Core Modules Every Restaurant POS Software Stack Should Include

A complete restaurant POS software stack covers the following without redundancy:

  • Order and table management: dine-in, takeout, and delivery unified under a single interface, not three separate systems
  • Real-time inventory and ingredient-level tracking: not just item counts, but modifier-level depletion so 86s hit the KDS before they hit the guest
  • Staff scheduling, timeclock, and tip management: integrated, not a separate SaaS subscription
  • CRM, loyalty, and customer engagement: visit frequency, spend history, and preference tracking tied to the POS record
  • Analytics and remote reporting dashboards: accessible from mobile without requiring an IT ticket

Multi-Location Management: Where Cloud Architecture Earns Its Cost

For chain operators, the clearest ROI case for cloud restaurant management is centralized control. Menu consistency across branches, role-based access controls that limit what a location manager can modify versus what corporate can push, and consolidated reporting across all sites are native to the architecture not bolt-ons. This is where enterprise-tier pricing on restaurant management software is justified. A single pricing error pushed centrally is corrected in seconds across all locations. In a legacy setup, it requires a technician at each site.

Use Cases Which Restaurant Models Benefit Most

Quick-Service and Fast-Casual Chains Scaling Beyond 3 Locations

Volume throughput, unified menu control, and delivery platform integration are the primary decision drivers for QSR and fast-casual operators at scale. A cloud-based POS that natively connects to third-party delivery APIs and keeps menu pricing consistent across Swiggy, Zomato, and in-store channels eliminates a significant source of order error and margin leakage.

Fine Dining Operators Prioritizing Table Management and CRM

Reservation sync, multi-course pacing on the KDS, split-check handling, and customer preference tracking justify premium-tier restaurant POS software for fine dining. The value is not speed it is precision. A system that surfaces a returning guest’s dietary restrictions or preferred wine before the server reaches the table creates a measurable service advantage.

Ghost Kitchens and Delivery-First Operators

For delivery-first operations, the front-of-house terminal cost is zero. The value equation shifts entirely to deep delivery platform integration, order accuracy metrics, and ingredient-level inventory tracking that catches waste before it compounds. A cloud-based POS built for delivery-first operators should treat the delivery API as the primary order intake channel, not an integration afterthought.

Multi-Brand F&B Groups Running Unified Back-Office Reporting

Enterprise F&B groups running multiple brands from a shared back office need consolidated P&L by location, cross-brand inventory pooling, and single-dashboard oversight. This is the clearest case for custom or enterprise-tier cloud restaurant management where off-the-shelf platforms begin to show their configuration limits, and purpose-built restaurant management software starts to earn a legitimate ROI argument.

Cloud POS vs. Legacy POS Full Comparison

Feature-by-Feature Breakdown

Evaluation DimensionCloud-Based POSLegacy On-Premise POS
Upfront CostLow ($0–$300 hardware + SaaS fee)High ($5,000–$20,000 hardware + licensing)
Ongoing Cost$50–$400/month/locationIT maintenance + version upgrade contracts
Remote AccessFull, any deviceNone without VPN workaround
Offline CapabilityYes (queue + sync)Yes (local server dependent)
Software UpdatesAutomatic, zero downtimeManual, scheduled downtime
Multi-Location ControlNative, centralizedRequires custom integration
Data Loss RiskLow (cloud redundancy)High (local server failure)
PCI-DSS ComplianceVendor-managedOperator-managed
ScalabilityUnlimited, add locations/terminalsHardware-constrained
Integration EcosystemOpen API, wide third-party supportClosed/proprietary

When a Legacy System Still Makes Sense (Honest Assessment)

There are specific contexts where a legacy point-of-sale system remains defensible. Restaurants operating in areas with chronically unreliable internet infrastructure where even a well-built offline mode creates operational friction may not yet have the connectivity baseline a cloud POS system requires. High-volume environments using ruggedized proprietary terminals that have been written down over years carry a replacement cost that changes the TCO math. Operators mid-way through long-term maintenance contracts on existing hardware should model the exit cost before switching. The decision is financial and operational not a question of which architecture is more modern.

Evaluating whether your current POS is costing you more than a cloud migration? Tibicle LLP helps restaurant operators model the true TCO before they commit. Talk to our team.

What Does a Cloud-Based POS System Actually Cost?

cloud-based POS

This section gets the most space in this guide for a reason: most operators underestimate total cost by 30–40% because vendors lead with monthly subscription pricing and bury everything else. A realistic cost model for a cloud-based POS runs across three distinct layers.

The Three Cost Layers Most Vendors Don’t Lead With

Layer 1: Software subscription

Base plan pricing is per location. Most platforms add per-terminal fees beyond the first or second unit, and individual modules loyalty, online ordering, advanced analytics carry separate monthly charges. What appears to be a $99/month plan often reaches $200–$300/month once the actual feature set required is configured.

Layer 2: Hardware

Tablets or purpose-built terminals run $200–$800 per unit depending on vendor and specs. A kitchen display system (KDS) on some platforms is an additional $30/device/month on subscription. Receipt printers, card readers, and cash drawers add $150–$400 per station. For a three-terminal restaurant, hardware alone commonly runs $2,000–$4,500 before a single month of software is billed.

Layer 3: Transaction processing fees

This is the most consistently underestimated cost. Transaction processing fees on most platforms range from 2.3% to 3.5% per transaction. At $1M in annual revenue, a 1% difference in processing rate equals $10,000 per year. (NerdWallet POS Cost Analysis, 2025) At $3M annual revenue across a small chain, that differential is $30,000 annually which outweighs the subscription cost entirely at most tiers.

Real Pricing Benchmarks by Vendor Tier (2025–2026)

Vendor TierMonthly Plan RangeBest For
Entry (Square, SumUp)Free–$69/locationSingle-location, low volume
Mid-Market (Toast, Lavu, SpotOn)$69–$300/locationGrowing chains, 2–10 locations
Enterprise (Lightspeed, PAR POS)$189–$400+/locationMulti-location, complex menus

Note: Hardware costs are separate and not bundled in most enterprise tiers.

The 3-Year TCO Model: What Decision-Makers Should Run

A structured 3-year total cost of ownership for a cloud-based POS covering hardware refresh, subscription, payment processing, and training typically falls between $6,000 and $25,000 depending on terminal count and modules enabled. The formula:

Monthly subscription × 36 + hardware cost + (annual revenue × processing rate) × 3 + onboarding cost

Map this against legacy TCO: hardware amortization + IT service contracts + scheduled downtime cost + manual update labor. For most operators running two or more locations, the cloud TCO is lower at the 3-year mark, primarily because the IT overhead and downtime costs in legacy setups are rarely line-itemed in the initial comparison.

Hidden Costs to Audit Before Signing

  • Per-terminal licensing beyond the base plan (commonly $25–$75/terminal/month)
  • Cancellation and lock-in fees on multi-year contracts (some platforms carry 6-month penalties)
  • Add-on charges for loyalty programs, online ordering modules, and KDS integration
  • Professional installation fees: legacy systems typically run $500–$1,000 per site; most cloud-based POS platforms are designed for self-serve setup, though complex multi-location rollouts sometimes require paid onboarding

ROI and Business Impact: The Numbers Behind the Decision

Business Impact

Where Cloud POS Generates Measurable Revenue Recovery

ROI on a cloud-based POS is not abstract. It ties to specific operational levers that affect margin directly:

  • Reduced order errors: fewer comps and remakes; a 2% error rate reduction on $1.5M revenue = $30,000 recovered annually
  • Faster table turns: real-time reporting from the KDS allows floor managers to see table status and prioritize seating; a single additional cover per table per shift at a 60-seat restaurant compounds quickly
  • Real-time inventory tracking: ingredient-level depletion data reduces food waste; a 3% COGS reduction on $500,000 in food spend = $15,000/year
  • Integrated loyalty visit frequency data and targeted offers drive measurable repeat visit lift without third-party marketing spend

Payback Period: How Fast Does a Cloud POS Pay for Itself?

Industry data indicates a well-implemented cloud-based POS typically recovers its cost within 6 to 18 months, with higher-volume operators reaching payback closer to the 12-month mark. (Hospitality Technology, 2025) A simplified model: if a restaurant generates $1.5M in annual revenue and reduces waste by 3% and order errors by 2%, the combined recovery runs above $70,000 against a total system cost of $12,000–$18,000 per year including all three cost layers. The payback math is not complicated. The risk is underbuilding the cost model, not the ROI case.

KPIs Executives Should Track Post-Implementation

  • Revenue per table turn (pre/post comparison, same period)
  • Food cost percentage before and after deployment
  • Order error rate (tracked via comp frequency in the restaurant management software)
  • Actual average transaction processing fees versus quoted rate
  • Staff onboarding time per new hire (target: under 3 days on most platforms)

Risks and Implementation Challenges Restaurant Operators Underestimate

Internet Dependency and Connectivity Planning

True offline mode is non-negotiable. The strongest platforms continue billing and order-taking locally during outages and sync automatically on reconnect. Before contract sign-off not after go-live test offline behavior with the actual hardware configuration you plan to deploy. Simulate a connectivity drop during a high-order volume scenario. The results of that test should determine whether the platform passes evaluation.

Data Security and Compliance Exposure

Processing transactions through a cloud infrastructure increases exposure surface relative to a fully isolated local network. A purpose-built cloud-based POS should offer end-to-end encryption, PCI-DSS compliance managed by the vendor (not delegated to the operator), and role-based access controls that limit what each staff tier can view or modify. Operators should verify vendor PCI-DSS certification status directly not through a sales deck.

Subscription Creep The Cost That Grows Quietly

Base fees, add-on modules, and per-location charges accumulate across a contract term in ways that are not visible at signing. A structured 3–5 year TCO model built before vendor selection is the only reliable way to catch this. Audit the full module list required to operate at your actual service model, price every item separately, and build the annual escalation rate into the model.

Staff Transition and Change Management

Most cloud systems complete staff training in 2–3 days. The actual implementation risk is not training time, it is data migration quality. Poorly migrated menu item modifiers, pricing structures, and loyalty records cause errors in the first 30 days of operation that directly affect guest experience and revenue. Validate the migration output on a test terminal before go-live, not the morning of launch.

Vendor Selection Checklist What to Evaluate Before You Sign

Checklist

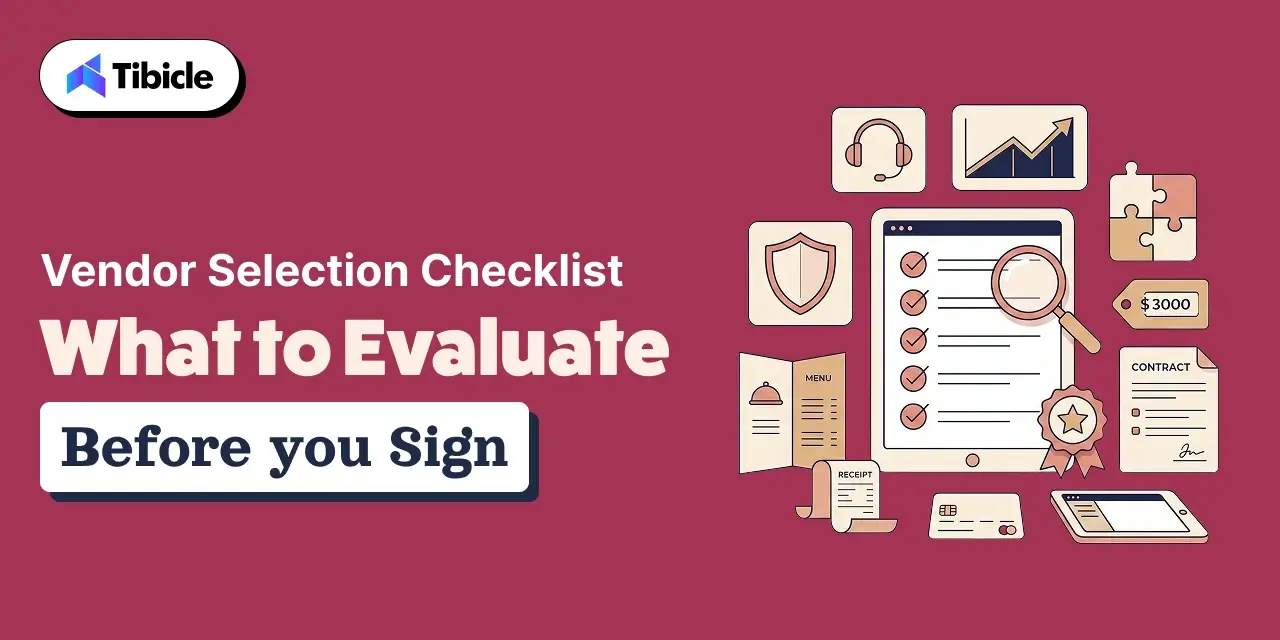
12-Point Evaluation Framework

✅ Does the system support true offline mode with local queue and auto-sync?

✅ Is PCI-DSS compliance vendor-managed or operator-managed?

✅ What is the per-terminal add-on cost beyond the base plan?

✅ Are transaction processing fees locked, or do they scale with volume?

✅ Does the platform support multi-location management, centralized menu control natively?

✅ What third-party integrations are available (delivery platforms, accounting, CRM)?

✅ Is there a Kitchen Display System (KDS) option, and what does it cost per device?

✅ What is the SLA for uptime and incident response time?

✅ Can you export your full data set if you switch vendors? (Vendor lock-in risk)

✅ Is onboarding self-serve, or does it require paid professional services?

✅ What is the contract term length and cancellation penalty structure?

✅ Does the vendor offer a pilot on a single location before full rollout?

Not sure which criteria apply to your restaurant’s scale? Tibicle LLP builds vendor evaluation frameworks tailored to your location count, volume, and integration stack. Request a consultation.

Top Cloud-Based POS Platforms: How They Stack Up in 2026

Quick-Reference Positioning by Use Case

PlatformBest ForStarting PriceKey StrengthWatch Out For
ToastGrowing chains, QSR~$69/locationRestaurant-native, deep inventoryAndroid-locked hardware
Square for RestaurantsSingle-location, entry-levelFree–$69/locationLow-risk entry, modern UXLimited enterprise features
LightspeedUpscale dining, multi-unit$189–$399/locationAnalytics, loyalty built-inHigher cost, complex setup
PAR POSEnterprise, high-resilience opsCustomOffline-first, scalablePricing requires vendor call
LavuMid-market, multi-location managementCustomHardware-agnosticSupport inconsistency reported
CloverFlexible, reseller-driven$179–$354/monthApp marketplace depthReseller pricing variability

Pricing benchmarked from publicly available 2025–2026 vendor pages. Verify current rates directly with vendors before any procurement decision.

Why Tibicle LLP Is Worth Evaluating for Your Cloud POS Implementation

Tibicle LLP operates at the intersection of mobile app development and restaurant technology, a relevant position for operators who need a cloud-based POS that goes beyond off-the-shelf configuration. Where generic vendors offer templated setups, Tibicle builds systems around actual transaction flows, delivery integrations, and multi-location management data architecture.

For restaurant groups with specific inventory workflows, loyalty logic, or third-party integration requirements that pre-built platforms handle poorly, a custom-engineered restaurant POS software layer built by a team that understands both the technology and the operational context reduces implementation risk. There is a category of operator typically multi-brand groups or chains with non-standard service models for whom the configuration ceiling on standard platforms costs more in workarounds than a purpose-built system would cost to build.

Explore what a Tibicle-built or Tibicle-integrated cloud-based POS solution looks like for your restaurant group. Start the conversation.

Conclusion

A cloud-based POS is not a software expense it is an operational infrastructure decision with compounding financial consequences on both sides of the choice. Operators who model total cost of ownership across all three layers, audit their vendor contracts for hidden fees, and plan for offline resilience before implementation consistently outperform those who select based on monthly subscription price alone. The restaurant technology market is moving structurally toward cloud-first operations. The question is not whether to adopt it is which cloud POS system fits your scale, integration stack, and revenue model. Start with the TCO model, run the 12-point vendor checklist above, and pilot on one location before full rollout. That sequence reduces implementation risk more than any feature comparison will.

FAQs

What is the difference between a cloud-based POS and a traditional POS system?
A cloud-based POS routes data through remote servers, enabling real-time access from any internet-connected device. A traditional point-of-sale system stores data on local hardware limiting remote access, requiring manual updates, and creating single-point failure risk if the on-premise server goes down.

How much does a cloud restaurant POS system cost per month?
Base subscriptions for a cloud POS system range from free (single-location entry tier) to $400+/location/month for enterprise platforms. Factor in hardware, per-terminal fees, and transaction processing fees which run 2.3%–3.5% and often outweigh subscription costs at volume.

Can a cloud POS system work without the internet?
Yes platforms with true offline mode process transactions locally and sync automatically on reconnect. Always test offline behavior during vendor evaluation; not all cloud-based POS platforms handle connectivity drops equally well.

How long does it take to implement a cloud-based POS in a restaurant?
Most transitions complete in 1–2 weeks. Staff proficiency typically develops within 2–3 days. The highest-risk phase is data migration, particularly menu items, modifiers, and pricing structures which should be validated on a test terminal before go-live.

What hidden costs should I watch for in a restaurant POS contract?
Key hidden costs include per-terminal licensing beyond the base plan, transaction processing fee rate differentials, KDS add-ons, loyalty and online ordering module fees, and cancellation penalties tied to multi-year lock-in contracts.

Is a cloud POS right for a multi-location restaurant chain?
Yes, multi-location management is where cloud-based POS systems deliver the clearest ROI over legacy alternatives. Centralized menu control, unified reporting, and role-based staff access are native to cloud architecture in ways legacy systems cannot replicate cost-effectively.

Kitchen Display System: Connect KDS with Your POS

What this guide covers

Who this is for: Restaurant operators, kitchen managers, and hospitality tech buyers evaluating whether a kitchen display system is worth the investment.

What this covers: How KDS-POS integration works, what it costs, where the ROI comes from, and what to verify before signing with a vendor.

What you’ll walk away with: A decision-ready framework, architecture overview, vendor checklist, pricing breakdown, and a risk assessment, so you can evaluate KDS options without relying on a sales demo.

kitchen display system

Introduction

Restaurants running high-volume service still lose revenue to paper ticket errors, shouted order modifications, and disconnected front-of-house and back-of-house workflows. The kitchen display system is not a gadget, it is a revenue protection decision. The global KDS market is projected to grow from $487 million in 2024 to over $1 billion by 2033, reflecting how seriously operators now treat back-of-house technology (MarketsandMarkets, 2024). This guide delivers a decision-grade breakdown of KDS-POS integration: architecture, real costs, ROI calculations, integration risks, and a vendor selection checklist everything you need before committing to a system.

What Is a Kitchen Display System and What It Isn’t

kitchen display system

The Core Function

A kitchen display system replaces printed paper tickets with digital screens placed at prep stations, expo lines, and pass-through windows. The moment a server submits an order through the POS, it routes digitally in real time to the correct station. No reprints. No relay calls across the line. The order appears on the relevant screen with item details, modifiers, and table or ticket identifiers. Every station works from the same data simultaneously. For restaurants handling 150+ covers per shift, this eliminates a significant class of operational errors that accumulate silently across a service period and show up as food waste, comps, and negative reviews.

Beyond the Screen

Modern KDS software for restaurants is not a passive display. It functions as an active order orchestration layer: it timestamps every ticket, tracks prep duration per station, routes by station type (grill, fryer, salad, dessert), and flags allergens and modifications inline. This is the core distinction between a kitchen display system and a kitchen printer. A printer outputs a ticket and the data flow ends there. A KDS maintains bidirectional data stations bump items on completion, the expo line sees live progress across all stations, and the system logs every action with a timestamp. That data becomes reportable. Operators can pull average ticket times, identify bottleneck stations, and measure prep consistency across shifts.

FeaturePaper Ticket / Kitchen PrinterKitchen Display System
Real-time updatesNot possibleInstant
Modifier visibilityPrinted once, staticPersistent, inline
Allergen flaggingManual annotationAutomated
Data / analyticsNoneFull ticket time logs
Bidirectional flowNoYes

How Kitchen Display System-POS Integration Actually Works

kitchen display system

The Order Routing Architecture

KDS POS integration follows a structured data flow that operators should understand before evaluating vendors. An order enters the system through any front-end touchpoint: server POS terminal, self-service kiosk, QR code ordering, or a third-party delivery app. The POS parses the order into structured fields item name, quantity, modifiers, station assignment, and seat or ticket number. That structured data routes to the relevant KDS screen via a local area network or cloud API, depending on the integration model. Station staff see the ticket appear in real time. As each item is completed, staff bump it on the display or bump bar. The expo line sees live completion status across all stations simultaneously, enabling accurate plating and dispatch timing. The full cycle from order entry to bump is logged with timestamps.

Native vs. Third-Party Integration

Two integration models exist, and the choice carries long-term operational consequences.

Native integration means the POS and KDS come from the same vendor for example, Toast POS paired with Toast KDS. This model offers lower latency, simpler support escalation, and tighter UI consistency. The tradeoff: it locks the operator into one ecosystem. Switching POS vendors later may require replacing the KDS hardware entirely.

Third-party or middleware integration connects a KDS to an existing POS through an API or middleware layer. This model offers flexibility operators keep their existing POS and add a best-fit KDS. The tradeoff is an added integration layer that introduces a potential failure point and typically adds $50–$150/month in middleware subscription costs.

What Happens During Connectivity Loss

This question separates vendors more than any feature list. Cloud-first KDS platforms stop receiving new orders during internet outages. Some systems cache active orders locally and continue functioning through the outage; others halt inbound ticket flow entirely. For a restaurant running dinner service, a 10-minute connectivity drop without local caching is an operational incident. Always ask vendors: “What does my kitchen see during a 10-minute connectivity drop?” Get the answer in writing, not in a sales demo.

For multi-location operators, the integration layer is not a tech detail, it is an operational risk decision.

KDS Use Cases Across Restaurant Formats

kitchen display system

Full-Service Restaurants

Full-service environments use course-based ordering, where appetizers, mains, and desserts must fire at the right time relative to table pacing. A kitchen display system gives expo staff table-level visibility they see which courses are in progress, which are bumped, and which need follow-up. This replaces verbal coordination between servers and expo leads, which breaks down during peak service when ticket volume exceeds what any individual can track verbally. Error reduction during Friday and Saturday dinner rushes is where full-service operators typically see the fastest ROI.

Quick-Service and Fast-Casual

High ticket volume and aggressive prep-time targets define QSR and fast-casual operations. Multi-station routing grill to salad to packaging must execute without manual re-entry or verbal relay. A kitchen display system eliminates reprint delays and ensures that modifications entered at the POS appear at every relevant station without a server walking a ticket to the line. Research from the National Restaurant Association indicates that order accuracy improvements from digital systems reduce food waste costs by 8–15% in high-volume QSR formats (NRA, 2023).

Ghost Kitchens and Cloud Restaurants

Ghost kitchen operators face a specific operational breakdown: orders from DoorDash, Uber Eats, proprietary apps, and phone channels arrive on separate tablets per platform. Without a unified KDS, a three-brand ghost kitchen may have nine or more active tablet screens at a single station. A kitchen management system with omnichannel aggregation funnels all order sources into one unified queue. This is the highest-leverage use case for KDS in terms of staff cognitive load reduction.

Multi-Location and Enterprise Chains

For restaurant groups operating five or more locations, the kitchen display system earns ROI through standardization. Routing rules are set once and pushed to all screens. Menu updates go live simultaneously across the network. Performance data ticket times, error rates, station throughput aggregates at the corporate level. This enables targeted operational interventions: if Location 7 consistently shows longer grill times than the network average, that is visible and actionable data rather than an anecdote from a regional manager’s site visit.

Kitchen Display System vs. Kitchen Printer vs. Hybrid Setup Full Comparison

CriteriaPaper Ticket / PrinterKitchen Display SystemHybrid Setup
Order accuracyLow manual re-readsHigh digital with modifiers visibleModerate
Real-time updatesNot possibleInstantPartial
Analytics / reportingNoneFull ticket times, error ratesLimited
Hardware costLow upfront$150–$1,000+ per displayModerate
Offline resilienceAlways worksDepends on vendorBetter fallback
Multi-location scalabilityPoorStrongModerate
POS lock-in riskNoneHigh if native-onlyLower

The comparison shifts significantly when labor cost savings and error-related revenue loss are factored in covered in the ROI section below.

Evaluating KDS options for your restaurant group? Tibicle LLP helps hospitality operators build tech stacks that connect cleanly and scale without friction. Book a strategy call.

Kitchen Display System and POS Integration Pricing What You’ll Actually Pay

Hardware Costs

Entry-level commercial touchscreen displays run $150–$400. Mid-range units 15 to 21.5 inch, kitchen-rated with anti-glare coating fall between $400–$800. Enterprise-grade setups combining bump bars with touchscreen displays in industrial enclosures reach $800–$1,500 or more per station. One cost-reduction option operators overlook: existing commercial displays can sometimes be repurposed with a compatible media player rather than replaced outright. Verify this with the vendor before budgeting for full hardware replacement.

Software and Subscription Fees

KDS software subscriptions run $150–$200 per month per display at the industry standard range. Bundled POS and KDS packages from the same vendor can reduce per-unit software cost by 20–35% relative to standalone pricing. Third-party middleware or API layers for non-native integrations add $50–$150 per month depending on the provider. For a 4-station setup running a third-party integration, the software stack alone costs $750–$950 per month before hardware amortization.

Installation and Onboarding Costs

Plug-and-play single-location setups carry minimal installation cost. Multi-station enterprise deployments with custom routing rules, network configuration, and structured staff training add $500–$2,000 per site. 24/7 live support is not a standard inclusion across all vendors. Treat it as a paid add-on unless the contract explicitly confirms it.

Hidden Cost Variables Operators Miss

  • Contract lock-in terms: some POS-KDS bundles require two-year commitments
  • Per-transaction processing fees bundled within POS agreements
  • Upgrade costs when adding stations or rolling out to new locations
  • Retraining costs when staff turnover requires repeated onboarding cycles

ROI of KDS-POS Integration The Business Case

KDS-POS Integration

What the Numbers Show

Restaurants using integrated kitchen display systems report up to 20% higher operational efficiency versus paper-based workflows (Toast, 2024). Error reduction and labor optimization together produce a 15% reduction in operational costs for operators who implement and staff the system correctly. Most operators report full ROI within 3–6 months post-deployment, with faster payback timelines in high-volume QSR formats where ticket counts amplify per-error cost. Faster prep times increase table turnover, producing more covers per shift without adding labor.

Where Revenue Leakage Stops

Disconnected front-of-house and back-of-house systems produce three categories of direct revenue loss:

  • Manual ticket re-entry errors produce remade dishes, which are direct food cost not a theoretical risk
  • Server-to-kitchen verbal communication breakdowns generate wrong orders that result in comps and refunds
  • Delayed expo coordination produces cold food, which generates negative reviews and reduces repeat visit rates

Each category is measurable at the unit level. Operators who track remake rates before and after KDS deployment typically see the most concrete ROI documentation.

Labor Efficiency Gains

With order routing software, kitchen staff no longer rely on verbal instructions to execute their station. The screen communicates the task. This reduces coordination overhead critical given that labor costs in the restaurant industry increased an average of 9.8% between 2023 and 2025 (Bureau of Labor Statistics, 2025). Stations that previously required a senior cook to verbally manage ticket flow can operate with less experienced staff following screen-driven queues.

Multi-Location ROI Multiplier

For restaurant groups running five or more locations, centralized KDS reporting reveals prep time variance across sites. Restaurants using centralized kitchen management systems report up to 18% cost savings across the network by identifying and correcting underperforming locations through data rather than observation. This compounds annually each location improvement carries forward.

ROI Snapshot: If your kitchen handles 200 covers per day, reducing per-ticket error rate by 3% eliminates approximately 6 remade dishes per month. At an average dish cost of $8–$12, that is $576–$864 in direct food cost savings annually before any labor efficiency gain is counted.

Kitchen Display System Integration Risks Operators Underestimate

POS Lock-In

Native KDS solutions from Toast, Lightspeed, or Square operate only within their respective POS ecosystems. If the POS is replaced, the KDS hardware may need to be replaced alongside it. Operators who sign a two-year KDS contract tied to a POS they later outgrow face either sunk hardware costs or early termination fees. Evaluate portability before committing. Ask whether the KDS vendor supports API connections to third-party POS systems, even if the native integration is the default offering.

Connectivity Dependency

Cloud-first point of sale kitchen display platforms stop receiving new orders during internet outages. Local network caching partially addresses this, but the scope of what is cached active tickets only, versus full queue varies by vendor. A restaurant without a confirmed offline fallback is operating a single point of failure in its core service infrastructure.

Multi-Vendor Complexity

Third-party delivery integrations introduce middleware layers into the KDS data flow. Each middleware layer is a potential failure point. Operators managing omnichannel ordering across DoorDash, Uber Eats, and proprietary channels need to stress-test these integrations under realistic order volume before go-live, not after the first busy Friday service.

Staff Adoption Friction

The largest implementation risk is behavioral, not technical. Kitchen staff accustomed to paper tickets need structured onboarding not a 30-minute walkthrough. Without it, teams default to verbal workarounds that replicate the paper-ticket workflow on top of the digital system, negating the investment. Budget onboarding time into the deployment plan, not the post-launch support phase.

Kitchen Display System Vendor Selection Checklist

Before signing with any KDS vendor, verify each of the following:

Integration Compatibility

  • Native integration confirmed with your current POS or middleware support documented?
  • Third-party delivery apps (DoorDash, Uber Eats, Grubhub) confirmed compatible?
  • API access available for custom integrations or future POS changes?

Hardware

  • Display rated for kitchen conditions heat, moisture, grease resistance?
  • Bump bar supported for stations where touchscreen is impractical?
  • Existing displays reusable with a media player?

Reliability

  • Offline or local network fallback confirmed and demonstrated?
  • Uptime SLA documented in the contract?

Scalability

  • Per-station pricing model does cost scale reasonably across 10+ locations?
  • Centralized menu management for all screens from one dashboard?

Support

  • 24/7 live support included or charged as an add-on?
  • Onboarding and staff training included in the contract scope?

Contractual Terms

  • Contract length and exit terms documented?
  • Hardware ownership versus lease model confirmed?

Top Kitchen Display System Solutions and POS Pairings in 2025

POS Pairings

KDS SolutionBest ForNative POSThird-Party SupportOffline Mode
Toast KDSFull-service + QSRToast POSLimitedYes (local)
Lightspeed KDSFull-service, table serviceLightspeedModeratePartial
Square KDSSmall / independent restaurantsSquare POSLimitedLimited
Fresh KDSClover-heavy operationsCloverYesYes
TouchBistro KDSTable-service restaurantsTouchBistroModerateYes
TechRyde KDSyncHigh-volume, AI routingAgnosticStrongYes

No single platform is universally best. The right kitchen display system is the one that fits your POS ecosystem, service format, and growth roadmap not the one with the most features on paper. A standalone KDS that scores well in vendor demos but conflicts with your existing POS architecture will cost more to support than it saves in operations.

Why Tibicle LLP Is a Practical Choice for KDS Implementation

Tibicle LLP works with restaurant and hospitality operators at the intersection of operations and technology. For teams evaluating KDS POS integration, the challenge is rarely the software it is scoping the integration correctly, stress-testing it against real order volumes, and building staff adoption into the deployment plan.

Tibicle brings development expertise to:

  • Custom middleware builds for operators with legacy POS systems
  • API-layer architecture for omnichannel ordering environments
  • Multi-location rollout planning where standardization meets operational reality

This is not a platform sale. It is implementation clarity for operators who have evaluated the market and need execution confidence.

Talk to Tibicle LLP about your KDS integration requirements before your next procurement decision. Contact us here.

Conclusion

A kitchen display system connected cleanly to your POS is not a technology upgrade it is a margin protection and throughput expansion decision. The difference between a KDS that earns ROI in three months and one that becomes a recurring support ticket is integration architecture, vendor fit, and staff onboarding quality. Use the checklist in this guide, run the ROI math against your specific cover count, and treat vendor selection as a long-term operational partnership, not a hardware purchase. Start with the right integration model, and the system pays for itself before the contract renewal date.

Ready to scope your KDS integration? Contact Tibicle LLP for a technical assessment.

FAQs

Can a kitchen display system work without a POS?
Some standalone KDS systems accept manual order entry, but operational value is minimal without POS-driven automation. Manual entry reintroduces the same human error layer that KDS is designed to remove.

What happens if my Kitchen Display System loses internet connectivity?
This depends entirely on the vendor. Some systems cache active orders locally and continue functioning through the outage. Others halt inbound ticket flow immediately. Verify offline resilience before purchase not after go-live.

How long does kitchen display system POS integration take to set up?
Plug-and-play setups in small, single-station restaurants can go live in hours. Multi-station enterprise deployments with custom routing rules typically require one to three weeks, including staff training and routing configuration.

Is a native Kitchen Display System always better than a third-party one?
Not necessarily. Native integration offers simpler support and lower latency but locks you into one POS ecosystem. Third-party options provide flexibility but add integration complexity and ongoing middleware costs. The right answer depends on your growth roadmap.

What is the typical payback period for a kitchen display system?
Most operators report full ROI within three to six months, driven by error reduction, faster ticket times, and labor savings. High-volume QSR formats typically see payback at the shorter end of that range.

Can a kitchen display system handle omnichannel orders in-store, delivery apps, and kiosks simultaneously?
Yes, if the integration is configured correctly. Confirm that the KDS aggregates all order sources into one unified queue before deployment. If each channel appears as a separate feed, staff are back to managing multiple screens the problem the system was supposed to solve.

Build or Buy Kitchen Management Software?

Introduction

Most restaurant and food service operators approach the kitchen management software decision backwards. They evaluate software cost before they evaluate operational fit and the downstream consequences are significant. The wrong choice either locks your team into a rigid platform that cannot reflect how your kitchen actually runs, or it drains engineering budget on features that ship 12 months behind schedule while operations absorb the gap. 

kitchen management software

This is not a software procurement call. It is an operational strategy call, and the variables that determine the right answer are specific to your workflows, your scale, and your competitive positioning. This guide covers what kitchen management software actually includes, where the real decision point sits, what each path costs, the ROI data behind automation, and what to look for whether you are buying a platform or engaging a custom development partner.

What Does “Kitchen Management Software” Actually Cover?

kitchen management software

Before any build-vs.-buy analysis is useful, there needs to be a shared understanding of what kitchen management software actually encompasses. The term gets used loosely and executives who underestimate scope tend to make buying decisions that fall short of operational requirements, or scoping decisions for custom builds that leave out critical modules.

The Core Modules That Drive Operations

A production-grade kitchen management software system typically covers:

  • Order routing and kitchen display system (KDS) integration directing orders from POS to the right prep station in real time
  • Inventory and food cost control tracking ingredient consumption against theoretical usage and flagging variance
  • Recipe management software with real-time costing tying ingredient costs to menu items and updating margins as prices shift
  • Staff scheduling and labor tracking managing kitchen labor against projected cover counts
  • HACCP compliance and food safety logs automating temperature checks, cleaning schedules, and food safety documentation
  • POS integration and third-party delivery sync connecting order flow across in-house and third-party channels

What “Custom” Means in This Context

Custom restaurant kitchen software does not mean adding a logo to an existing platform. It means building workflows directly around your standard operating procedures the sequencing logic your kitchen team uses, the routing rules specific to your brand structure, the compliance requirements tied to your operating context.

This is most relevant for: multi-location restaurant brands, ghost kitchen operators managing several virtual brands, enterprise chains with proprietary recipes and margin sensitivity, and catering or institutional food service companies whose volume and workflow logic does not fit standard SaaS templates.

The Real Question: Where Does Your Kitchen Operation Diverge From the Norm?

kitchen management software

This is the actual decision filter not which software has the best feature list, but how far your back-of-house operations diverge from the assumptions embedded in off-the-shelf platforms. Most kitchen operations software is built around a standard model: a single brand, a linear prep flow, and a limited number of integrations. The further your operation sits from that model, the weaker a bought solution becomes.

When Off-the-Shelf Kitchen Operations Software Is Enough

Off-the-shelf food service management software is a sound choice when:

  • You operate one location or a small footprint with consistent workflows across sites
  • Your menu follows a standard format with limited recipe costing complexity
  • Your integration requirements are narrow one or two third-party platforms at most
  • Your technology infrastructure budget sits under $50,000

In these conditions, a commercial platform delivers rapid deployment, predictable cost, and sufficient capability. The trade-off in workflow fit is manageable.

When Custom Kitchen Order Management Becomes a Strategic Asset

Custom kitchen order management becomes the right answer when:

  • You operate a multi-brand ghost kitchen managing five or more virtual brands with distinct routing logic
  • You run an enterprise chain where proprietary recipe IP and margin sensitivity require internal control over data
  • Your catering or institutional food service operation has volume or workflow requirements that standard platforms cannot reflect
  • You operate in a high-compliance environment healthcare, schools, hospitality groups where audit trails and food safety log generation need to fit specific regulatory formats

Decision trigger list: If three or more of the following apply to your operation, you likely need a custom build.

  1. Your order routing rules differ by brand, daypart, or channel
  2. You manage proprietary recipe costing data you cannot expose to a vendor
  3. You need real-time kitchen analytics tied to custom KPIs
  4. Your third-party delivery integration requirements go beyond what standard APIs support
  5. You operate in a regulated food service environment with non-standard compliance documentation
  6. You have more than five locations with inconsistent workflows between them
  7. Your current platform requires constant manual overrides to match actual kitchen operations

Use Cases What Each Path Looks Like in Practice

Buying a Food Service Management Platform

A 12-location QSR chain deploys a SaaS kitchen management platform in six weeks. The system covers order routing, inventory alerts, and kitchen display system integration out of the box. The team is operational quickly and costs are predictable. The trade-off: the platform cannot reflect their proprietary prep sequencing logic without expensive middleware sitting between the SaaS layer and their POS. The workaround works  until the chain opens its 20th location and middleware costs compound.

Building a Custom Restaurant Kitchen Software

A cloud kitchen operator running eight virtual brands builds a custom kitchen workflow automation system. The build gives full control over brand-level order routing, real-time kitchen analytics, and dynamic labor allocation tied to live order volume. The trade-off is timeline and upfront investment: the MVP takes six to nine months, with an initial investment between $80,000 and $150,000. By Year 2, the operator has a system that reflects how their kitchen actually runs and a competitive asset no SaaS vendor can replicate for them.

The Hybrid Approach

The increasingly common path for mid-market operators: buy a commercial platform for core modules (POS, order management, basic inventory), and build only what is proprietary. Custom elements typically include routing logic, menu engineering dashboards, and brand-specific analytics. This approach limits custom development scope and cost while protecting the workflows that actually differentiate the operation.

Build vs. Buy Kitchen Management Software  Side-by-Side Comparison

kitchen management software

FactorBuild (Custom)Buy (Off-the-Shelf)
Time to Deploy6–12 months2–8 weeks
Upfront Cost$50K–$200K+$5K–$50K
5-Year TCOLower (no per-seat licensing)Higher (recurring fees + add-ons)
CustomizationFullLimited
ScalabilityBuilt to your growth curveVendor roadmap dependent
Integration DepthNativeAPI-limited
Support ModelInternal or dev partnerVendor SLA
Competitive MoatHigh, unique IPNone
Risk if Key Dev LeavesHighLow
Back-of-House Ops FitExactApproximate

Off-the-shelf solutions average $1,000–$100,000 in upfront licensing costs, but operators typically pay 2–4x more over five years once licensing escalations, integrations, and workflow workarounds are factored in.
Unsure where your operation falls? Tibicle’s team can run a rapid-fit assessment with no commitment required.

What Does Kitchen Management Software Actually Cost?

Management

Cost is where most decisions stall  not because the numbers are unavailable, but because operators compare upfront cost without accounting for total cost of ownership. The comparison looks very different at Year 1 versus Year 5.

Off-the-Shelf Pricing Benchmarks

  • Entry-level SaaS platforms: $10–$100/month per location
  • Mid-market platforms: $300–$800/month
  • Enterprise platforms: Custom pricing, typically $1,000–$5,000/month for multi-unit groups
  • Add-on modules (analytics, loyalty, advanced inventory): $10–$100/module/month

Restaurants consistently underestimate integration middleware costs, which can add $9,000–$15,000 annually often for connections that a purpose-built system would handle natively.

What Custom Kitchen Software Development Costs

  • MVP (core order routing + inventory): $50,000–$100,000
  • Full mid-range build (KDS, analytics, staff scheduling, POS integration): $100,000–$200,000
  • Enterprise-grade with AI demand forecasting: $200,000+
  • Timeline: 6–12 months for a production-ready system

The Hidden Cost of Cheap Platforms

Vendor lock-in is not a theoretical risk. Migrating data out of a tightly coupled SaaS platform is expensive and operationally disruptive data portability clauses are rarely as clean as contract language suggests.

Other compounding costs:

  • Per-user licensing that increases directly with headcount growth
  • Customization fees for workflow tweaks that appear “standard” in the sales conversation but require professional services in practice
  • Off-the-shelf tools at Day 365 often deliver significantly less capability than a purpose-built system would for the same operational context forcing manual overrides that absorb the time savings the software was supposed to generate

ROI and Business Impact of Kitchen Management Software

Management

What Automated Kitchen Management Delivers

The business case for kitchen management software is well-established across published industry research:

ROI Comparison Build vs. Buy Over 5 Years

Year 1: Off-the-shelf wins on speed and lower cash outlay. The custom build is still in development or early deployment.

Years 2–3: The custom build crosses break-even as SaaS licensing escalations, middleware fees, and workaround costs compound on the bought side. Operators on standard platforms often add integration layers that push annual costs significantly beyond initial projections.

Years 4–5: Custom builds outperform by 30–60% on total cost of ownership for operators above $1M annual revenue. The competitive differentiation value unique workflows, proprietary analytics, IP control compounds on top of the cost advantage.

Where the ROI Gets Undermined

Two failure modes are common:

  1. Buying a platform that does not fit your back-of-house operations requiring constant manual overrides that eliminate the time savings the system was supposed to deliver
  2. Building without a clear MVP scope leading to 20–30% cost overruns and delayed deployment, which pushes break-even further out and erodes internal confidence in the project

Risks and Challenges You Need to Price Into the Decision

Building Custom Kitchen Management Software

  • Scope creep: Shifting feature requirements inflate budgets by 20–40% without rigorous project management and a locked MVP definition
  • Key-person dependency: If the lead developer exits during or after the build, a replacement typically spends 3–6 months ramping before reaching full productivity
  • Delayed time-to-value: Custom systems typically reach full capability at 12+ months post-project start, versus Day 1 for SaaS platforms
  • Integration blind spots: Third-party delivery platform APIs and existing POS systems can surface unexpected complexity during development underestimating integration scope is one of the most common budget errors

Buying Off-the-Shelf Kitchen Operations Software

  • Vendor discontinuation or acquisition: Your entire operation depends on a third party’s product roadmap and corporate decisions
  • Data exposure: Commercial vendors can access your proprietary recipes, menu engineering logic, and order data relevant for any operator whose recipe IP carries competitive value
  • Customization ceiling: Workflows that diverge from the platform’s design model require middleware or professional services workarounds, adding cost and fragility
  • Per-seat pricing punishes growth: Headcount expansion directly increases software costs, compressing the economics of scaling
  • Migration risk: Leaving a tightly coupled platform later is expensive plan for this from Day 1, not when you are already under contract

Vendor and Partner Selection Checklist

Use this checklist in both directions: evaluating a SaaS vendor or assessing a custom development partner.

For Buying a Platform

  • Does it support your exact kitchen workflow without requiring middleware?
  • What is the contractual exit strategy and data portability policy?
  • Does pricing scale per location or per user and what is the 3-year cost projection at your current growth rate?
  • Is HACCP compliance and food safety log generation built in, or is it an add-on?
  • What is the SLA for downtime, and who bears the cost of kitchen disruption during an outage?
  • Can it integrate natively with your current POS and third-party delivery platforms?

For Engaging a Custom Development Partner

  • Do they have demonstrated experience in food service management software specifically not just general SaaS development?
  • Can they deliver an MVP in under six months with clear milestone accountability?
  • Do they use modular architecture that allows future feature additions without full rebuilds?
  • What is the post-launch maintenance and support model?
  • Do they own the IP after delivery, or do you?

Leading Kitchen Management Software Options in the Market

Several recognized platforms serve the food service sector, each with distinct positioning:

  • MarketMan: mid-market inventory and food cost control platform, strongest fit for independent restaurants and small chains with standard recipe management needs
  • Lightspeed Restaurant: POS-adjacent platform with kitchen operations modules, suited to single-brand operators needing integrated front-of-house and back-of-house coverage
  • Crunchtime: enterprise-grade food service management software used by large multi-unit chains, strong on labor and inventory but with significant implementation complexity
  • Syrve (formerly iiko): comprehensive restaurant kitchen software with POS integration, stronger in European and Middle East markets, growing presence in enterprise food service globally
  • Apicbase: food and beverage management platform targeting hospitality groups and institutional food service, with menu engineering and procurement modules

Each platform covers the core use case well within its design assumptions. Operators whose workflows, brand structures, or compliance requirements fall outside those assumptions consistently find the gap between platform capability and operational need requires workarounds that erode the value of the subscription.

Why Tibicle LLP Is Worth Evaluating for Kitchen Management Software

If the checklist above leans toward build, Tibicle LLP is a development partner worth a conversation.

Tibicle works with mid-market restaurant groups, ghost kitchen operators, and institutional food service companies that have outgrown off-the-shelf tools. The approach is modular — systems are architected so new features can be added without rebuilding the foundation. Client IP ownership is standard: you own the code on delivery, not Tibicle.

On delivery structure, Tibicle operates with milestone-based accountability and a structured MVP process; the goal is a production-ready core system within a defined timeline, not an open-ended development engagement. Post-launch support is included in the engagement model, not treated as a separate contract.

If your operation fits the build scenario outlined in this guide multi-brand structure, proprietary workflow logic, high compliance requirements, or a scale that makes SaaS licensing economics unworkable Tibicle runs a no-cost discovery session to validate scope and cost before you commit.

Conclusion

The build-vs.-buy decision for kitchen management software is not a technology question. It is an operational strategy question. The right answer depends on how closely your workflows match the assumptions embedded in commercial platforms, how much your recipe and routing IP is worth protecting, and what your five-year cost of ownership looks like at your projected scale. For most single-location or early-stage operators, an off-the-shelf platform delivers fast deployment and manageable cost. For operators above $1M in revenue with complex workflows, multiple brands, or compliance-intensive environments, a custom build or hybrid approach consistently outperforms on both cost and operational fit beyond Year 2.

Talk to Tibicle’s team about whether a custom kitchen management software build is right for your operation. Get a free scope and cost estimate.

FAQs

What is the typical cost of building custom kitchen management software?
Mid-range builds run $100,000–$200,000 for a production-ready system covering KDS, analytics, staff scheduling, and POS integration. MVP builds focusing on core order routing and inventory start around $50,000–$80,000 depending on modules and integration requirements.

How long does it take to build a restaurant kitchen software system from scratch?
A properly scoped MVP typically takes 4–6 months. A full-featured system with real-time kitchen analytics, HACCP compliance logging, and POS integration runs 9–12 months. Timeline is directly tied to how clearly the MVP scope is defined before development begins.
What are the hidden costs of off-the-shelf kitchen operations software?
Licensing fees increase over contract terms. Integration middleware adds $9,000–$15,000 annually for operators with more than two third-party connections. Per-user pricing compounds as headcount grows. Over five years, total costs often run 2–4x the initial contract price.

When does buying a food service management platform make more sense than building?
When you operate fewer than five locations with standard workflows, need rapid deployment, have limited integration requirements, and do not carry proprietary recipe or routing logic worth protecting. The lower upfront cost and faster time-to-value make commercial platforms the right call at this scale.

What should I look for in a custom kitchen software development partner?
Domain experience in food service specifically, IP-first contracts where you own the code on delivery, modular architecture that supports future additions, a documented MVP delivery process with milestone accountability, and a clear post-launch support model.

Can I start with an off-the-shelf platform and migrate to custom software later?
Yes. Many operators follow this path, deploy a commercial platform early, then build custom as workflows mature and scale demands it. Plan for data migration complexity from Day 1. Clean data architecture in your initial platform significantly lowers migration cost when you make the switch.

What is mCommerce vs eCommerce

Introduction

eCommerce covers any commercial transaction online, across desktop and mobile alike. mCommerce is the subset specific to smartphones and tablets, via apps or mobile-optimized sites. Mobile commerce hit $2.51 trillion in 2025, or 60% of global e-commerce sales (Statista, 2025). Understanding mCommerce vs eCommerce this way makes clear why mobile readiness is now essential to any modern strategy. As the two increasingly overlap, the real question for businesses is no longer which one to choose, but how well they work together.

mcommerce vs ecommerce

Yet the question most C-suite leaders are still wrestling with is not whether mobile matters but what separates m-commerce vs. e-commerce at the operational and revenue level, and where exactly budget, development resources, and UX investment should be concentrated.

This is not a beginner’s guide to definitions. Companies investing in digital commerce must make high-stakes decisions about platform architecture, development spend, and customer experience design. Getting the m-commerce vs e-commerce distinction wrong at the strategic layer leads to misallocated budgets, underperforming conversion rates, and competitive disadvantage in a market where mobile-first has already become the default consumer expectation.

This guide will break down the structural, financial, and strategic differences between m-commerce and e-commerce, including ROI benchmarks, cost models, risk factors, and a vendor selection framework, everything a decision-maker needs to act, not just understand.

What Is eCommerce? A Quick Operational Overview

E-commerce, in a business context, refers to the buying and selling of goods and services through internet-connected devices, primarily desktops and laptops. It encompasses the full digital transaction infrastructure: product catalog management, payment processing, order fulfillment, and customer data management, typically delivered through a web-based storefront.

The global e-commerce market is projected to be $6.86 trillion in 2025 (eMarketer), spanning both B2B and B2C models. B2C e-commerce powers the consumer retail experiences most people interact with daily. B2B e-commerce, valued at $36 trillion and growing at 14.5% CAGR, drives procurement, wholesale, and supply chain transactions between businesses.

From a conversion standpoint, desktop conversion rates average 3%, outperforming mobile web at 2% (Dynamic Yield). Desktop users tend to be higher-intent buyers: they complete longer research cycles, handle more complex transactions, and show lower cart abandonment rates than their mobile counterparts.

Understanding e-commerce as the foundation is essential before evaluating the differences between e-commerce and m-commerce, because m-commerce does not replace the e-commerce infrastructure. It extends and complicates it.

What Is mCommerce? Why Mobile Is a Separate Strategic Channel

mCommerce (mobile commerce) refers to commercial transactions conducted via smartphones, tablets, and other handheld devices. It is technically a subset of eCommerce, but treating it as merely a responsive version of a desktop site is one of the most common and costly strategic mistakes in digital commerce.

The scale is not a forecast anymore. The US alone has 200+ million adults who have purchased via smartphone (Shopify). Globally, mobile commerce is the primary interface for most consumers, particularly in high-growth markets across Southeast Asia, India, and Latin America.

M-commerce operates across three primary business categories:

Mobile shopping: Purchasing via mobile browsers or dedicated shopping apps, including social commerce platform integrations on TikTok Shop, Instagram, and Pinterest.

Payments on mobile: Digital wallet adoption through Apple Pay, Google Pay, and PayPal, enabling one-tap or biometric-authenticated checkout flows.

Banking on mobile: In-app financial services, BNPL integrations, and account management that support the full commerce transaction lifecycle.

The strategic capabilities that define m-commerce are distinct: push notifications for cart recovery and offer delivery, geolocation targeting for proximity-based promotions, in-app purchasing with reduced checkout friction, and biometric authentication that improves both security and conversion.

Critically, shopping app users convert at 3.5% versus 2% on mobile web (BuildFire). The mobile shopping app development investment is not just a UX upgrade it is a measurable conversion rate improvement that compounds across customer lifetime value.

Understanding the difference between e-commerce and m-commerce at this level is what separates reactive platform decisions from strategic ones.

mCommerce vs eCommerce: Core Differences That Affect Business Decisions

mcommerce vs ecommerce

The e-commerce and m-commerce difference is not simply about screen size. At the operational level, the two channels diverge across device behavior, technology requirements, marketing infrastructure, and security posture. Each dimension carries direct business implications.

Device and User Behavior Split

Mobile drives 78% of global e-commerce traffic but only 66% of orders, a conversion gap that represents billions in underperforming revenue across the industry. Desktop users are high-intent buyers: they arrive further along in the purchase journey, complete longer research cycles, and transact with lower abandonment rates. Mobile users browse more, compare across sessions, and are more susceptible to checkout friction. The mobile commerce vs electronic commerce distinction in user behavior is not a preference difference it is a purchase psychology difference that must inform UX and funnel design.

Technology Stack and Development Requirements

E-commerce platforms are built around CMS and website infrastructure, such as Shopify, WooCommerce, Magento, and BigCommerce, with responsive design, payment gateway integration, and SEO-optimized architecture. The technology investment is primarily web-based.

M-commerce requires a fundamentally different technical layer: native app development or progressive web app e-commerce architecture, mobile payment integration with digital wallet providers, push notification infrastructure, biometric authentication, and app store compliance management. The mobile shopping app development requirement alone introduces an entirely new development discipline and cost structure that e-commerce websites do not encounter. This is a central dimension of the m-commerce vs e-commerce decision for any technology leader evaluating build-vs-buy options.

Marketing and Personalization Channels

E-commerce marketing is built around email, organic search, display advertising, and retargeting channels optimized for desktop sessions and longer consideration windows. M-commerce unlocks a distinct and often higher-engagement channel set: SMS marketing, in-app messaging, location-based offers, and social commerce platform integrations where discovery and purchase happen within a single session.

AI-powered recommendations drive up to 25% of mobile revenue (industry benchmarks), and mobile-first strategy increasingly depends on real-time behavioral personalization delivered at the session level, not the campaign level. Mobile conversion optimization through contextual, behavioral, and location-aware personalization is a genuine revenue lever, not a UX enhancement.

Security and Compliance Considerations

The difference between e-commerce and m-commerce extends into the security and compliance layer. Mobile introduces additional attack surfaces: app store compliance requirements, device-level data access permissions, biometric data regulations under GDPR and CCPA, and a fraud environment that is materially worse than desktop.

1 in 20 mobile verification attempts in 2024 were fraudulent. Any m-commerce investment must account for mobile-specific fraud prevention infrastructure, biometric authentication protocols, and ongoing compliance with regional data protection regulations costs and complexity that do not appear in a standard e-commerce platform evaluation.

mCommerce vs eCommerce Comparison Table

ParameterE-CommerceM-Commerce
Primary deviceDesktop/laptopSmartphone/tablet
Avg. conversion rate3%2% (web), 3.5% (app)
Traffic share35% globally62–64% globally
Revenue share (2025)40%60%
UX focusFull-page layouts, detailed specsSpeed, thumb-friendly UI, one-tap checkout
Payment methodsCards, bank transfers, walletsDigital wallets, BNPL, biometric pay
PersonalizationEmail, cookies, retargetingPush, geolocation, in-app behavior
Development costLower (website-only)Higher (app + mobile web + integrations)
Cart abandonment rate66%80%

Analysis: The data on m commerce vs e commerce conversion rates reveals something important. Mobile generates the majority of traffic but converts less on the mobile web. The gap is not a demand problem — it is a UX and checkout optimization problem. Businesses that close this gap through mobile shopping app development and streamlined checkout flows access a revenue pool that is already visiting their store.

ROI and Business Impact Where the Revenue Actually Comes From

mcommerce vs ecommerce

The mobile commerce vs electronic commerce debate becomes less philosophical and more actionable when you look at where revenue is actually being generated.

Revenue Distribution by Channel

M-commerce drives 63% of global retail commerce revenue (Statista, 2025). On Black Friday 2025, 70% of all sales came from mobile devices, a figure that should recalibrate any strategic plan that treats desktop as the primary commerce channel. Mobile app users generate 2.8–5x higher customer lifetime value than web-only shoppers, making the mobile shopping app development investment one of the highest-return capital allocations available in digital commerce.

Cost of Inaction

Businesses without a mobile-optimized experience lose 78% of traffic that never converts. Customer acquisition cost (CAC) has risen 222% over the last decade, a trend that makes high-retention channels like native apps increasingly critical to unit economics. Mobile apps, through push notifications, loyalty mechanics, and personalized re-engagement, deliver higher retention and lower CAC over time than desktop-only or mobile web approaches.

App vs Mobile Web ROI

Abandoned cart push notifications alone can generate $10,000+ per month in recovered revenue for mid-market retailers. App users purchase 33% more often than non-app users. With full mobile payment integration, personalized in-app experiences, and push notification infrastructure in place, total app ROI can scale to 5–10x within the first year of deployment. For businesses evaluating the difference between e-commerce and m-commerce investment, this is the clearest financial argument for committing to native or PWA mobile development.

Cost and Pricing Factors for mCommerce vs eCommerce Implementation

Understanding the cost structure of each channel is essential for accurate ROI modeling and budget sequencing. The e-commerce and m-commerce difference in investment requirement is significant and varies considerably by business maturity.

eCommerce Platform Costs

Website development ranges from $5,000 to $50,000+, depending on platform choice (Shopify, WooCommerce, Magento, or custom builds) and feature complexity. Ongoing operational costs, such as hosting, security, maintenance, and platform licensing, typically run $500 to $5,000 per month. For most businesses, e-commerce web infrastructure is the lower-cost starting point.

mCommerce Development Costs

Native app development for iOS and Android combined typically costs $30,000 to $150,000+, depending on feature depth, integration complexity, and development partner location and seniority. A progressive web app ecommerce alternative ranges from $10,000 to $50,000, delivering app-like performance within a browser context at lower build cost, though with some capability limitations versus native. Ongoing m-commerce costs include app store fees, push notification services, mobile analytics platforms, mobile-specific QA cycles, and compliance monitoring.

Where to Prioritize the Budget

The right sequencing of m-commerce vs. e-commerce investment depends on the business stage:

  • Under $1M revenue: Mobile-responsive website first. Optimize for mobile web before investing in app development.
  • $1M–$10M revenue: Progressive web app or hybrid app investment. Capture mobile conversion improvements with lower capital outlay than a full native build.
  • Above $10M revenue: Dedicated native apps with full mobile payment integration, personalization stack, and push notification infrastructure. At this scale, the ROI math justifies the full investment.

Risks and Challenges of Each Model

No mCommerce vs eCommerce analysis is complete without an honest assessment of the risks on both sides.

eCommerce Risks

Desktop traffic share is declining globally as mobile-first behavior becomes the norm across demographics. E-commerce platforms built without a mobile-first strategy face increasing structural disadvantage. SEO volatility with algorithm updates creates revenue unpredictability for traffic-dependent businesses. And businesses that have not optimized mobile checkout on their desktop-first e-commerce sites are already losing the majority of their traffic to non-converting mobile sessions a compounding loss.

mCommerce Risks

Cart abandonment on mobile sits at 80%, the highest across all commerce channels, and a persistent challenge even for mature mobile experiences. App fatigue is a real risk: 30% of shoppers delete apps due to excessive push notifications, meaning mobile conversion optimization must be balanced against engagement frequency. Security exposure is higher: fraud rates on mobile are significant, and compliance with GDPR, CCPA, and evolving biometric data regulations adds ongoing operational cost. Perhaps most sobering: only 12% of consumers find mobile web shopping “convenient” (Dynamic Yield), a figure that underscores why mobile shopping app development, rather than mobile-responsive web, is the stronger long-term investment for businesses serious about the m-commerce channel.

Vendor Selection Checklist: What to Evaluate Before Building

Whether investing in e-commerce, m-commerce, or both, evaluate every technology partner against these criteria before committing budget:

  • Platform flexibility: Does the vendor support both e-commerce and m-commerce from a single codebase or unified backend?
  • Mobile-first architecture: Is the platform natively built for mobile-first UX, or is mobile a retrofit of a desktop-first design?
  • Payment integration: Does it support digital wallet adoption, BNPL, and biometric payment natively?
  • Scalability: Can it handle 2x–5x traffic surges during holiday peaks and flash sales without performance degradation?
  • Analytics and attribution: Does it track cross-device customer journeys and mobile-specific KPIs (push open rates, in-app conversion, session depth)?
  • Security compliance: PCI-DSS, GDPR, CCPA readiness  including mobile-specific data access and biometric regulations?
  • Post-launch support: Does the partner provide app store management, push notification strategy, and ongoing mobile QA?
  • Total cost of ownership (TCO): Upfront build cost plus 12-month operational cost  not just the development quote.

Top Tools and Platforms for mCommerce vs eCommerce in 2026

Tools and Platforms

The right platform for your m-commerce vs e-commerce architecture depends on business maturity, budget, and technical requirements. No single platform fits all.

Shopify remains the strongest mid-market option for businesses that need both e-commerce and m-commerce capability quickly. Its PWA support and native mobile payment integration make it a strong default for businesses under $10M revenue.

Magento delivers enterprise-grade flexibility for custom mobile experiences, with deep API-first architecture suited to complex B2B ecommerce and B2C at scale.

WooCommerce with mobile plugins serves budget-conscious SMBs that need mobile-responsive e-commerce without the overhead of a dedicated app investment.

BigCommerce offers native mobile optimization and strong out-of-the-box mobile conversion tools, particularly for mid-market retailers.

React Native and Flutter are the leading custom app development frameworks for businesses building dedicated native mobile apps, enabling shared codebases across iOS and Android, reducing mobile shopping app development cost by 30–40% versus fully separate native builds.

Match the tool to your business stage. Over-investing in enterprise infrastructure at an early stage, or under-investing in mobile at a growth stage, are equally costly mistakes in the m-commerce vs. e-commerce decision.

Why Tibicle Is a Strong Choice for mCommerce vs eCommerce Development

Development

Businesses that have worked through the vendor checklist above and concluded they need a custom build or a development partner capable of delivering both e-commerce and m-commerce infrastructure under a single technical relationship need more than a platform vendor. They need an engineering team.

Tibicle builds custom e-commerce and m-commerce solutions: native iOS and Android apps, progressive web app ecommerce builds, and responsive web platforms designed for a mobile-first strategy from the ground up. The team is based in Ahmedabad with senior development capability across the full stack design, build, QA, and launch, with a transparent pricing model that makes TCO forecasting straightforward.

The use case fit is specific: mid-market and enterprise B2B and B2C businesses that need both desktop and mobile commerce under one technical partner, without the coordination overhead of managing multiple vendors across the commerce stack. Tibicle’s mobile payment integration experience, cross-platform deployment capability, and mobile conversion optimization track record align directly with the criteria outlined in the vendor checklist above.

Talk to Tibicle’s commerce team to scope your mCommerce or eCommerce build and get a technical assessment of where your current architecture is leaving revenue on the table.

Conclusion

The mCommerce vs. eCommerce question is no longer an either/or decision for serious digital commerce businesses. It is a sequencing and budget allocation question one where the wrong answer at the platform architecture stage creates compounding conversion and retention problems that are expensive to unwind.

Mobile commerce is the majority revenue channel: 60% of global e-commerce revenue, 70% of Black Friday sales, and the primary commerce interface for the majority of consumers under 45. But e-commerce infrastructure, the web platform, the backend, the fulfillment and payment systems, remain the foundation on which mobile experiences are built.

For C-suite leaders, the decisions made now on vendor selection, platform architecture, and mobile investment level will directly affect conversion rates, customer lifetime value, and competitive positioning through 2026 and beyond. The businesses that treat mobile-first strategy as a core infrastructure decision, not a UX project, will be structurally better positioned to capture the commerce revenue that mobile is already generating.

Contact Tibicle to discuss your commerce platform strategy and get a custom development roadmap tailored to your current architecture, business model, and 2026 growth targets.

Frequently Asked Questions

What is the main difference between mCommerce vs eCommerce?
eCommerce covers all online buying and selling via the internet, typically through desktop or laptop browsers. mCommerce is a subset of e-commerce that involves transactions conducted specifically through mobile devices like smartphones and tablets. The core e-commerce and m-commerce difference at a strategic level lies in user behavior, technology stack, marketing channels, and conversion mechanics, not just the device used.

Is mCommerce more profitable than eCommerce?
mCommerce now drives 60% of global e-commerce revenue and mobile app users deliver 2.8–5x higher customer lifetime value than web-only shoppers. However, profitability in mobile commerce vs electronic commerce depends heavily on mobile UX quality, the level of app investment (native vs PWA), and how effectively cart abandonment, which runs at 80% on mobile, is addressed through checkout optimization and push notification recovery flows.

How much does it cost to build an mCommerce app?
A native m-commerce app for iOS and Android typically costs $30,000–$150,000+. Progressive web app ecommerce alternatives range from $10,000–$50,000 and deliver app-like performance at a lower build cost. Ongoing costs include app store fees, mobile analytics platforms, push notification services, and mobile-specific QA, typically adding $1,000–$5,000 per month in operational overhead.

Which is more profitable, mCommerce vs eCommerce?
Profitability depends on the business model, product type, and target audience rather than the platform alone. However, with mobile commerce accounting for 60% of global e-commerce sales in 2025, businesses that ignore mobile optimization risk losing a significant share of potential revenue.

Can a business run both eCommerce and mCommerce from the same platform?
Yes. Platforms like Shopify, BigCommerce, and Adobe Commerce support both e-commerce and m-commerce from unified backends. Custom builds using React Native or Flutter can share a single backend while delivering native mobile experiences on iOS and Android. For businesses evaluating mobile commerce vs electronic commerce infrastructure, a unified platform reduces development cost, simplifies analytics attribution, and eliminates backend duplication.

What conversion rate should I expect from mobile commerce?
Mobile web converts at roughly 2%, while mobile apps convert at 3.5%. Desktop e-commerce still leads at approximately 3%. The m-commerce vs e-commerce conversion gap on mobile web is primarily a UX and checkout optimization problem, not a demand problem. Businesses that invest in mobile shopping app development, one-tap checkout, and digital wallet adoption consistently see mobile conversion rates that meet or exceed desktop benchmarks.

Top 5 Restaurant Inventory Management Software in 2026

Introduction

Restaurant inventory management software has become one of the most important investments for restaurants looking to control food costs, reduce waste, and improve operational efficiency. Food and beverage costs average 28 to 35% of revenue for full-service restaurants, yet many operators assume the problem lies in purchasing or portion control. More often than not, the real issue is visibility; restaurants don’t know what they’re losing until the month-end P&L arrives, when the financial impact has already occurred.

restaurant inventory management software

The wrong software decision compounds that problem. A platform that doesn’t integrate cleanly with your POS, can’t handle multi-location reporting, or gets abandoned by BOH staff after 60 days doesn’t save money; it adds cost to an already-tight margin structure. The restaurant inventory management software market is projected to grow from $4.55 billion in 2025 to $9.18 billion by 2030, and the number of platforms competing for that spend is growing with it.

That makes the evaluation harder, not easier. The five platforms covered here are assessed on what actually moves the needle for operators: food-cost impact, implementation risk, scalability, and total cost of ownership, not on feature checklists.

Why Restaurant Inventory Management Is a Financial Decision, Not a Tech Decision

Most operators frame the inventory software decision as an IT question: which platform has the best interface, which one integrates with our current stack, which one the team will complain about least. That framing is expensive. The right question is which platform removes the most dollars from your cost structure with the least implementation risk.

Inventory software doesn’t improve food costs by itself. It improves visibility, and visibility creates the conditions where problems get caught early enough to fix. That distinction matters when you’re evaluating platforms and trying to build a business case for the investment.

What the Numbers Say About Inventory Mismanagement in 2026

The operational and financial cost of manual inventory management is well-documented at this point. Food and beverage costs average 28 to 35% of revenue for full-service restaurants, with variance that compounds across locations. Manual inventory counting consumes 15 to 20 hours per week of management time, time that isn’t being spent on the floor, on scheduling, or on the supplier relationships that affect purchasing costs. Over 38% of fruits and vegetables are wasted in restaurant operations due to inaccurate demand planning. That’s not a storage problem. It’s a forecasting problem that software is built to solve.

What Modern Restaurant Inventory Management Software Actually Does

restaurant inventory management software

Modern restaurant inventory management software does far more than replace spreadsheets. The platforms in this guide provide real-time stock visibility, purchasing automation, recipe costing, and forecasting that directly improve restaurant profitability. 

It handles real-time stock depletion linked directly to POS sales data, purchase order automation and supplier management, recipe costing with theoretical versus actual usage variance, multi-location inventory tracking and transfer management, and AI-powered demand forecasting to reduce over-ordering. Each of those capabilities translates directly to a line item on the P&L. The question for operators is which combination of capabilities maps to their actual cost problem, and which platform delivers those capabilities without a 12-month implementation.

The 5 Features Every Restaurant Inventory Management Software Should Offer

Not all inventory platforms are solving the same problem. Before comparing vendors, operators need a clear evaluation framework, one built around financial outcomes, not feature counts.

restaurant inventory management software

POS Integration Depth

Real-time stock depletion tied to POS sales data is categorically different from end-of-day sync. When food cost runs hot mid-week, a platform that updates inventory once every 24 hours gives you yesterday’s problem, not today’s. The integration question isn’t whether a platform connects to your POS; it’s how often and how cleanly. Ask vendors specifically about sync frequency and what happens when the integration drops.

Recipe Costing Accuracy

Recipe costing is only as accurate as the invoice pricing feeding it. Platforms that pull live invoice pricing into recipe cost calculations, accounting for yield tracking and prep loss, give operators a real cost-per-plate number, not a theoretical one from three months ago. The gap between those two numbers is often where food cost variance hides.

Invoice Processing and AP Automation

Manual invoice entry is slow and error-prone. Automated invoice processing eliminates data entry lag and catches receiving discrepancies before they close into the books. For multi-location operators managing hundreds of invoices monthly, this capability alone can justify the platform cost through labor recovery and error reduction.

Waste Tracking and Reporting Granularity

A single waste total tells you nothing actionable. Waste logs broken down by reason code, spoilage, overproduction, prep error, and transfer tell you where to intervene. The difference between a platform that shows you a waste number and one that shows you why waste is happening is the difference between data and a decision.

Scalability Across Locations

A platform that works well at 3 locations doesn’t automatically scale to 30. Evaluate whether the pricing model compounds predictably as you add units, whether permissions and reporting hierarchies support regional or concept-level management, and whether the vendor has reference customers at the scale you’re planning, not just at your current size.

Top 5 Restaurant Inventory Management Software Platforms in 2026

Each platform below is evaluated on its strongest use case, its standout capability, and its most meaningful limitation. No platform is the right answer for every operation; the goal is to narrow the field to the one that fits your cost structure, team size, and growth plan.

1. Restaurant365: Best for Multi-Unit Operators Needing Consolidated Financials

What it is: Restaurant365 is a cloud-based platform that replaces standalone accounting and inventory systems with a single integrated environment. For operators who are running QuickBooks alongside a separate inventory tool and reconciling them manually, Restaurant365 eliminates that workflow.

Ideal for: Groups with five or more locations that need integrated payroll, general ledger, and inventory in one system. Operators who need daily P&L by location, not a consolidated report at month-end, will find this capability particularly valuable.

Standout capability: Consolidated reporting across all locations is the core differentiator. Finance teams can see daily food cost by unit without pulling reports from multiple systems or waiting for a close cycle. For CFOs and controllers managing complex P&L structures, that visibility changes how quickly problems get addressed.

Limitation: Setup complexity is real. Teams new to integrated accounting software face a steeper learning curve than platforms built for operations-only users. Implementation timelines are longer, and the investment in onboarding is higher. For single-location operators or groups under 5 units without an accounting integration problem, this is more platform than they need.

2. MarketMan: Best for Food Cost Control and Supplier Management

What it is: MarketMan is a dedicated inventory and procurement platform built specifically for food cost reduction. It doesn’t try to replace accounting software; it focuses on the back-of-house workflows that drive food cost variance: counting, ordering, invoicing, and recipe costing.

Ideal for: Independent restaurants and growing groups with complex menus and multiple vendor relationships. Operators who are losing money on food cost but can’t identify exactly where will find the most immediate ROI here.

Standout capability: Theoretical versus actual usage tracking is where MarketMan earns its positioning. When actual usage consistently runs above theoretical, the platform flags the variance by item, making it possible to identify whether the problem is portioning, theft, spoilage, or receiving discrepancies. Waste logging by reason code and recipe costing connected to live invoice pricing round out a genuinely strong food cost control feature set.

Limitation: MarketMan doesn’t include built-in accounting. Operators who need financial consolidation across locations will need a third-party integration, typically QuickBooks or Sage, which adds cost and a data sync dependency.

3. MarginEdge: Best for Fast Visibility Into Daily Food Costs

What it is: MarginEdge sits at the intersection of invoice processing and POS integration. It isn’t a full inventory platform; it’s built to give operators food cost data within the period, not at month-end close.

Ideal for: Operators who need to know their food cost number now, not when the accountant closes the books. If the current workflow involves waiting for a month-end report to find out whether food cost was in line, MarginEdge solves that specific problem faster than most alternatives.

Standout capability: The invoice coding team is a differentiator that often gets overlooked in feature comparisons. MarginEdge employs humans to manually code invoices, which means operators don’t need to map their own vendor catalogs or train staff on AP workflows. Daily food cost dashboards are often live within days of setup — a much faster time-to-value than platforms requiring weeks of configuration.

Limitation: MarginEdge isn’t a replacement for a full inventory platform. Recipe costing is less granular than MarketMan, and operators needing detailed yield tracking or waste logging by reason code will find gaps. It works best as a financial visibility layer alongside, not instead of, a dedicated inventory tool for operations with complex menus.

4. Toast Inventory: Best for Restaurants Already on Toast POS

What it is: Toast Inventory is the inventory layer built directly into the Toast POS ecosystem. For operators already running Toast, it’s the path of least resistance to inventory tracking: no separate vendor, no integration configuration, no additional login.

Ideal for: Independent restaurants and small chains already on Toast POS that need basic inventory visibility without the overhead of evaluating and implementing a standalone platform. The elimination of vendor management complexity is a genuine operational benefit.

Standout capability: Automatic stock depletion per sale is the core value here. Every item sold removes the corresponding ingredient quantities from inventory in real time. Built-in sales alerts and usage tracking give operators a clear picture of what’s moving and what’s sitting, without any manual data entry.

Limitation: Toast Inventory is functional for basic tracking and doesn’t go much further. Complex multi-supplier recipe costing, waste logging by reason code, or theoretical versus actual usage variance are outside its scope. Operators with sophisticated food cost control needs will outgrow this quickly.

5. Crunchtime: Best for Large Enterprise Restaurant Chains

What it is: Crunchtime is an enterprise operations platform with AI-powered forecasting and multi-unit audit capabilities. Its purpose is built for the complexity of large chain operations, centralized control, consistent standards enforcement, and chain-wide visibility into costs and compliance.

Ideal for: QSR chains and large casual dining groups with 50 or more locations that need centralized operational control. At this scale, the ROI calculation changes: the savings from AI-driven demand forecasting and suggested prep across hundreds of units can dwarf the platform cost.

Standout capability: AI-driven demand forecasting, suggested ordering, and suggested prep are the capabilities that separate Crunchtime from the platforms above it on this list. For enterprise chains, purchase order automation at scale, informed by historical sales patterns and current inventory levels, directly reduces over-ordering and the food waste that follows. Chain-wide waste tracking completes the visibility picture.

Limitation: Entry-level pricing starts above $5,000 per month, and enterprise contracts are custom. Crunchtime is not suited for operators below 20 to 25 units. For growing groups that haven’t reached that threshold, the cost structure and implementation complexity are mismatched to operational needs.

Restaurant Inventory Management Software Comparison (2026)

restaurant inventory management software

Use this table as a starting point for vendor conversations, not as a final decision framework. Pricing reflects publicly available 2026 data per location per month and will vary with setup fees, tier upgrades, and contract structure. Verify directly with each vendor before building a budget .

PlatformBest ForStarting PricePOS IntegrationRecipe CostingMulti-LocationAccounting Built-In
Restaurant365Multi-unit chains~$249/mo/locationYesYesYesYes
MarketManFood cost control~$$1,500 /mo per locationYesAdvancedYesNo
MarginEdgeDaily P&L visibility~$350/mo/locationYesBasicYesNo
Toast InventoryToast POS usersBundled with ToastNativeBasicLimitedNo
CrunchtimeEnterprise chains$5,000+/moYesAdvancedYesNo

Note: Pricing reflects publicly available 2026 data per location/month and may vary with setup fees and tier upgrades.

Running a multi-location operation and evaluating which platform fits your current cost structure? Talk to a specialist before committing to a contract.

What These Platforms Actually Cost: A Realistic Pricing Breakdown

Most vendors publish starting prices. What they don’t publish is what operators actually end up paying after setup fees, integration configuration, training, and the inevitable tier upgrade when entry-level features don’t cover operational needs. This section covers the realistic cost picture.

Per-Location vs. Enterprise Pricing: What to Budget

Pricing scales with locations and feature tiers in ways that aren’t always obvious from vendor websites. Here’s what operators should budget for:

  • MarketMan at 3 locations plus BlueCart for purchasing: $800 to $1,000 per month
  • MarketMan at 5 locations with full onboarding: $1,200 to $1,800 per month
  • Adding MarginEdge as a financial visibility layer at 5 locations: an additional $900 to $1,500 per month
  • Restaurant365 at 10 users: $999 to $1,999 per month depending on tier
  • Crunchtime: custom enterprise contracts starting above $5,000 per month

Hidden Costs Operators Frequently Underestimate

The monthly subscription is rarely the whole cost. Budget for:

  • Onboarding and setup fees: MarketMan charges approximately $500 per location
  • Invoice scan overages on entry-tier plans
  • POS integration configuration time and IT resource cost
  • Staff training hours, particularly for teams new to digital back-of-house systems

When to Stack Tools vs. Use One Platform

For operators with 1 to 5 locations, stacking a dedicated inventory platform with a separate accounting integration often costs less and deploys faster than an all-in-one system. Above 10 locations, particularly when multi-concept or multi-brand complexity enters the picture, the consolidation benefits of a platform like Restaurant365 start to outweigh the stacking cost savings. The right answer depends on where operational complexity sits today and where it’s headed in the next 24 to 36 months.

ROI and Business Impact: What the Data Shows for 2026

The ROI case for restaurant inventory software isn’t theoretical. It’s a math problem with well-established inputs, and for most operations, the payback period is shorter than most software investments.

Food Cost Reduction

Food Cost Reduction You Can Expect

Automated inventory systems reduce food waste by an average of 26% and over-ordering by 31%. Restaurants that implement the right platform and follow through on data hygiene can reduce food costs by up to 20%. For a restaurant spending $30,000 per month on food, that’s a potential savings of $6,000 per month, $72,000 per year. For a $1.5 million revenue restaurant, a 5% food cost reduction saves $24,750 annually. Most platform costs at that scale run $150 to $400 per month. The math isn’t complicated.

Labor Savings From Automation

Manual inventory counting consumes 15 to 20 hours per week of management time. At $18 to $25 per hour for management-level labor, that’s $280 to $500 per week in recovered cost, before accounting for the accuracy improvement that comes with digital counting versus clipboard estimates. Most restaurants see measurable food cost changes within 30 to 60 days of going live, which means the ROI case materializes quickly enough to validate the investment in the same quarter it’s made.

Payback Timeline by Operation Size

Payback timelines vary with operation complexity and how aggressively the platform is implemented:

  • Independent restaurants with 1 to 2 locations: 3 to 6 month payback is typical
  • Mid-market groups with 3 to 10 locations: often under 90 days when food cost variance is addressed directly
  • Enterprise chains: ROI is calculated across waste reduction, labor recovery, and purchasing efficiency at scale; individual unit metrics compound across the portfolio

Risks of Implementing Restaurant Inventory Management Software

Risks and Challenges

Integration Failures With Existing POS Systems

Not every POS integrates cleanly with every inventory platform. Before signing a contract, verify API compatibility, data sync frequency, and whether your specific POS version is on the vendor’s supported integrations list. Ask for a reference from another operator running your POS on their platform. Integration issues are the most common cause of delayed go-lives and the most expensive to fix post-contract.

Data Accuracy Problems During the First 90 Days

Recipe libraries, unit-of-measure mismatches, and supplier catalog errors are the most common causes of inaccurate food cost data after implementation. A platform is only as accurate as the data entered into it. Who owns data hygiene internally matters as much as the platform itself; identify that person before go-live, not after the first count discrepancy.

Adoption Resistance From Kitchen and BOH Staff

The fastest-failing implementations share one trait: no change management plan. Restaurant back-of-house staff are busy, skeptical of new systems, and not always the intended audience for vendor onboarding materials. Mobile accessibility and structured training investment directly determine whether inventory counts happen accurately and consistently, or whether the system becomes a compliance checkbox that no one trusts.

Scaling Risk: When You Outgrow Your First Platform

Choosing a platform suited for 2 locations when you plan to operate 20 within 3 years creates a costly migration event. Platform migrations are expensive in time, data, and disruption. Build the growth plan into the vendor evaluation from the start; ask vendors explicitly about customers at your target scale, not just your current size.

Vendor Selection Checklist: What to Evaluate Before You Sign

Use this checklist when evaluating any restaurant inventory management software vendor. These are the questions that separate a good demo from a good fit.

Operational Fit

  • Does it integrate with your current POS system without custom development?
  • Does pricing scale predictably as you add locations?
  • Does it support your supplier network and automate purchase orders?

Financial Visibility

  • Can you access daily food cost data, not just month-end reports?
  • Does it track theoretical versus actual usage variance by item?
  • Does it flag receiving discrepancies before they close?

Implementation

  • What is the onboarding timeline and who owns setup?
  • Is there a dedicated implementation support contact?
  • What does the training program look like for BOH staff?

Scalability

  • Is the platform built for multi-location operations, or adapted to it?
  • Are enterprise pricing tiers clearly defined before contract?
  • What is the vendor’s uptime SLA and support response standard?

Why Tibicle LLP Is Worth Considering When Off-the-Shelf Doesn’t Fit

The five platforms above cover the majority of restaurant operations well. There’s a segment they don’t cover: operators with non-standard workflows that standard platforms can’t accommodate without expensive workarounds.

Dark kitchens running multiple brands from a single facility, cloud kitchen aggregators managing proprietary supplier contracts across concepts, and vertically integrated food and beverage chains with custom procurement logic are all examples of operations where off-the-shelf software requires enough customization that a purpose-built system becomes cost-competitive.

Tibicle LLP builds AI-powered web and mobile applications and custom backend systems for restaurant operators in that category. The engagement model is flexible, from scoped MVP builds to full ongoing development partnerships. There are no pricing promises here; the right starting point is a conversation about what your operation actually requires.

For restaurant operators who have outgrown standard platforms or need a purpose-built solution, explore what a custom build looks like for your operational model.

Conclusion

Choosing the right restaurant inventory management software isn’t about comparing feature lists. It’s about selecting a platform that removes costs, improves visibility, and supports long-term operational growth.  It’s about which platform removes the largest dollar figure from your cost structure with the least implementation risk.

Restaurant365 is the right call for multi-unit operators who need integrated accounting and consolidated financials. MarketMan is where independent restaurants and growing groups with food cost problems should start. MarginEdge solves the daily visibility problem faster than any other platform on this list. Toast Inventory serves Toast POS users who want basic tracking without a separate vendor relationship. Crunchtime is purpose-built for enterprise chains with the scale to absorb its cost and complexity.

Single-location operators have a different right answer than growing groups, and growing groups have a different right answer than enterprise chains. The decision logic is the same across all three: match the platform to the cost structure and the growth plan, not to the demo that looked best in a conference room.
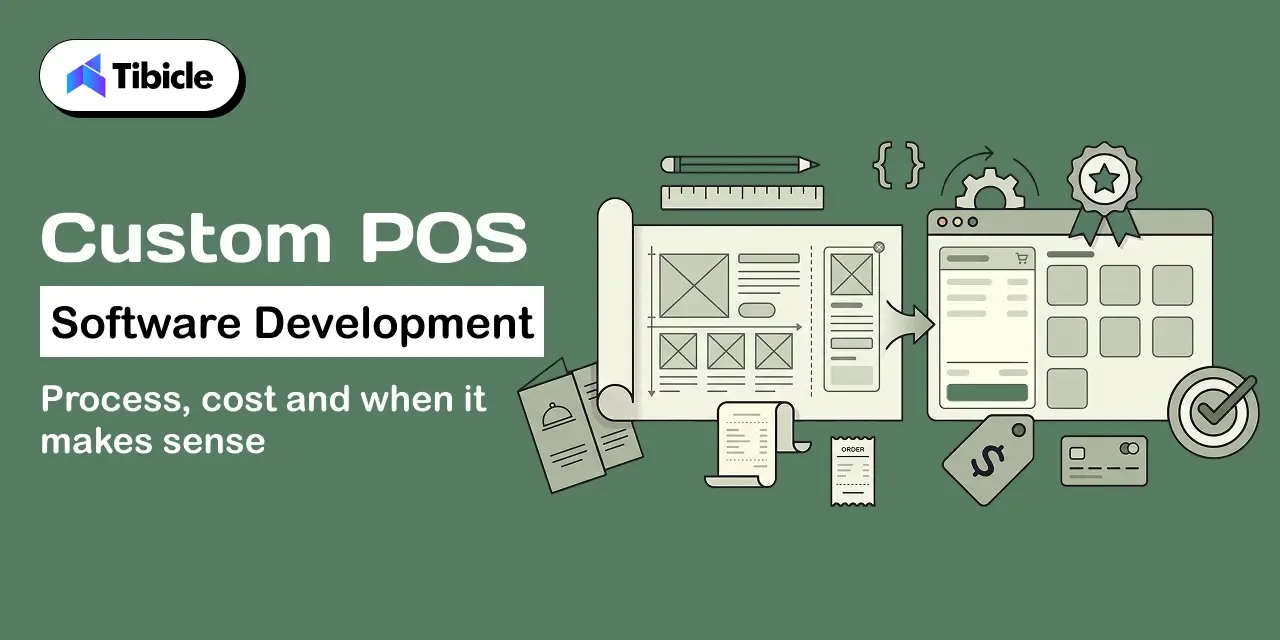
Ready to match your operation size and cost structure to the right platform? Book a free inventory software consultation or contact Tibicle for a custom build assessment.

Frequently Asked Questions

What is restaurant inventory management software and how does it differ from a standard POS?
A POS records sales transactions. Restaurant inventory management software tracks what those sales consume, depleting stock, updating recipe costs, and flagging when actual usage diverges from theoretical. Most modern platforms integrate with POS systems rather than replacing them. The two systems serve different functions: one captures revenue, the other controls cost.
How much should be budgeted for Restaurant inventory management software in 2026?
Single-location restaurants typically spend $149 to $400 per month. Multi-unit groups of 3 to 10 locations should budget $800 to $2,500 per month depending on platform and feature tier. Enterprise chains on platforms like Crunchtime start above $5,000 per month. Add 15 to 20% for setup fees, onboarding, and integration configuration when building an initial budget.

How long does it take to see ROI after implementing inventory software?
Most operators see measurable food cost improvement within 30 to 60 days. Full payback on software cost typically occurs within 3 to 6 months for independent restaurants and faster for multi-unit groups where food cost variance is already high. The operators who see the slowest payback are typically the ones who underinvested in data setup and staff training during implementation.
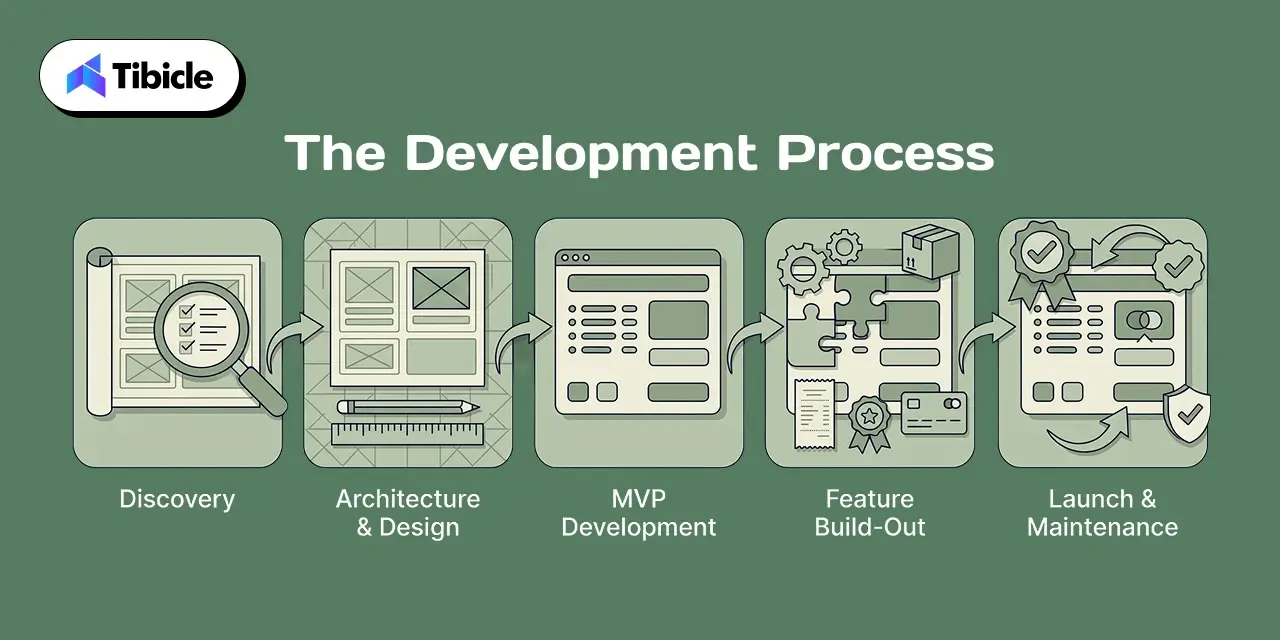
What’s the biggest mistake made when choosing restaurant inventory management software?
Choosing a platform designed for their current size rather than the size they plan to be in 24 to 36 months. A platform migration mid-growth is expensive in time, money, and operational disruption. Evaluating vendors against a 3-year growth plan rather than today’s footprint is one of the highest-value decisions operators can make in this process.

Can restaurant inventory management software integrate with accounting tools like QuickBooks?
Yes. Most platforms, including MarketMan, MarginEdge, and Restaurant365, support integrations with QuickBooks, Sage, and other accounting software. Restaurant365 replaces accounting software entirely for operators who prefer a consolidated system. Verify integration compatibility and sync frequency directly with vendors before committing; not all integrations perform equally.

When does it make sense to build custom inventory software instead of buying off-the-shelf?
When your operation has non-standard workflows, multiple kitchen formats, proprietary supplier contracts, or multi-brand aggregation, that standard platforms can’t accommodate without expensive workarounds. Custom development becomes cost-competitive above a certain complexity threshold, typically when the cost of platform customization and ongoing workarounds approaches the cost of a purpose-built system.

App Development Cost 2026: Complete Pricing Strategies

Introduction

The mobile app development market is valued at $305 billion in 2026, growing at a 15.18% CAGR (Mordor Intelligence). Yet despite this massive opportunity, incorrect budgeting remains the number one reason app projects fail mid-build. Understanding App Development Cost 2026: Complete Pricing Strategies is now essential for any business planning a digital product because what you don’t know about pricing can derail your entire roadmap.

Cross-platform development cost

App development cost ranges from $15,000 to $500,000+, and that gap is not random. It is driven by platform choice, feature complexity, team location, and the vendor you choose to build with.

For executives evaluating build vs. buy, the real question is not “how much does it cost?” but “how much per unit of business value?”

This guide breaks down app development cost by complexity, platform, region, and business model, complete with ROI benchmarks and vendor selection criteria so you can plan your app development budget with confidence.

What Determines App Development Cost in 2026?

Cross-platform development cost

Understanding mobile app development cost starts with knowing which factors carry the most weight.

Cost DriverBudget Impact
Feature complexity and screen countHigh
Backend architectureHigh
Platform choice (Native vs. Cross-Platform)High
Team structure (In-house vs. Offshore)High
Third-party integrationsMedium
UI/UX design complexityMedium
QA and testingMedium
App Store complianceLow

Feature Complexity and Screen Count

The more screens, interactions, and logic your app requires, the higher the app development cost. A simple 5–8 screen app is a fraction of the cost of a 30+ screen enterprise platform with custom workflows.

Platform Choice: Native vs. Cross-Platform vs. PWA

Building for iOS only, Android only, or both affects how many development hours are required. Cross-platform frameworks like Flutter and React Native allow a single codebase to run on both platforms, directly reducing the cost to build an app.

Backend Architecture and Third-Party Integrations

Apps that require custom APIs, real-time databases, payment gateways, or CRM integrations add significant development time. The more complex the backend, the higher the app development pricing.

Team Structure In-House vs. Outsourced vs. Hybrid

An in-house team in North America costs significantly more per hour than an equally skilled offshore team in South Asia or Eastern Europe. Team structure is one of the most direct levers on your total app development budget.

App Development Cost Breakdown by Complexity Level

Cross-platform development cost

Complexity TierFeaturesTimelineCost RangeBest For
Simple5–8 screens, basic auth, no backend1–3 months$15K–$30KMVPs, prototypes, internal tools
Moderate10–20 screens, API integrations3–6 months$30K–$75KStartups, SMB apps, consumer apps
Complex20–40 screens, custom 6–9 months$75K–$150KSaaS platforms, marketplaces
Enterprise40+ screens, AI, compliance9–18 months$150K–$500K+Large orgs, regulated industries

Simple Apps ($15K–$30K)

Simple apps typically include 5 to 8 screens, basic user authentication, and minimal or no custom backend. These are ideal for MVPs, internal tools, and proof-of-concept builds. Timeline is 1 to 3 months.

Moderate Apps ($30K–$75K)

Moderate apps include 10 to 20 screens, third-party API integrations, push notifications, and basic analytics. This is the most common range for startups and small business consumer apps. Timeline is 3 to 6 months.

Complex Apps ($75K–$150K)

Complex apps require 20 to 40 screens, custom backend logic, payment processing, real-time features, and more advanced UI. This tier covers SaaS platforms, two-sided marketplaces, and apps with role-based access. Timeline is 6 to 9 months.

Enterprise-Grade Apps ($150K–$500K+)

Enterprise apps include 40+ screens, AI/ML integrations, compliance requirements (HIPAA, GDPR), advanced security, and deep third-party system connections. These projects are built for large organizations in regulated industries and take 9 to 18 months.

How Platform Selection Impacts App Development Pricing

Platform Selection

iOS vs. Android vs. Cross-Platform (Flutter / React Native)

Native iOS development uses Swift; native Android uses Kotlin. Building both natively means two separate codebases, two teams, and roughly double the hours. Cross-platform frameworks like Flutter and React Native use a single shared codebase to deploy to both platforms, significantly reducing total app development costs.

Why Cross-Platform Reduces Cost by 30–40% in 2026

In 2026, cross-platform development frameworks now cover approximately 90% of use cases across more than 700 projects (Mobulous, 2026). Shared logic, shared UI components, and a single QA process make Flutter vs React Native cost comparisons nearly identical both deliver substantial savings over native.

Stat: Cross-platform frameworks now cover 90% of use cases (Mobulous, 2026 data from 700+ projects).

When Native Development Justifies the Premium

Native development is the right call when your app relies on platform-specific hardware features (ARKit, advanced Bluetooth, NFC), requires maximum runtime performance, or targets a single platform exclusively. For everything else, the cross-platform development cost is lower with no compromise in quality.

App Development Cost by Region: Global Rate Comparison

RegionAvg. Hourly RateProject Cost RangeQuality Benchmark
North America$100–$250/hr$80K–$500K+Highest rates, premium talent
Western Europe$80–$180/hr$60K–$400KStrong engineering culture
Eastern Europe$40–$80/hr$30K–$150KHigh quality, growing supply
South Asia / India$20–$50/hr$15K–$80KLarge talent pool, cost-efficient

Stat: Offshore development cuts total project cost by 40–70% (Cynoteck, 2026).

North America ($100–$250/hr)

North American development teams offer proximity, cultural alignment, and deep enterprise experience. The trade-off is the highest hourly rate in any region, making it the least cost-efficient for large-scale projects.

Western Europe ($80–$180/hr)

Western European agencies provide strong engineering quality, EU data compliance expertise, and good English communication. Rates sit below North America but above Eastern Europe.

Eastern Europe ($40–$80/hr)

Eastern European developers, particularly in Poland, Ukraine, and Romania, are known for strong technical skills and high-quality delivery. This region offers an excellent balance of quality and cost for mobile app development cost reduction.

South Asia / India ($20–$50/hr)

India has the largest offshore development talent pool in the world. At $20 to $50 per hour, it is the most cost-efficient option for app development. Vet vendors carefully for communication processes and portfolio depth in your industry vertical.

That Inflate Hidden Costs Your App Development Budget

Stat: Add a 20–30% buffer to initial estimates (GoodFirms, 2026 survey of 267 companies).

QA and Testing (Often Underbudgeted by 20–30%)

Quality assurance is routinely underestimated. Manual testing, automated test suites, device compatibility testing, and regression testing add 15 to 25% to total development hours. Skipping this inflates post-launch bug costs dramatically.

Post-Launch Maintenance (15–20% of Initial Cost Annually)

App maintenance cost is an ongoing line item. OS updates, security patches, dependency upgrades, and new device support typically cost 15 to 20% of the original build cost every year. This is a critical component of your long-term app development budget.

Third-Party API and Cloud Infrastructure Scaling

API usage fees, cloud hosting (AWS, GCP, Azure), CDN costs, and database scaling charges are often excluded from initial quotes. These can grow significantly as your user base scales.

App Store Fees and Compliance Costs

Apple charges a $99/year developer fee for App Store distribution. Google Play charges a one-time $25 fee. GDPR, HIPAA, or PCI compliance requirements can add $5,000 to $50,000+ in legal and technical implementation costs depending on your industry.

App Development Pricing Models: Which Works for Your Business?

Fixed Price vs. Time & Material vs. Dedicated Team

Fixed Price: Best for well-defined scopes with minimal change expected. Provides cost certainty but reduces flexibility mid-build.

Time & Material: Best for evolving scopes where requirements may shift. You pay for actual hours worked with full flexibility, but costs can run over without close management.

Dedicated Team: Best for long-term product development. You hire a fully managed remote team at a monthly rate. This model works well for ongoing product iteration post-launch.

MVP-First Approach: How Phased Development Saves Up to 40%

The most effective cost control strategy in app development pricing is building an MVP first. Ship the core functionality, validate with real users, then invest in additional features based on actual data. Companies using an MVP-first and iterative scaling approach achieve up to 40% total cost savings (GoodFirms, 2026).

Cost-Quality Tradeoffs Every Executive Should Know

Choosing the lowest hourly rate without vetting quality leads to rework costs that often exceed what a stronger vendor would have charged. App development pricing is not just about hourly rates, it is about hours-to-outcome efficiency.

ROI of App Development: When Does Your Investment Pay Back?

AI-powered apps generate $3.70 ROI per dollar invested (Fullview, 2026), with order values running 10–50% higher than mobile web (CMARIX, 2026). Companies that adopt an MVP-first approach with iterative scaling achieve 40% cost savings (GoodFirms).

Revenue Impact Apps Generate 20–30% More Revenue Than Mobile Web

Apps outperform mobile web on conversion rate, session duration, and average order value. Businesses that shift from mobile web to a dedicated app consistently see revenue lifts of 20 to 30%.

Customer Retention Gains (30% Higher with Personalized App Experiences)

Push notifications, in-app personalization, and loyalty integrations drive 30% higher retention rates compared to mobile web experiences. Retention directly reduces customer acquisition cost over time, compounding your ROI.

Operational Efficiency AI Integration Cuts Costs Across Workflows

AI app development cost is higher upfront, but the operational return is significant. AI features like automated customer support, intelligent search, and predictive analytics reduce manual workload and operational overhead across teams.

Payback Timeline: Most Businesses Recoup Costs in 6–18 Months

For consumer apps with moderate adoption, the payback window is typically 6 to 12 months. For enterprise apps that replace manual processes, payback can occur in as little as 3 to 6 months. Even conservative projections support app investment for businesses with an active digital customer base.

Common Risks and Challenges in App Development Budgeting

Scope Creep and Feature Bloat

The single biggest budget risk in app development is scope creep, the gradual addition of unplanned features mid-build. Each new feature adds design, development, and QA hours. Lock scope before development begins and manage change requests through a formal process.

Vendor Lock-In with Proprietary Tech Stacks

Some vendors build on proprietary frameworks or tightly controlled codebases that make switching vendors expensive. Always confirm that your codebase is yours, that the tech stack is standard and open, and that documentation is thorough.

Underestimating Post-Launch Costs

The app does not stop costing money at launch. App maintenance cost, hosting, analytics tools, and ongoing feature development are recurring costs. Budget for at least two years of post-launch investment when calculating total cost of ownership.

Choosing Price Over Execution Quality

Low hourly rates are attractive, but poor-quality code creates technical debt that costs more to fix than it saved. Evaluate vendors on portfolio quality, communication processes, and reference checks, not just rate cards.

Vendor Selection Checklist: How to Choose the Right App Development Partner

Technical Expertise and Stack Alignment: What to verify: Does the vendor have proven expertise in Flutter, React Native, Swift, or Kotlin? Ask for code samples or GitHub repositories.

Portfolio Depth in Your Industry Vertical: What to verify: Has the vendor built apps in your industry (healthcare, fintech, retail, logistics)? Domain experience reduces build time and compliance risk.

Pricing Transparency and Contract Structure: What to verify: Is the quote itemized by phase and deliverable? Is the pricing model (fixed, T&M, dedicated) clearly defined and matched to your project type?

Post-Launch Support and SLA Commitments: What to verify: Does the vendor offer a defined support and maintenance plan post-launch? What are the response time SLAs for critical bugs?

Cultural Fit and Communication Cadence: What to verify: How often will you receive updates? What project management tools are used? Is there a dedicated point of contact?

Need a development partner who delivers on budget, on spec, and on time? Talk to Tibicle’s team for a free project estimate.

Why Tibicle Is a Strong Choice for App Development

Strong Choice

Tibicle specializes in Flutter and cross-platform app development the frameworks that consistently deliver 30 to 40% cost savings compared to native builds. For businesses managing tight timelines and defined budgets, this matters.

The team brings industry-specific experience across multiple verticals, reducing the ramp-up time that inflates early-project costs. Tibicle’s MVP-first methodology means you validate before you fully invest, directly aligning with the phased development approach that GoodFirms identifies as the top cost-saving strategy in 2026.

What makes Tibicle different from generic development shops is transparent, itemized pricing tied to deliverables, not just hourly burn rates, and a post-launch support model that covers the maintenance costs most vendors leave unaddressed.

For organizations that need app development cost predictability alongside product quality, Tibicle’s approach closes the gap between what you budget and what you actually spend.

Explore Tibicle’s app development case studies and pricing models.

Conclusion

App development cost in 2026 ranges from $15,000 to $500,000+. But the right budget for your project depends on scope, platform choice, team location, and the partner you select not just how many features you want.

Phased development, cross-platform frameworks, and strategic vendor selection consistently reduce total app development cost while protecting ROI. Businesses that plan for hidden costs, budget for post-launch maintenance, and evaluate vendors on execution quality outperform those that optimize for the lowest initial quote.

Get a custom app development cost estimate from Tibicle built around your business goals, not generic templates.

FAQs

How much does it cost to develop a mobile app in 2026?
Mobile app development cost in 2026 ranges from $15,000 for simple apps to $500,000+ for enterprise-grade platforms. The final cost depends on complexity, platform, team location, and feature set. Most mid-range business apps fall between $30,000 and $150,000.

What is the cheapest way to build an app without sacrificing quality?
The most cost-effective approach is to start with an MVP, use a cross-platform framework like Flutter or React Native, and partner with a vetted offshore or nearshore team. This combination can reduce the cost to build an app by 40 to 60% compared to a full native build with an in-house North American team.

How long does app development take from MVP to full launch?
An MVP typically takes 1 to 3 months. A full product launch with all core features takes 3 to 9 months, depending on complexity. Enterprise apps with compliance requirements and deep integrations can take 12 to 18 months from kickoff to launch.

Is cross-platform app development cheaper than native in 2026?
 Yes. Cross-platform development cost is 30 to 40% lower than building separate native apps for iOS and Android. Frameworks like Flutter and React Native now cover 90% of use cases, making native development the exception rather than the rule for most business applications.

What hidden costs should I budget for after app launch?
Budget for app maintenance cost (15 to 20% of initial build cost annually), cloud infrastructure and API usage fees, App Store and Play Store compliance updates, OS upgrade compatibility, and ongoing feature development. A 20 to 30% buffer on top of your initial estimate is recommended.

How do I calculate the ROI of my app development investment?
 Start with projected incremental revenue (conversion rate improvement, higher average order value, new revenue channels), subtract total app development cost and annual maintenance, then divide by total investment. Most businesses see payback in 6 to 18 months. AI-powered apps generate approximately $3.70 in ROI per dollar invested, according to 2026 data from Fullview.

Best Restaurant Accounting Software in 2026

Introduction

With restaurant profit margins averaging just 3-5%, a single mistake in food cost tracking, payroll reporting, or inventory accounting can erase an entire week’s profit. Restaurant accounting software helps operators improve financial accuracy and gain better control over these critical areas. As restaurants expand operations, spreadsheets and manual bookkeeping become increasingly difficult to manage, creating costly reporting errors and operational blind spots.

restaurant accounting software

For operators managing a single location or a growing restaurant group, choosing the right restaurant software is no longer just an accounting decision. It affects inventory visibility, labor cost control, vendor management, compliance, and overall profitability.

This article is designed as a decision-making resource rather than a simple list of software. Whether you’re evaluating your first accounting platform or replacing an existing system, you’ll learn which features matter most, how pricing works, where ROI comes from, and which platforms fit different restaurant business models.

What Is Restaurant Accounting Software and Why Generic Tools Fall Short

Restaurant accounting software is a financial management platform built specifically for restaurant operations. Unlike general accounting systems, these platforms connect financial reporting with food cost management, labor tracking, inventory control, payroll processing, and POS integrations.

The objective is not just to manage bookkeeping but to provide operators with real-time visibility into the metrics that directly impact profitability. This includes prime cost tracking, recipe costing, inventory variance monitoring, and multi-location reporting.

While generic accounting tools can manage basic bookkeeping, restaurants operate under unique conditions involving perishable inventory, fluctuating labor costs, tip management, and daily sales synchronization. These operational requirements often exceed the capabilities of traditional accounting software.

How Restaurant Accounting Software Differs From Standard Accounting Software

Traditional accounting platforms focus on general financial reporting using standard charts of accounts. Restaurant accounting software extends these capabilities with restaurant-specific financial structures designed around food and labor performance.

Purpose-built restaurant systems include food cost percentage tracking, recipe-level costing, inventory depletion monitoring, shift-based payroll management, and tip distribution workflows. These capabilities often require multiple third-party add-ons when using general accounting platforms.

The result is a more accurate operational picture and faster decision-making across both finance and restaurant operations teams.

The Real Cost of Manual Bookkeeping

Many operators underestimate the cost of manual accounting processes. Restaurant managers frequently spend more than 10 hours per week reconciling sales reports, reviewing invoices, and updating inventory records.

Manual processes increase the risk of payroll mistakes, inventory shrinkage, tax filing errors, and delayed reporting. These issues often cost significantly more than the software itself.

For most restaurants, purpose-built accounting software generates value through operational accuracy, time savings, and margin protection long before considering labor reductions.

Must-Have Features for Modern Restaurant Accounting Software Finance Teams

restaurant accounting software

Not all accounting systems are designed for restaurant operations. Before comparing vendors, operators should focus on the capabilities that directly affect profitability and operational control.

POS Integration in Restaurant Accounting Software

One of the most important requirements is seamless integration between the POS system and the accounting platform. Daily sales data should flow automatically from front-of-house operations into the general ledger without requiring manual data entry.

Leading platforms integrate with systems such as Toast, Square, Lightspeed, Clover, and Revel. Without proper integration, operators often face reporting delays, duplicate data entry, and reconciliation errors.

Real-time synchronization ensures financial reports reflect actual sales activity while reducing administrative workload.

Prime Cost Tracking and COGS Management

Prime cost remains one of the most important restaurant performance metrics. It combines labor expenses and cost of goods sold (COGS) and should generally remain below 60–65% of total revenue.

Advanced restaurant accounting software automatically updates COGS calculations based on inventory consumption and recipe costing data. Instead of reviewing food costs monthly, operators can monitor profitability trends daily.

This visibility allows managers to identify margin erosion before it becomes a major financial issue.

Accounts Payable Automation and Vendor Management

Restaurants often manage dozens of supplier relationships simultaneously. Manual invoice processing can quickly become overwhelming as location count increases.

Modern restaurant accounting software automates invoice capture, coding, approval routing, and payment tracking. Many systems also provide vendor price monitoring and purchase order reconciliation capabilities.

For multi-location operators, AP automation reduces administrative workload while improving purchasing consistency across locations.

Payroll Integration, Tip Reporting, and Compliance

Labor expenses represent one of the largest operating costs in any restaurant. Effective restaurant accounting software should connect payroll data directly to financial reporting systems.

Features such as tip distribution management, overtime tracking, wage compliance monitoring, and payroll reconciliation help reduce administrative burden and compliance risk.

Whether using built-in payroll functionality or integrating with dedicated payroll platforms, operators should ensure labor data flows seamlessly into financial reporting.

Use Cases by Restaurant Type

Not every restaurant requires the same accounting platform. The ideal solution depends on location count, annual revenue, reporting complexity, and operational structure.

Independent Single-Location Restaurants ($500K–$1.5M Revenue)

Single-location operators typically prioritize simplicity, affordability, and ease of use. They often work with external bookkeepers or part-time accounting support, making user-friendly software essential.

For this segment, QuickBooks Online paired with a reliable POS integration often provides sufficient functionality. Operators gain access to financial reporting, expense tracking, and bank reconciliation without the higher costs associated with enterprise restaurant systems.

The primary risk at this stage is underinvesting in inventory management and food cost visibility, which can gradually erode margins without being immediately noticeable.

Multi-Location Groups and Regional Chains (3–15 Locations)

As restaurants expand, financial complexity increases significantly. Operators need consolidated reporting, centralized purchasing controls, location-level P&Ls, and standardized accounting processes.

At this scale, general accounting software often creates data silos that require manual consolidation and reconciliation. Restaurant-specific platforms such as Restaurant365 become more attractive because they combine accounting, inventory management, AP automation, and operational reporting within a single system.

Many multi-location operators report inventory variance reductions from approximately 8% to 3% after implementing centralized purchasing and inventory controls.

Franchise Operators and Enterprise Restaurant Groups (15+ Locations)

Enterprise operators require ERP-level capabilities. Financial consolidation, audit readiness, compliance reporting, and multi-entity management become critical business requirements.

These organizations frequently integrate accounting systems with HR platforms, scheduling software, supply chain tools, and business intelligence dashboards.

Platforms such as Restaurant365 and Sage Intacct Hospitality are commonly deployed because they support large-scale financial operations while maintaining visibility across locations and business entities.

Restaurant Accounting Software Comparison

restaurant accounting software

Choosing the best restaurant accounting software requires understanding the trade-offs between flexibility, functionality, and cost.

General-Purpose vs. Restaurant-Specific: The Core Trade-Off

General-purpose accounting systems such as QuickBooks Online and Xero provide affordability, accountant familiarity, and extensive integration ecosystems. However, restaurants often need additional software to handle inventory costing, recipe management, and food cost tracking.

Restaurant-specific platforms such as Restaurant365 deliver these capabilities natively. Operators gain better operational visibility but must accept higher subscription costs and more complex implementations.

Neither option is universally superior. The best choice depends on restaurant size, operational complexity, and growth plans.

Restaurant Accounting Software Feature Comparison

FeatureQuickBooks OnlineXeroRestaurant365MarginEdge
Restaurant-Specific General LedgerPartial
Prime Cost TrackingManualManualAutomatedAutomated
Inventory & Recipe CostingAdd-onAdd-onNativeNative
POS Integrations100+800+ Apps80+ DedicatedPOS Linked
PayrollAdd-onAdd-onNativeRequires QBO/Sage
AP AutomationPartialPartialFullFull
Multi-Location ReportingLimitedModerateStrongModerate
Starting Price / Month~$38~$25~$289~$350
Best FitSingle LocationFlexible Scaling3+ LocationsQBO Enhancement

Pricing changes frequently and should always be verified directly through vendor websites before making purchasing decisions.

Which Platform Fits Your Restaurant?

  • QuickBooks Online: Best for independent operators and smaller restaurants.
  • Xero: Ideal for businesses wanting flexibility and international support.
  • Restaurant365: Best for multi-location groups requiring centralized operations.
  • MarginEdge: Excellent for operators focused on food cost management and AP automation without replacing their accounting platform.

Not sure which platform fits your operation? Talk to Tibicle’s restaurant technology team, and we’ll help map the right accounting stack to your revenue, growth plans, and operational complexity.

Restaurant Accounting Software Pricing and Total Cost of Ownership

restaurant accounting software

One of the biggest mistakes restaurant operators make is underestimating the true cost of ownership. Subscription pricing is only one part of the overall investment.

Pricing by Restaurant Size and Complexity

Single Location Under $1.5M Revenue

Most operators spend approximately:

  • QuickBooks Online Essentials: $35–$50/month
  • POS Integration: $20–$50/month
  • Additional Reporting Tools: Optional

Estimated Total: $90–$120/month

Single Full-Service Restaurant ($1.5M–$3M Revenue)

Restaurants requiring stronger inventory controls often combine:

  • QuickBooks Online Plus
  • MarginEdge
  • POS Integrations

Estimated Total: Around $450–$500/month

Multi-Location Restaurant Group ($4M–$8M Revenue)

Restaurant365 becomes financially viable at this stage due to centralized reporting and operational controls.

Estimated Total: $1,800–$2,400/month, depending on modules and location count.

Enterprise Restaurant Operations (8+ Locations)

ERP-level pricing becomes common.

Expect:

  • Custom implementation fees
  • Per-location pricing
  • Enterprise support contracts

Most vendors provide quote-based pricing for these deployments.

Hidden Costs Restaurant Operators Often Overlook

Software subscriptions rarely represent the full investment.

Common hidden expenses include:

  • Per-user licensing fees
  • Middleware and POS integration costs
  • Implementation services
  • Data migration fees
  • Training and onboarding expenses
  • Payroll modules
  • Scheduling software integrations
  • Inventory management add-ons
  • Annual contract commitments

Evaluating the total cost of ownership before signing a contract prevents unexpected expenses later.

Measuring the Financial ROI of Your Restaurant Accounting Software Platform

For restaurant operators and finance leaders, software should not be evaluated solely on subscription cost. The real question is whether the platform improves profitability, reduces operational inefficiencies, and provides visibility into critical business metrics.

The best restaurant accounting software pays for itself through margin recovery, labor savings, inventory control, and financial accuracy.

Where the Return Comes From

One of the biggest sources of ROI comes from food cost management. Restaurants tracking actual versus theoretical food costs at the recipe level often recover between 1.5–3% in margin by identifying waste, theft, supplier price increases, and portion inconsistencies.

For example, a restaurant generating $1.7M in annual revenue could recover more than $25,000 annually simply by identifying invoice price creep and inventory variance.

Additional ROI drivers include:

  • Faster month-end reconciliation
  • Reduced payroll errors
  • Better labor cost visibility
  • Automated invoice processing
  • Lower inventory variance
  • Improved purchasing controls

Restaurants using integrated POS and accounting systems frequently reduce monthly reconciliation time from approximately 40 hours to less than 15 hours.

When Does Restaurant Accounting Software Pay for Itself?

Operators should calculate ROI using:

Current Accounting Labor Costs + Error Exposure + Margin Recovery Opportunities

For multi-location groups, Restaurant365 often reaches positive ROI within 9–14 months because of improvements in prime cost tracking and operational reporting.

For smaller operators generating under $1.5M annually, enterprise-grade systems may create negative ROI due to higher subscription costs. In these situations, QuickBooks Online with restaurant-focused add-ons typically remains the smarter option.

A useful benchmark:

Every 1% improvement in food cost percentage on $2M annual revenue equals approximately $20,000 in recovered margin.

KPIs to Track After Implementation

Monitor these metrics consistently:

  • Prime Cost Percentage
  • Inventory Variance
  • Days to Close Monthly Books
  • Labor Cost Percentage
  • Days Payable Outstanding
  • Payroll Errors
  • Overtime Variance

Weekly tracking generally delivers better operational results than monthly reporting.

Risks and Challenges of Switching Accounting Platforms

Changing accounting systems can improve visibility and efficiency, but implementation challenges should not be underestimated.

Data Migration and Historical Records

Migrating years of financial records requires careful planning.

Operators should review:

  • Chart of Accounts
  • Vendor Records
  • Payroll History
  • Open AP Invoices
  • Unreconciled Transactions
  • Tax Reporting Data

Single-location restaurants typically complete migration within 2–4 weeks. Multi-location groups often require 6-10 weeks, depending on reporting complexity.

Integration Failures and POS Compatibility Issues

Many accounting vendors advertise POS compatibility, but actual integration depth varies significantly.

Before selecting a platform, verify:

  • Native integration availability
  • Middleware requirements
  • Data synchronization frequency
  • Payroll integration support
  • Inventory data flow

Poor integrations often create duplicate data entry, reconciliation problems, and reporting inconsistencies.

Staff Adoption and Training Challenges

Technology only works when teams use it correctly.

A common post-implementation issue involves managers entering invoice and inventory data incorrectly, creating inaccurate reporting and inventory variance.

Successful implementations typically include:

  • Role-based training
  • Dedicated onboarding sessions
  • Documentation and SOPs
  • Ongoing support during the first 90 days

Investing in training often produces a higher ROI than investing in additional software modules.

Vendor Selection Checklist: What to Evaluate Before You Sign

Selecting software based solely on features or pricing often leads to expensive mistakes.

12-Point Evaluation Framework

Before signing any agreement, ask:

  1. Does the platform support your POS system natively?
  2. Is prime cost tracking included or sold separately?
  3. Can it generate per-location P&Ls automatically?
  4. What is the true monthly cost, including integrations?
  5. Is inventory and recipe costing built-in?
  6. Does AP automation support multiple vendors?
  7. Is pricing annual or month-to-month?
  8. What does implementation cost?
  9. How long does migration take?
  10. Does it support multi-entity reporting?
  11. Can it handle tip reporting and labor compliance?
  12. What uptime guarantees and support SLAs are offered?

The answers often reveal more than marketing materials.

Top Accounting Platforms for Restaurants in 2026

Restaurants

Restaurant365 – Best for Multi-Location Restaurant Groups

Restaurant365 combines accounting, inventory, payroll, scheduling, and AP automation into a single platform.

Strengths:

  • Native restaurant general ledger
  • Prime cost tracking
  • Inventory management
  • Payroll integration
  • Multi-location reporting

Best Fit:
Restaurants operating 3+ locations or generating more than $4M annually.

QuickBooks Online – Best Entry Point for Single-Location Operators

QuickBooks remains one of the most widely used accounting platforms because of its simplicity and accountant familiarity.

Strengths:

  • Low entry cost
  • Broad accountant adoption
  • Extensive integrations

Limitations:

  • Requires add-ons for recipe costing
  • Limited restaurant-specific reporting

Best Fit:
Independent restaurants under $1.5M revenue.

MarginEdge – Best for Food Cost Control

MarginEdge is not a standalone accounting platform but serves as a powerful operational layer.

Strengths:

  • Invoice automation
  • Recipe costing
  • Food cost visibility
  • Inventory management

Best Fit:
Operators want stronger food cost controls without replacing QuickBooks.

Xero – Best for Flexible Cloud Accounting

Xero offers a modern interface and an extensive integration ecosystem.

Strengths:

  • Cloud-native architecture
  • Strong bank reconciliation
  • Multi-currency support
  • Large app marketplace

Limitations:

  • Requires third-party restaurant tools

Best Fit:
Restaurant groups need flexibility and international support.

Why Tibicle LLP Is a Strong Fit for Restaurant Accounting Software Implementation

Restaurant accounting software often fails not because of the platform itself, but because integrations between POS systems, payroll tools, inventory management software, and accounting systems are poorly configured.

Tibicle helps restaurant operators solve these integration challenges by building custom middleware, automating data flows, and creating reporting environments that connect multiple systems into a unified operational stack.

For multi-location groups, franchise operators, and growing restaurant brands, Tibicle can help:

  • Integrate POS and accounting platforms
  • Build custom reporting dashboards
  • Automate financial data pipelines
  • Improve operational visibility
  • Reduce manual reconciliation work

Rather than focusing solely on software selection, Tibicle helps restaurants build an accounting ecosystem that scales with growth.

Evaluating your restaurant accounting stack? Tibicle’s team can help assess your current systems and recommend the right integration architecture.

Conclusion

The best restaurant accounting software is not necessarily the platform with the most features. The right choice depends on your location count, revenue level, operational complexity, and growth plans.

Single-location operators often achieve excellent results with QuickBooks Online and targeted integrations. Multi-location groups generally benefit from restaurant-specific platforms that provide stronger inventory, labor, and operational visibility.

Ultimately, the strongest ROI comes from margin recovery, inventory control, and operational efficiency, not simply from reducing bookkeeping hours.

Ready to build a restaurant accounting stack that closes the books faster and improves profitability? Talk to Tibicle’s team today.

FAQs

What is restaurant accounting software?
Restaurant accounting software is a financial management system designed specifically for restaurants. It combines accounting, payroll, inventory tracking, prime cost management, and POS integration into a single platform.

How much does restaurant accounting software cost?
Pricing ranges from approximately $25-$120 per month for general-purpose tools like QuickBooks Online or Xero to $1,800-$2,400+ monthly for multi-location systems such as Restaurant365.

Is QuickBooks good for restaurants? 
Yes, particularly for single-location operators under $1.5M in annual revenue. However, larger operations often require additional tools for inventory and food cost management.

What is prime cost in restaurant accounting software?
Prime cost equals Cost of Goods Sold (COGS) plus total labor expenses. Industry benchmarks recommend maintaining prime cost below 60–65% of sales.

Can restaurant accounting software integrate with my POS?
Most modern platforms integrate with major POS systems such as Toast, Square, Lightspeed, Clover, and Revel, although integration depth varies.

When should a restaurant switch from QuickBooks to Restaurant365?
Most operators consider switching when they reach three or more locations, experience inventory management challenges, or require consolidated multi-location financial reporting.

5 Best Inventory Management Apps in 2026

Introduction

An inventory management apps is now a critical tool for businesses looking to reduce stockouts, improve inventory visibility, and scale operations efficiently. In 2023, inventory distortion, stemming from stockouts and overstocking, cost global retailers $1.77 trillion. This makes inventory management a critical operational decision. Despite this, 43% of companies still rely on spreadsheets for inventory visibility in 2026.

inventory management app

The inventory management software market is projected to reach $2.75 billion in 2026, growing at a 9.13% CAGR through 2034, driven by the increasing complexity of managing multiple channels and SKUs. Inefficient inventory practices can lead to an 11% loss in annual revenue.

For decision-makers, the challenge lies not in whether to invest in an inventory management app, but in choosing the right one from a crowded market with seemingly similar features and hidden costs. This manual reviews the 5 best inventory management apps of 2026, focusing on features, pricing, ROI, scalability, and use-case fit, to support informed decision-making.

What Is an Inventory Management Apps?

Core Functions That Define an Inventory Management Apps

inventory management app

An inventory management app is a software system that tracks stock levels, manages purchase orders, monitors warehouse activity, and synchronises inventory data across sales channels and locations in real time. At its foundation, it replaces the spreadsheet with a system that updates automatically, alerts proactively, and integrates with the other tools the business depends on.

The core functions that define a production-grade inventory management system include:

Real-time inventory tracking: live stock level visibility across all locations and channels, updated with every transaction.

Automated reorder triggers: rules-based or AI-driven purchase order generation when stock falls below defined thresholds, the foundation of reorder automation.

Demand forecasting: historical sales data and seasonal trend analysis used to predict future stock requirements and prevent both stockouts and overstocking.

Barcode and QR scanning: mobile or fixed scanner integration for fast, accurate stock intake, picking, and cycle counting without manual data entry.

Multi-location inventory sync: unified visibility across multiple warehouses, stores, and 3PL partners from a single interface.

Purchase order management: end-to-end supplier order creation, tracking, and receipt confirmation with automated matching against expected deliveries.

Businesses that implement automated inventory management reduce stockouts by 30 % compared to manual approaches. That single metric, the reduction in revenue lost to empty shelves, is typically the primary driver of payback period calculation for any inventory management investment.

It is also worth distinguishing between standalone inventory management apps and ERP-embedded inventory modules. Standalone apps, the five covered in this guide, are purpose-built for inventory operations and offer faster implementation, lower cost, and more focused functionality. ERP-embedded modules offer deeper integration across finance, HR, and operations but come with significantly higher implementation cost and complexity. The right choice depends on operational scope and growth stage.

What to Look for Before Choosing an Inventory Management Apps

Scalability and Multi-Location Support

The most common and most expensive mistake in inventory management software selection is choosing a tool that fits today and breaks in 18 months. A business operating two warehouses today may need to manage 20 in three years. A retailer selling on one channel may expand to five. The app you select needs to support that growth without requiring a full platform migration, because platform migrations at scale are expensive, disruptive, and time-consuming.

Evaluate multi-location inventory capability not just as a feature checkbox but as an architectural question. How does the app handle stock transfers between locations? Does it support zone-level tracking within a warehouse? Can it sync in real time with third-party logistics partners? Supply chain visibility at the multi-location level is where mid-market inventory management systems most frequently fall short.

Integration With Existing Business Systems

An inventory management app that does not connect cleanly to your accounting system, ecommerce platform, and CRM is an app that creates manual reconciliation work, which is precisely the problem you are trying to eliminate. Before selecting any tool, map your current technology stack and verify native integration support for every system in it.

The integrations that matter most for most businesses are: QuickBooks or Xero for accounting, Shopify or WooCommerce for ecommerce, and the shipping or logistics platforms handling fulfilment. API availability and webhook support are important for any custom integration requirements beyond the standard connector library. A vendor with a limited API or no webhook support will constrain your ability to build the connected operations infrastructure your business needs as it grows.

Total Cost of Ownership vs. Sticker Price

The monthly subscription price is rarely the number that matters. Businesses spend 25 to 35 % of their operational budgets on inventory, making even small inefficiencies costly over time. That same principle applies to the tools managing inventory: the cost that appears in the pricing page is typically a fraction of what the tool actually costs over 36 months.

The cost components that consistently catch businesses off guard are per-user fees that scale with headcount, ecommerce channel add-ons charged per integration, implementation and data migration fees that are not included in the base subscription, staff training overhead that is never line-itemed in a vendor quote, and annual price escalation clauses in multi-year contracts. Evaluate every tool on a 3-year total cost of ownership basis, not a monthly sticker price.

Comparison of leading inventory management software platforms

inventory management app

1. Cin7: Best for Multi-Channel Retail and Mid-Market Brands

Cin7 is a leading inventory management system for mid-market brands with multiple sales channels. It excels in channel integrations, offering a real-time inventory view across retail POS, ecommerce platforms, wholesale, and 3PL. For brands on Shopify, Amazon, and physical stores, Cin7 provides seamless multi-channel inventory sync, a feature that competitors often struggle to match without heavy customisation.

Key features: real-time multi-channel stock sync, advanced warehouse management with zone and bin tracking, built-in EDI for wholesale and retail compliance, demand forecasting as an add-on module, and automated purchase order management.

Pricing: starts at approximately $349 per month. Channel add-ons and per-user fees apply at higher tiers.

Limitations: native accounting integration is limited outside of Xero and QuickBooks. The demand forecasting module is an additional cost rather than included in the base subscription.

Ideal business size: mid-market retailers and wholesalers with 50 to 500 SKUs operating across two or more sales channels.

2. Zoho Inventory: Best for Growing SMBs and Multi-Marketplace Sellers

Zoho Inventory is an ideal choice for small and growing businesses needing affordable multi-channel inventory tracking. It’s particularly suited for businesses expanding to multiple marketplaces, like adding Amazon to Shopify, and requires a cost-effective solution to manage that growth.

Key features: multi-channel order and inventory management across Shopify, Amazon, eBay and others, barcode scanning with mobile app support; basic demand forecasting, native integration with Zoho Books for accounting; and automated reorder point alerts.

Pricing: starts at $39 per month, making it the most affordable option in this guide with a meaningful feature set.

Limitations: lower pricing tiers cap order volume and item count, which forces upgrades earlier than the price point suggests. The demand forecasting functionality is basic compared to that of Cin7 or NetSuite.

Ideal business size: SMBs and early-stage ecommerce brands with straightforward inventory needs and a Zoho ecosystem already in place.

3. Fishbowl: Best for Manufacturers and QuickBooks-Dependent Teams

Fishbowl is a specialised inventory management software designed for manufacturing businesses using QuickBooks. It offers unmatched integration with QuickBooks, eliminating reconciliation issues faced by other inventory management solutions. For those whose financial records rely on QuickBooks, Fishbowl provides a seamless experience.

Key features: Bill of Materials (BOM) and work order management for manufacturing, deep two-way QuickBooks sync, multi-location warehouse management, barcode scanning for shop floor and warehouse operations, and purchase order automation.

Pricing: approximately $349 per month on a SaaS model, or available as a one-time perpetual licence for businesses preferring to avoid recurring fees.

Limitations: a QuickBooks licence is effectively a prerequisite; the tool’s value proposition is substantially reduced without it. Demand forecasting capability is limited compared to AI-powered alternatives.

Ideal business size: small to mid-size manufacturers and product businesses with production operations that need BOM management alongside inventory tracking.

4. NetSuite: Best for Enterprise-Grade Operations and the Oracle Ecosystem

NetSuite stands out as the only true ERP in this comparison, ideal for enterprise-scale businesses with complex multi-entity, multi-currency, and multi-warehouse operations. Unlike standalone inventory management apps, NetSuite’s inventory system is integrated within a comprehensive financial and operational platform, allowing stock data to connect seamlessly with financial reporting, demand forecasting, procurement, and supply chain visibility.

Key features: AI-powered demand forecasting, real-time multi-location and multi-warehouse inventory, advanced financial consolidation across entities, built-in procurement and supplier management, and full supply chain visibility from PO to delivery.

Pricing: custom pricing, typically starting above $2,000 per month at mid-market scale. Implementation costs range from $10,000 to $100,000 or more depending on scope.

Limitations: the implementation cost and timeline make NetSuite inaccessible for most SMBs. The platform requires dedicated administrator resource post-launch. Total cost of ownership is significantly higher than any other option in this guide.

Ideal business size: enterprise businesses and fast-scaling mid-market companies with multi-entity operations, international presence, or complex supply chain requirements.

5. inFlow: Best for Lean Teams and Cost-Conscious Operations

inFlow is an excellent inventory tracking app for small teams seeking reliable, straightforward inventory management without unnecessary features. Its user-friendly interface stands out in its category, and it integrates seamlessly with QuickBooks and Xero for essential accounting connectivity. Ideal for lean operations managing a simple product catalog from one or two locations, inFlow provides the necessary tools without the complexity of larger platforms.

Key features: clean, user-friendly interface with low onboarding overhead, barcode scanning with mobile app, multi-location support, native QuickBooks and Xero integration, and purchase order management with supplier tracking.

Pricing: starts at $89 to $189 per month, positioned between Zoho’s entry price and the mid-market platforms.

Limitations: no demand forecasting capability. No Bill of Materials support, which rules it out for any manufacturing use case.

Ideal business size: small businesses, lean operations, and teams that prioritise ease of use and a clean interface over advanced analytics or manufacturing functionality.

Feature-by-Feature Comparison Table

The table below maps all five inventory management apps across the features that matter most to purchase decisions. Use it alongside the individual app profiles above to identify which tool aligns with your specific operational requirements.

Inventory software feature comparison

Inventory software

The table below maps all five inventory management apps across the features that matter most to purchase decisions. Use it alongside the individual app profiles above to identify which tool aligns with your specific operational requirements.

FeatureCin7Zoho InventoryFishbowlNetSuiteinFlow
Multi-Location Support
Barcode/QR Scanning
Demand ForecastingAdd-onBasicLimitedAI-poweredNo
Manufacturing (BOM)NoNo
Native Accounting IntegrationLimitedZoho BooksQuickBooksBuilt-inQuickBooks/Xero
Starting Price/mo~$349$39~$349 (one-time license available)Custom$110
Best ForMulti-channel retailGrowing SMBsManufacturersEnterpriseSmall teams

Note: Feature availability and pricing are based on published data as of 2026. Verify current pricing tiers with each vendor before committing, as subscription structures update regularly.

Which Inventory Management Apps Fits Your Business Model?

Feature parity at the surface level masks significant differences in use-case fit. The table below maps each app to the business model it serves best, based on the operational requirements that define each model.

Business TypeRecommended App(s)Key RequirementsSelection Note
Retail / eCommerceCin7, Zoho InventoryMulti-channel sync, real-time inventory, barcode scanningCin7 for multi-channel complexity; Zoho for early-stage cost control
ManufacturingFishbowl, NetSuiteBill of Materials (BOM), work order management, production trackingFishbowl for QuickBooks-dependent teams; NetSuite for full ERP scope
Wholesale / B2BCin7, NetSuiteBulk order logic, tiered pricing, multi-warehouse managementNetSuite for enterprise scale; Cin7 for mid-market efficiency
Small Business / Lean TeamsinFlow, Zoho InventorySimple interface, affordable pricing, core stock trackinginFlow for straightforward ops; Zoho for growing multi-channel sellers

Pricing Breakdown and Hidden Costs

AppBase PriceTypical Onboarding CostKey Hidden CostsBest Model Fit
Cin7~$349/mo$1,000–$3,000Channel add-ons, per-user feesMid-market retail
Zoho Inventory$39/mo$500–$1,500Order and item caps on lower tiersSMBs, startups
Fishbowl~$349/mo or one-time license$1,000–$4,000QuickBooks licence requiredManufacturers
NetSuiteCustom (typically $2,000+/mo)$10,000–$100,000+Module fees, user licencesEnterprise
inFlow$189/mo$500–$1,000Limited forecasting, no BOMLean teams

Subscription vs. One-Time Licence Models

Four of the five apps in this guide use SaaS subscription models: Cin7, Zoho Inventory, NetSuite, and inFlow. Fishbowl offers both a monthly SaaS option and a one-time perpetual license. Perpetual licenses can be cost-effective for businesses with stable inventory needs, while SaaS is ideal for those wanting regular updates and cloud access.

A common hidden cost in SaaS models is tier-based feature gating. Entry-level subscriptions on Zoho and Cin7 limit order volumes, item counts, and user seats, leading to quicker upgrades than expected. Choose your subscription tier based on an 18 to 24 month growth trajectory rather than current volume.

Implementation and Migration Costs

NetSuite implementations can range from $10,000 to $100,000 or more, depending on modules and customizations. Mid-tier tools like Cin7 and Fishbowl typically cost between $1,000 and $5,000 for onboarding, while Zoho and inFlow are more accessible at $500 to $1,500 for standard setups.

It’s important to consider additional costs that are often overlooked, including data migration, staff training (hands-on sessions for warehouse teams), and custom integration development, which can add 20 to 40 percent to the overall implementation cost.

When Free Becomes Expensive

Both Zoho Inventory and inFlow have low introductory pricing that makes them seem more affordable than Cin7 or Fishbowl initially. However, as your business grows, you’ll encounter limitations: Zoho’s $39 tier restricts users, order volume, and warehouse locations, while inFlow’s $189 tier limits user seats and reporting features. If you’re likely growing, you’ll hit these caps within 12 to 18 months and face increased upgrade costs. Always assess costs based on your projected volume in 24 months, not just your current levels.

ROI and Business Impact of Inventory Management Apps

ROI and Business

Measurable Gains From Automated Inventory

The ROI for inventory management software is backed by documented performance data across various industries. In 2025, RFID-enabled merchants improved inventory accuracy by 15 percentage points, reducing fulfillment latency to under two hours, which positively impacted customer satisfaction. Overstocking can increase storage costs by 20-30%, but automated demand forecasting and reorder automation help mitigate this.

Key operational gains post-implementation include: reduced manual labor hours through barcode scanning, fewer emergency reorders due to proactive automation, lower inventory write-offs thanks to better demand forecasting, and faster order fulfillment with real-time stock visibility that minimizes errors.

Calculating Payback Period

The payback period formula for any inventory management app investment is straightforward: annual cost of the app divided by annual savings from reduced stockouts plus labour savings plus carrying cost reduction. For most mid-market businesses, this calculation produces a payback period of 4 to 8 months.

The KPIs to track once the system is live are inventory turnover ratio (how quickly stock is sold and replaced), stockout rate (the percentage of demand that goes unfulfilled due to zero stock), and order accuracy percentage (the proportion of orders fulfilled without error). These three metrics together form the operational scorecard that confirms whether the investment is delivering its projected return.

Vendor Lock-In and Data Portability

Proprietary data formats and limited export options in inventory management software can raise switching costs if the tool underperforms or the business outgrows it. Before signing a contract, ensure that stock data, transaction history, and supplier records can be exported in standard formats (at least CSV) and that the process is documented for user access.

The risk of vendor lock-in is highest with NetSuite due to high implementation and data migration costs, making switching difficult. In contrast, Zoho and inFlow have lower implementation costs, resulting in more manageable switching expenses. Consider this alongside feature fit and pricing during your selection process.

Vendor Selection Checklist for Decision-Makers

Use this checklist when evaluating any inventory management app or custom inventory management system before committing to a purchase or build decision:

  • Does the app support your current SKU volume and your projected volume at 24-month scale?
  • Can it integrate natively with your existing ERP, accounting platform, and ecommerce stack without custom middleware?
  • What is the total 3-year cost including subscription fees, implementation, training, and add-on modules?
  • Does the vendor offer SLA-backed uptime guarantees with defined compensation for downtime events?
  • Is data exportable in standard formats (CSV and API access) without requiring vendor assistance
  • Does the platform support your industry-specific compliance requirements (food expiry tracking, serial number traceability, lot management)?
  • What is the vendor’s documented track record with businesses at your size and operational complexity?
  • Is a free trial or sandbox environment available before committing to a paid subscription?

Why Tibicle Is a Strong Choice for Custom Inventory Management Apps Development

Off-the-shelf inventory management apps solve 80 % of inventory management requirements effectively. The remaining 20% of businesses with unique workflows, industry-specific compliance requirements, or operational complexity that standard tools cannot accommodate need a custom-built inventory management system designed around their exact processes, not adapted to fit the constraints of a generic platform.

Tibicle builds custom inventory management software for mid-market businesses that have outgrown spreadsheets and generic tools but do not need or cannot justify the cost of a full NetSuite ERP implementation. Core capabilities include multi-warehouse real-time inventory sync, role-based access control for warehouse, procurement, and management functions, custom reporting dashboards built around the KPIs that matter to your operations, and API integration with any existing ERP, accounting, or ecommerce system in your stack.

The engagement model starts with a structured discovery phase that maps your current inventory workflows, identifies the specific failure points costing revenue, and produces a build scope tied directly to measurable operational outcomes. Pricing is milestone-based with transparent phase-wise breakdowns, no lump-sum quotes, and no scope ambiguity. Post-launch support is provided under a defined SLA.

Cross-industry experience across retail, manufacturing, logistics, and wholesale means the team builds with commercial context, not just technical capability. If the five apps in this guide do not fit your operational requirements, a custom inventory management app built by Tibicle might. Talk to Tibicle’s team to scope an inventory management solution that matches your exact workflow.

Conclusion

The right inventory management app for your business is determined by three variables: your current and projected operational scale, the business model you are running, and the systems your new platform needs to integrate with. There is no single best answer but there is a right answer for each business context, and this guide has laid out the data to find it.

Zoho Inventory provides the most accessible entry point for SMBs and growing ecommerce brands thanks to its affordable pricing and strong multi-channel capabilities. Mid-market retailers operating across multiple sales channels will find Cin7 to be the most balanced solution for inventory visibility and operational control. Businesses that rely heavily on QuickBooks and require manufacturing functionality should consider Fishbowl. NetSuite remains the benchmark for enterprise organisations needing a complete ERP ecosystem with advanced inventory management. Meanwhile, inFlow is an excellent fit for lean teams seeking a straightforward, cost-effective solution without the complexity of larger platforms.

Use the feature comparison table and vendor checklist in this guide as your decision tools. If none of the five apps fits your operational requirements precisely, a custom inventory management system built around your specific workflows is the alternative worth evaluating. Schedule a free consultation with Tibicle to discuss a custom inventory management app built for your business needs.

Frequently Asked Questions

What is the best inventory management app for small businesses in 2026?
Zoho Inventory and inFlow are strong options for small teams. Zoho starts at $39/month with multi-channel support, while inFlow offers a clean interface with  QuickBooks/Xero integration from $110/month.

How much does an inventory management app cost?
Pricing ranges from $39/month (Zoho Inventory) to custom enterprise pricing (NetSuite). Factor in implementation, training, and add-on fees for an accurate 3-year cost estimate.

Can an inventory management app integrate with QuickBooks?
Yes. Fishbowl offers the deepest QuickBooks integration among standalone apps. Zoho Inventory and inFlow also support QuickBooks and Xero syncing.

What ROI can I expect from an inventory management app?
Mid-market businesses typically see a 4–8 month payback period through reduced stockouts, lower carrying costs, and fewer manual labor hours.

When should a business consider custom inventory management software instead of off-the-shelf apps?
When your workflows require industry-specific compliance, multi-system integrations that existing apps don’t support, or unique reporting and automation that standard tools can’t deliver.

What is Retail Automation? ROI, Pricing, and Vendor Selection for 2026

Introduction

The global retail automation market hit $27.65 billion in 2025 and is projected to reach $77.36 billion by 2034, growing at a 12% CAGR (Fortune Business Insights). That growth rate is not a coincidence, it reflects a fundamental shift in how retail businesses manage costs, scale operations, and serve customers in an environment that no longer tolerates inefficiency.

retail automation

Retail leaders face several operational challenges today: rising labor costs, complex omnichannel fulfillment, shrinking margins, and unstable supply chains. Manual processes cannot handle these pressures efficiently.Businesses that continue managing these challenges manually are not holding stead, they are falling behind competitors who have already automated.

This guide is written specifically for executives and operations decision-makers who are evaluating retail automation as a strategic investment, not a technology experiment. It explains what retail automation is, breaks down its core types and real-world use cases, and provides the ROI benchmarks, pricing context, and vendor evaluation criteria you need to make a defensible, well-informed decision.

What is Retail Automation?

Retail automation is the use of software, artificial intelligence, robotics, IoT sensors, and integrated systems to replace or significantly reduce manual intervention in repetitive retail operations across in-store, warehouse, and digital channels.

The scope of retail automation is broader than most executives initially assume. It is not limited to self-checkout kiosks or customer-facing chatbots. Modern retail automation solutions encompass inventory management, dynamic pricing, supply chain coordination, marketing execution, order fulfillment, workforce scheduling, compliance reporting, and customer analytics. It covers the full operational stack, front-of-store, back-office, warehouse, and e-commerce simultaneously.

According to the World Economic Forum, AI services in the retail sector alone are expected to grow from $5 billion to $31 billion by 2028, underscoring how quickly intelligent automation is moving from pilot programs to core business infrastructure.

What retail automation is not: a single platform purchase, a one-time deployment, or a front-of-store novelty. The most impactful retail automation strategies address back-office efficiency, warehouse throughput, and supply chain visibility in parallel, not just the customer-facing touchpoints that tend to receive the most attention.

Core Technologies Behind Retail Automation

retail automation

Understanding the technologies behind retail automation helps decision-makers evaluate vendors. It also helps them choose solutions that match their operational needs.

AI and Machine Learning

Artificial intelligence is the analytical backbone of modern retail automation. Machine learning models drive demand forecasting, enabling retailers to predict stock requirements with significantly greater accuracy than rule-based or spreadsheet-driven approaches. AI also powers dynamic pricing, adjusting prices in real time based on demand signals, competitor data, and inventory position, and enables personalized marketing by identifying behavioral patterns across millions of customer interactions.

Data point: 84% of organizations that have invested in AI report positive ROI, according to Deloitte. In retail specifically, AI-driven retail automation has shifted from an experimental budget line to a core profitability lever for businesses operating at scale.

Robotic Process Automation (RPA)

RPA automates rule-based, high-volume tasks that previously required manual handling: data entry, invoice processing, inventory reconciliation, returns documentation, and compliance reporting. Unlike AI, RPA does not learn or adapt, it executes defined workflows reliably at scale, making it particularly valuable for back-office retail process automation where consistency and volume are the primary requirements.

The global RPA market is projected to reach $35.27 billion in 2026 (Grand View Research), driven significantly by retail and logistics adoption across both mid-market and enterprise segments.

IoT and Smart Sensors

IoT-enabled devices allow retailers to monitor inventory levels in real time, track shelf conditions, detect stockouts before they affect sales, and manage temperature-sensitive storage for perishable categories. These sensors feed live data into centralized dashboards, enabling faster and more accurate operational decisions without requiring manual floor checks or periodic audits.

Cloud Computing and Analytics

Cloud infrastructure provides the centralized data access and processing power required for cross-channel retail automation. Cloud-native platforms connect POS transactions, e-commerce activity, warehouse operations, and customer behavior into unified BI dashboards, eliminating the data silos that fragment decision-making in manually operated retail environments.

Types of Retail Automation by Function

Retail automation operates across five primary functional areas. The business case and ROI profile differ meaningfully across each, which is why implementation sequencing matters as much as platform selection.

Inventory and Warehouse Automation

Inventory automation encompasses RFID-based tracking, automated reorder triggers tied to real-time sales velocity and supplier lead time data, and goods-to-person fulfillment systems that move products through warehouses without manual picking. This area consistently delivers the fastest and most measurable ROI for mid-to-large retailers.

Stat: Over 4.6 million commercial warehouse robots will be installed worldwide by the end of 2026 (SellersCommerce), reflecting the scale at which retail warehouse automation is being deployed across the industry globally.

Checkout and Payment Automation

Self-checkout kiosks, cashierless store formats, and contactless payment systems reduce front-of-store labor dependency and decrease transaction times in ways that directly affect customer satisfaction scores. Automated retail systems in this category have moved well beyond novelty deployments.

A frequently cited real-world example: Decathlon’s RFID-based checkout system reduced average transaction time from 20 minutes to under 1 minute by allowing customers to check out an entire cart without scanning individual items, a direct result of integrated retail automation applied at the point of sale.

Marketing and Customer Engagement Automation

Automated retail systems can trigger personalized email campaigns, loyalty program notifications, and product recommendations based on real-time customer behavior, without manual campaign management for each segment. These systems connect CRM data, purchase history, and browsing behavior to deliver contextually relevant engagement at scale, turning customer data into revenue without proportional increases in marketing headcount.

Supply Chain and Order Fulfillment Automation

Retail supply chain automation extends across demand forecasting, dynamic carrier routing, and end-to-end delivery tracking. These systems reduce manual coordination between procurement, warehousing, and logistics teams, improving delivery speed and reducing the costly errors that propagate through manual handoffs across the supply chain.

Back-Office and HR Automation

Payroll processing, workforce scheduling, timekeeping, and compliance reporting are high-volume, error-prone functions that retail process automation handles efficiently. Automating these workflows reduces administrative overhead, decreases compliance exposure, and allows operations managers to focus on strategic decisions rather than routine administrative processing.

Retail Automation Use Cases by Industry Vertical

retail automation

Retail automation applies differently depending on the business model, supply chain structure, and customer base. These are the four most significant vertical applications currently in deployment.

Grocery and Supermarkets

Grocery retailers manage high SKU volumes, tight margins, and perishable inventory, a combination that makes retail automation particularly high-impact in this segment. Key use cases include automated replenishment driven by real-time POS sales data, smart shelf monitoring to detect stockouts and misplacements before they affect revenue, and perishable inventory optimization to reduce waste and markdown costs at scale.

Fashion and Apparel

Fashion retail faces extreme demand volatility at the SKU and regional level, a single color or size variant can swing from overstock to stockout within days of a trend shift. Automation in the retail industry addresses this through demand sensing models that adjust buying and allocation decisions dynamically. Returns automation and visual merchandising analytics also reduce operational complexity in a category defined by high SKU counts and short product life cycles.

E-Commerce and D2C

For e-commerce and direct-to-consumer brands, automated retail systems power the entire order-to-delivery workflow. AI-driven product recommendations increase average order value, warehouse robotics accelerate pick-and-pack throughput, and automated order routing optimizes carrier selection and delivery timelines simultaneously.

Data point: Global online retail sales are projected to reach $6.88 trillion in 2026 (SellersCommerce). At that scale, fulfillment speed and accuracy requirements can only be reliably met through retail automation.

Multi-Location and Franchise Retail

Retail automation is particularly valuable for operators managing dozens or hundreds of locations. Centralized inventory visibility eliminates stock imbalances between stores, standardized automated workflows ensure operational consistency across franchisees, and cross-store performance benchmarking enables management to identify underperforming locations and respond faster than manual reporting cycles allow.

Retail Automation Comparison: Manual vs. Partially Automated vs. Fully Automated

retail automation

The table below illustrates the operational difference between manual, partially automated, and fully automated retail operations across eight key performance parameters.

ParameterManual OperationsPartially AutomatedFully Automated
Inventory Accuracy60–70%85–90%95–99%
Order Processing TimeHoursMinutesSeconds
Labor DependencyHighMediumLow
Error RateHighModerateMinimal
ScalabilityLimitedModerateHigh
Initial InvestmentLowMediumHigh
Long-Term Cost EfficiencyPoorGoodOptimal
Customer ExperienceInconsistentImprovedSeamless

When does partial automation make sense? For small-to-mid-size retailers with moderate SKU volumes and limited IT infrastructure, partial retail automation is often the right entry point. Automating high-impact areas, inventory management and POS, before committing to warehouse robotics or AI-driven marketing, allows businesses to build operational maturity and prove ROI without overextending capital.

When does full automation make sense? Enterprise retailers, large e-commerce operators, and multi-location chains managing high transaction volumes and complex supply chains derive the clearest ROI from full-stack retail automation. At this scale, labor cost reduction, throughput gains, and error elimination deliver measurable returns within 2–3 years of implementation, and partial automation creates coordination gaps that compound over time.

How Much Does Retail Automation Cost? Pricing Models and Budget Ranges

Automation Cost

Retail automation investment decisions require clarity on both pricing structure and total cost of ownership, not just the licensing fee presented in a vendor proposal.

Common Pricing Structures

SaaS subscription: Monthly or annual fees per store location, per user, or per transaction volume. This model suits retailers who need fast deployment with lower upfront capital requirements and prefer predictable recurring costs.

Custom development: A one-time build cost plus ongoing maintenance and support. This model fits retailers with unique workflows, legacy system constraints, or competitive differentiation requirements that off-the-shelf platforms cannot address.

Hybrid model: A platform license combined with implementation services and ongoing customization. Common for enterprise retail automation deployments requiring both a proven platform foundation and significant configuration work to match existing operational workflows.

Budget Ranges by Automation Type

  • POS and checkout automation: $5,000–$50,000 per store, depending on hardware requirements and software integrations
  • Inventory management platforms (SaaS): $500–$5,000 per month, based on location count and feature scope
  • Warehouse robotics: $100,000–$1M+ depending on facility size, throughput requirements, and system complexity
  • Full-stack retail automation suite (enterprise): $250,000–$2M+ for integrated implementations covering inventory, fulfillment, POS, and analytics

Hidden Costs to Account For

Decision-makers consistently underestimate three cost categories that rarely appear in vendor pricing sheets:

Legacy system integration: Connecting modern retail automation platforms to existing ERP, CRM, or WMS infrastructure often requires custom middleware, adding $20,000–$150,000+ to implementation costs depending on system age and compatibility.

Staff training and change management: Retraining employees and managing the organizational transition to automated workflows is a real cost in both time and productivity impact during the changeover period.

Ongoing maintenance and vendor lock-in risk: Proprietary retail automation platforms may impose annual fee increases, limit customization options, or create switching costs that restrict your flexibility as business requirements evolve. Total cost of ownership calculations must account for these from the start, not after contract signature.

ROI of Retail Automation: What the Data Shows

The business case for retail automation is not speculative. Consistent, cross-industry data from organizations that have implemented automation at scale provides a credible foundation for investment decisions.

Revenue and Efficiency Gains

  • Stores deploying automated technology report an 11% increase in customer visits (Research Nester industry survey)
  • Organizations that have implemented AI-driven retail automation report 5x–10x returns on investment across multi-year deployments (OneReach AI/Gartner).
  • Retailers across segments are actively planning to automate 70% of daily routine tasks by 2025–2026

Live deployments reflect these outcomes., not vendor projections or controlled lab environments.

Cost Reduction Benchmarks

  • Labor cost reduction: 20–30% reduction in labor costs for repetitive, rule-based tasks is consistently reported across retail automation implementations
  • Data accuracy: Automated data entry and report generation achieve up to 100% accuracy compared to manual processes, eliminating costly errors in inventory counts, order processing, and financial reporting
  • Warehouse automation ROI: Most warehouse retail automation investments reach positive ROI within 2–3 years, with ongoing returns increasing as throughput scales

Calculating ROI for Your Business

The standard ROI formula for retail automation investments:

ROI = (Annual savings + Revenue uplift from automation) / Total cost of ownership

The key input variables to quantify before committing to any vendor:

  • Labor cost offset: Current annual spend on tasks being automated vs. post-automation labor requirement
  • Error reduction savings: Cost of current errors, inventory shrinkage, order mistakes, compliance penalties vs. post-automation error rates
  • Throughput increase: Revenue impact of faster order processing and improved inventory availability
  • Customer retention lift: Long-term revenue impact of improved service consistency and personalized engagement at scale

Most retailers who complete a structured ROI analysis before implementation find that the business case is clearest in inventory management and warehouse operations, with payback periods in these areas typically ranging from 12–24 months for mid-size deployments.

Risks and Challenges of Implementing Retail Automation

Risks and Challenges

A balanced evaluation of retail automation requires honest assessment of the risks, not just the efficiency gains. These are the four most consistently reported implementation challenges.

High Upfront Investment and Unclear Payback

Retailers often cite budget pressure(41%) and ROI uncertainity(40%) as major barriers, according to the MHI 2025 Annual Industry Report. Without a structured business case and phased implementation plan, large upfront investments in automated retail systems can stall mid-project or fail to deliver expected returns against unclear baselines.

Integration with Legacy Systems

Most established retailers are operating POS, CRM, and inventory platforms that were not built with modern API integration in mind. Connecting new retail automation solutions to this infrastructure creates data silos, synchronization delays, and operational gaps that directly reduce realized ROI. Middleware solutions and phased migration strategies are the standard approach to managing this risk without requiring full infrastructure replacement.

Workforce Resistance and Change Management

Retail process automation displaces tasks before it displaces people, but employees whose roles change significantly are often the most effective friction point in new system adoption. Retailers who build career development pathways alongside automation deployment, provide hands-on training before go-live, and communicate the strategic rationale behind retail automation decisions consistently report faster adoption rates and fewer implementation setbacks.

Vendor Lock-In and Scalability Limitations

Many retail automation platforms are built on proprietary architectures that restrict future flexibility. Once workflows, data structures, and integrations are built around a single vendor’s system, switching costs become a significant operational barrier. Decision-makers should evaluate API-first, modular platforms that allow individual components to be replaced or upgraded independently, without requiring full system replacement when business requirements change.

Vendor Selection Checklist for Retail Automation

Use this checklist before committing to any retail automation solution or vendor contract:

  • API-first integration: Does the vendor support modular integration with your existing ERP, CRM, WMS, and POS systems without requiring full platform replacement?
  • Multi-channel scalability: Can the retail automation solution scale across multiple store locations, warehouse facilities, and digital sales channels without significant re-implementation?
  • Total cost of ownership: Has the vendor provided a complete TCO breakdown, including implementation, training, ongoing maintenance, and integration, not just licensing fees?
  • Industry-specific experience: Does the vendor offer documented case studies and use cases in your specific retail vertical (grocery, apparel, e-commerce, multi-location)?
  • Time-to-value: What is the reported average payback period from existing clients in comparable deployments?
  • Cloud-native architecture: Is the retail automation platform cloud-native with real-time data access and cross-channel visibility built in, not bolted on as an add-on?
  • Customization capability: Can the platform be configured to match your specific workflows without requiring heavy custom development from the vendor’s professional services team?
  • SLA-backed support: Does the vendor offer guaranteed response times, dedicated onboarding support, and clearly defined escalation paths?
  • Data security and compliance: How does the vendor handle data privacy, security certifications (SOC 2, ISO 27001), and regulatory compliance relevant to your markets?
  • Exit strategy: What does data portability look like if you need to migrate away from the platform? Is there a documented off-boarding process?

Top Retail Automation Tools and Platforms in 2026

Honeywell offers a broad portfolio of retail automation hardware and software, with particular strength in RFID-based inventory tracking, barcode scanning systems, and supply chain visibility solutions. Their platforms are widely deployed across large-scale warehouse and retail distribution environments globally.

NCR Voyix (formerly NCR Corporation) is one of the most established vendors in checkout automation, POS automation, self-checkout kiosk deployment, and workforce management for retail. Their solutions are commonly found across grocery, convenience, and hospitality retail environments.

Zebra Technologies specializes in mobile computing, RFID, and real-time supply chain visibility. Their devices and software are widely used for inventory management and workforce productivity across retail and logistics operations, with a strong installed base in large-format retail.

AutoStore is a leading provider of robotic micro-fulfillment systems, offering grid-based retail warehouse automation that significantly increases storage density and picking throughput. Their systems are used by retailers requiring high-volume, space-efficient order fulfillment in constrained warehouse footprints.

SAP, Oracle, and NetSuite provide enterprise ERP platforms with integrated retail automation modules covering inventory management, order management, financial reporting, and supply chain planning. These platforms typically serve as the integration backbone for full-stack automated retail systems at enterprise scale.

If you need a custom-built retail automation solution designed specifically around your workflows and existing tech stack, Tibicle’s development team can help. 

How Tibicle Supports Retail Automation Projects

Tibicle builds custom retail automation solutions based on each business’s operational needs. Instead of forcing businesses to adjust to fixed platforms, Tibicle creates solutions that fit existing workflows.

With experience across logistics, healthcare, HR, and manufacturing, Tibicle focuses on API-first architecture. This helps connect new automation systems with existing tools without replacing the entire infrastructure.

Tibicle supports mid-market and enterprise retailers that need custom integrations, scalable workflows, or solutions beyond standard platforms.

The key difference is flexibility. Tibicle designs retail automation systems around your processes, helping reduce integration risks, improve implementation speed, and avoid vendor lock-in.

Conclusion

Retail automation is no longer a competitive advantage reserved for the largest global retailers. Rising labor costs, omnichannel complexity, and growing customer expectations have moved automation in the retail industry from optional to operationally essential for any business managing meaningful transaction volume.

Most retail executives are no longer deciding whether to automate. They are deciding where to start, which vendor fits their needs, and how to measure returns before investing.

The decision facing most retail executives today is not whether to automate, but where to start, which vendor model fits their infrastructure and budget, and how to measure returns clearly before committing capital at scale.

The ROI data is consistent across industries and geographies: businesses that adopt retail automation systematically, with a clear business case, structured vendor evaluation, and a phased implementation plan, see measurable returns within 12–36 months. Those that delay continue to absorb the compounding costs of manual operations in an environment that has already moved on.

Ready to build a retail automation solution that fits your business? Contact Tibicle’s team for a free consultation.

Frequently Asked Questions

Q1: What is retail automation and how does it work?
Retail automation uses AI, robotics, IoT, and software to automate repetitive retail tasks like inventory tracking, checkout, fulfillment, and customer engagement. It connects with existing systems to improve speed, accuracy, and efficiency.

Q2: How much does retail automation cost for a mid-size retailer?
Retail automation costs vary based on the solution and business needs. SaaS tools may start around $500/month, while advanced warehouse automation can exceed $1M. Most mid-size retailers invest based on their operational goals and required features.

Q3: What is the average ROI of retail automation?
Retail automation can deliver strong ROI through lower costs, faster operations, and fewer errors. Many businesses achieve positive ROI within 12–24 months, depending on their automation scope and goals.

Q4: What are the biggest risks of implementing retail automation?
The main risks include high costs, integration challenges, employee resistance, and vendor lock-in. However, a phased rollout and proper vendor evaluation can reduce these risks.

Q5: Can retail automation work with existing POS and ERP systems?
Yes, retail automation works with existing POS, ERP, CRM, and WMS systems. Modern solutions use API integrations to connect with existing software and improve workflows.

Q6: How do I choose the right retail automation vendor?
Choose a vendor based on API compatibility, scalability, pricing, industry experience, security, and support. A reliable retail automation vendor should fit your existing systems and help you achieve measurable results.

Retail App Development Guide for SMBs in 2026

Introduction

Retail app development is becoming a strategic priority as mobile commerce is projected to account for nearly 60% of global ecommerce sales by 2026, generating more than $2.4 trillion in mobile transactions worldwide. For SMB retailers, this shift creates both opportunity and pressure. Customers increasingly expect seamless mobile shopping experiences, personalized engagement, and faster checkout flows directly from their smartphones.

retail app development

Unlike enterprise retailers, SMBs operate under tighter budgets, smaller operational teams, and stricter ROI expectations. Decisions around retail app development are no longer just about launching an app; they involve platform selection, feature prioritization, maintenance planning, and long-term scalability.

SMB retailers evaluating mobile growth strategies must balance development cost, feature priorities, scalability, vendor selection, and long-term ROI before investing in a retail application.

What Retail App Development Means for SMBs in 2026

How Retail Apps Differ from Mobile-Responsive Websites

Retail app development refers to the process of creating mobile applications for retail businesses that allow customers to browse products, place orders, track purchases, receive offers, and interact directly with brands through smartphones.

Retail app development gives SMBs direct access to customers through a dedicated mobile channel instead of relying entirely on browser traffic. Mobile apps consistently outperform responsive websites in engagement and conversion because they provide faster checkout experiences, personalized recommendations, and stronger retention systems.

Industry studies show mobile apps convert nearly 30% higher than mobile-responsive websites. Push notifications also significantly outperform email engagement rates, allowing retailers to communicate directly with customers without depending entirely on paid advertising algorithms or search traffic. A mobile app for retail business additionally creates an owned customer data channel, giving SMBs more control over customer behavior analytics, retention campaigns, and long-term monetization strategies.

Why 2026 Is a Tipping Point for SMB Retail Apps

Cross-platform frameworks like Flutter and React Native have reduced retail mobile app development costs by approximately 30–40% since 2023. SMBs can now launch iOS and Android apps using a shared codebase without maintaining separate engineering teams.

AI-powered features such as chatbots, recommendation systems, and predictive search are also increasingly available through affordable third-party APIs. Combined with shifting customer behavior, where nearly 70% of US mobile shoppers prefer apps over mobile websites, retail app adoption has become more commercially viable for SMBs than ever before.

Core Features SMBs Should Prioritize (and What to Skip)

retail app development

Must-Have Features for an SMB Retail App MVP

An effective retail app MVP should prioritize features directly tied to conversion, retention, and operational simplicity rather than attempting enterprise-level functionality immediately.

Core ecommerce app features should include:

These foundational capabilities support customer acquisition and transaction efficiency while keeping development complexity manageable.

High-Impact Add-Ons Worth the Extra Spend

After establishing a stable MVP, SMBs can improve customer retention and average order value through carefully selected enhancements.

High-value additions include:

  • AI-powered product recommendations
  • In-app loyalty program systems
  • AR product visualization for applicable retail sectors
  • POS integration, mobile app connectivity for omnichannel retail solution strategies

These additions typically improve repeat purchases and customer engagement without requiring a full platform rebuild.

Features to Defer Until Post-Launch

Many SMBs overspend by prioritizing advanced functionality too early. Features best delayed until later growth stages include:

  • Voice commerce
  • Social commerce integrations
  • Advanced CRM and ERP connections
  • Multi-language support

Deferring these features helps reduce launch complexity and shortens time-to-market.

Retail App Development Approaches: Build, Buy, or Convert

retail app development

Custom Native Development

Native retail app development offers maximum customization and performance but involves significantly higher costs and longer development timelines. This approach works best for retailers requiring highly customized workflows, advanced hardware integrations, or enterprise-level scalability.

  • Timeline: 4–9 months
  • Cost: $50K–$220K+
  • Risk: Higher upfront investment and slower launches

Cross-Platform Development (Flutter / React Native)

Cross-platform retail app development enables SMBs to launch on both iOS and Android using a single codebase. This model balances cost efficiency with scalability for most retail applications.

  • Timeline: 3–6 months
  • Cost: $35K–$120K
  • Risk: Minor performance trade-offs for hardware-intensive features

App Builders and Website-to-App Converters

App builders help retailers launch quickly using existing Shopify or WooCommerce stores. They are useful for mobile commerce for small business operations needing rapid deployment.

  • Timeline: 2–6 weeks
  • Cost: $5K–$25K
  • Risk: Limited customization and vendor lock-in
ApproachCostTimelineScalabilityBest Fit
Native Development$50K–$220K+4–9 monthsVery HighEnterprise retailers
Cross-Platform$35K–$120K3–6 monthsHighSMBs and scaling brands
App Builders$5K–$25K2–6 weeksModerateSmall e-commerce stores

Retail App Development Cost Breakdown for SMBs

Cost Breakdown

Cost by App Complexity Tier

Retail app development cost varies based on integrations, backend infrastructure, UI complexity, and scalability requirements.

ComplexityEstimated Cost
Basic MVP$25K–$55K
Mid-range Multi-Feature App$55K–$120K
Advanced AI / AR App$120K–$220K+

Industry benchmarks place the average custom app development investment around $171,450 across industries during 2025–2026.

Hidden Costs Most SMBs Miss

Many retailers underestimate operational expenses beyond engineering work. Common overlooked costs include:

  • Discovery and scoping phases ($2K–$10K)
  • Annual maintenance (15–20% of build cost)
  • App store optimization
  • Marketing campaigns
  • Third-party API subscriptions

Ignoring these costs often creates budget overruns after launch.

Budget Allocation Framework for a $50K–$80K Build

A typical SMB retail app budget allocation may look like:

  • Discovery and planning → 10%
  • UI/UX design → 15%
  • Development → 45%
  • QA and testing → 20%
  • Launch and optimization → 10%

This structure improves cost predictability while maintaining product quality.

ROI and Business Impact of a Retail App for SMBs

Revenue Metrics That Matter

Retail apps consistently outperform mobile web experiences in customer retention and monetization. Studies show app users spend nearly three times more and return twice as often as mobile website users.

Push notifications also generate conversion rates between 12–18%, substantially higher than traditional email campaigns. AI personalization features can further increase revenue by approximately 40% through improved product targeting and engagement.

Timeline to Positive ROI

Well-scoped retail apps commonly achieve breakeven within 8–16 months depending on adoption rate, retention, and customer acquisition efficiency.

Businesses generally require:

  • 18%+ first-year customer adoption
  • 45%+ monthly active user retention
  • Strong repeat purchase behavior

to sustain positive ROI growth.

How to Calculate ROI Before You Build

Retail app ROI can be estimated using:

(Projected Revenue + Operational Savings) – (Development + Maintenance + Marketing Cost) ÷ Total Investment

Key metrics to monitor include:

  • Retention rate
  • ARPU
  • Customer lifetime value
  • Cart abandonment reduction

Risks and Challenges in SMB Retail App Development

Scope Creep and Feature Overload

Poor scoping creates technical debt that often costs three to five times more to fix later. SMBs should prioritize lean launches over feature-heavy first versions.

Low Adoption After Launch

Performance optimization is critical because 53% of users abandon apps that take longer than three seconds to load.

Vendor Mismatch

Some agencies overengineer solutions designed for enterprise retainers rather than SMB budgets, increasing unnecessary development expense.

Security and Compliance Gaps

Retailers handling payments and customer data must evaluate PCI-DSS requirements, GDPR, and state-level privacy compliance obligations carefully.

Vendor Selection Checklist for SMB Retail App Development

Vendor Selection

10-Point Evaluation Framework

Businesses evaluating a retail app development company should review:

  • Retail-specific portfolio experience
  • Fixed-scope pricing options
  • Post-launch support agreements
  • API-first scalable architecture
  • Discovery phase clarity
  • Reference clients within a similar revenue size
  • Milestone-based project timelines
  • Internal QA process
  • Data ownership clauses
  • AI/ML integration readiness

Red Flags to Watch For

Warning signs include:

  • No discovery process before quoting
  • Monolithic, outdated tech stacks
  • No support for accountability after launch
  • Vague delivery timelines

Need help evaluating your retail app options? Talk to Tibicle’s team for a scoped assessment.

Why Tibicle Is a Strong Choice for Retail App Development

What Sets Tibicle Apart for SMB Retail Projects

Tibicle approaches custom retail app development with SMB-focused delivery models designed around predictable budgets and measurable ROI expectations. Their engagement structure prioritizes fixed-scope planning, scalable API-first architectures, and practical launch strategies instead of unnecessary enterprise complexity.

The company supports retail businesses through planning, UI/UX design, mobile engineering, integrations, testing, and post-launch optimization. Tibicle also builds AI-ready architectures so retailers can introduce automation, personalization, and analytics enhancements without rebuilding the platform later.

Post-launch support, operational transparency, and scalable technology planning remain central throughout the engagement lifecycle.

Explore how Tibicle approaches retail app builds. Request a free project scoping call.

Conclusion

SMBs do not need enterprise-scale retail applications to compete effectively in 2026. They need the right feature set, realistic budget planning, scalable architecture, and a vendor capable of aligning development decisions with measurable business outcomes.

For many retailers, a properly scoped $35K–$80K investment can reach breakeven within the first year while improving customer retention, conversion, and operational efficiency substantially.

Talk to Tibicle’s retail app team to scope your build and get a transparent cost estimate.

FAQs

How much does retail app development cost for a small business in 2026?
Retail app development costs generally range from $25K for basic MVPs to more than $220K for advanced platforms with AI, AR, and ERP integrations.

How long does it take to build a retail app MVP?
Most SMB retail app MVPs take between 2–6 months depending on platform strategy, integrations, and feature complexity.

Should SMBs choose native or cross-platform retail app development?
Most SMBs benefit more from cross-platform retail app development because it reduces engineering cost while supporting both iOS and Android through one shared codebase.

What is the average ROI timeline for a retail mobile app?
Well-executed retail apps commonly achieve breakeven within 8–16 months when retention and adoption targets are met.

What features should an SMB retail app include at launch?
Core launch features should include product catalogs, secure checkout, push notifications, order tracking, and analytics dashboards.

How do I evaluate a retail app development company before signing a contract?
Review retail-specific experience, pricing transparency, support terms, technical architecture, references, and milestone-based delivery processes carefully before signing.