0%

Ecommerce Personalisation: A Complete Guide

What This Guide Covers

Who this is for:
Ecommerce business owners, digital commerce leaders, marketing executives, product managers, and technology decision-makers who are evaluating ecommerce personalisation platforms to increase conversion rates, improve customer lifetime value, reduce acquisition costs, and deliver data-driven shopping experiences at scale.

Search intent:
Commercial investigation and platform evaluation. This guide is written for decision-makers who already understand the importance of ecommerce personalisation and are comparing technologies before investing. Rather than explaining the fundamentals of personalisation, it focuses on evaluating implementation models, AI capabilities, pricing, total cost of ownership, integration complexity, and measurable ROI to help businesses choose the right solution for their ecommerce growth strategy.

What you will walk away with:
A comprehensive guide to ecommerce personalisation in 2026, including the business case for implementation, core strategy components, funnel-specific use cases, comparison of leading personalisation platforms, pricing across SMB, mid-market, and enterprise tiers, ROI benchmarks, implementation risks, vendor evaluation criteria, and a practical framework for selecting and deploying the right ecommerce personalisation platform based on your business size, technology stack, and long-term growth objectives.

Introduction

ecommerece

Ecommerce personalisation is no longer a differentiation play. Instead, it has become a revenue baseline. 89% of businesses report positive ROI from personalisation, and McKinsey data shows a 10 to 30% improvement in marketing ROI for companies that execute it at scale. As a result, generic shopping experiences, the same homepage, the same product grid, and the same email for every visitor, cost businesses revenue through higher cart abandonment and lower customer lifetime value.

It is positioned for C-level decision-makers evaluating whether to build, buy, or scale a personalisation capability in 2026. The framing throughout is cost versus value, not feature lists.

This guide covers the business case, pricing realities, platform comparisons, and vendor selection criteria for ecommerce personalisation in 2026.

What Is Ecommerce Personalisation?

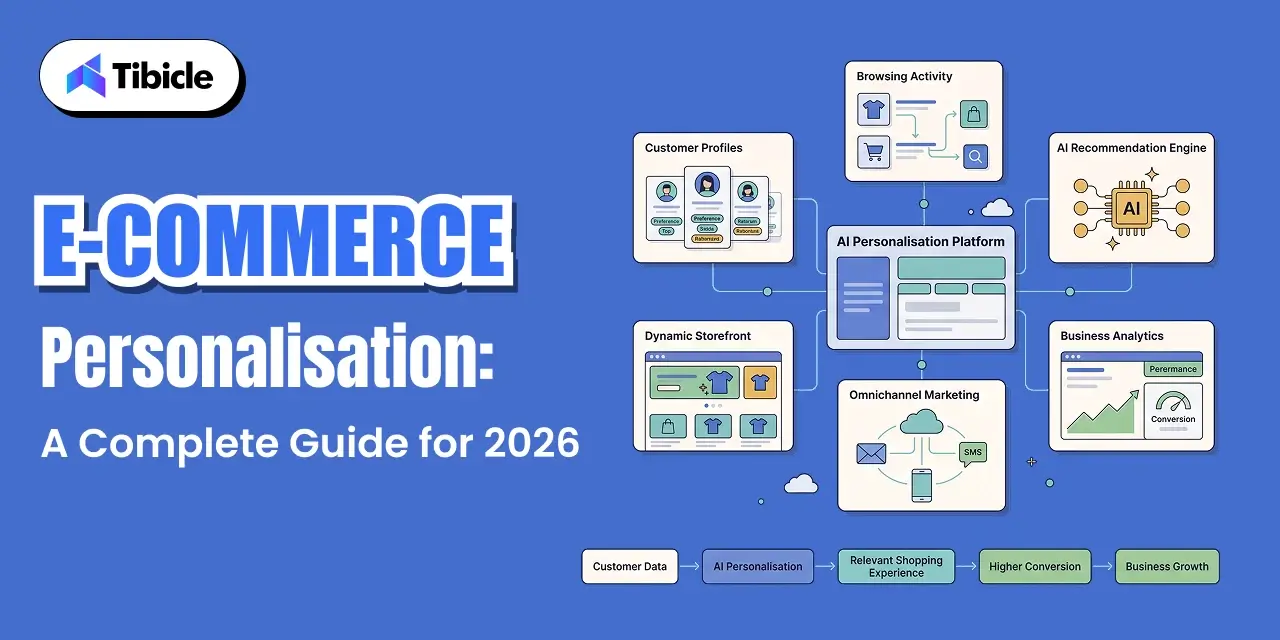
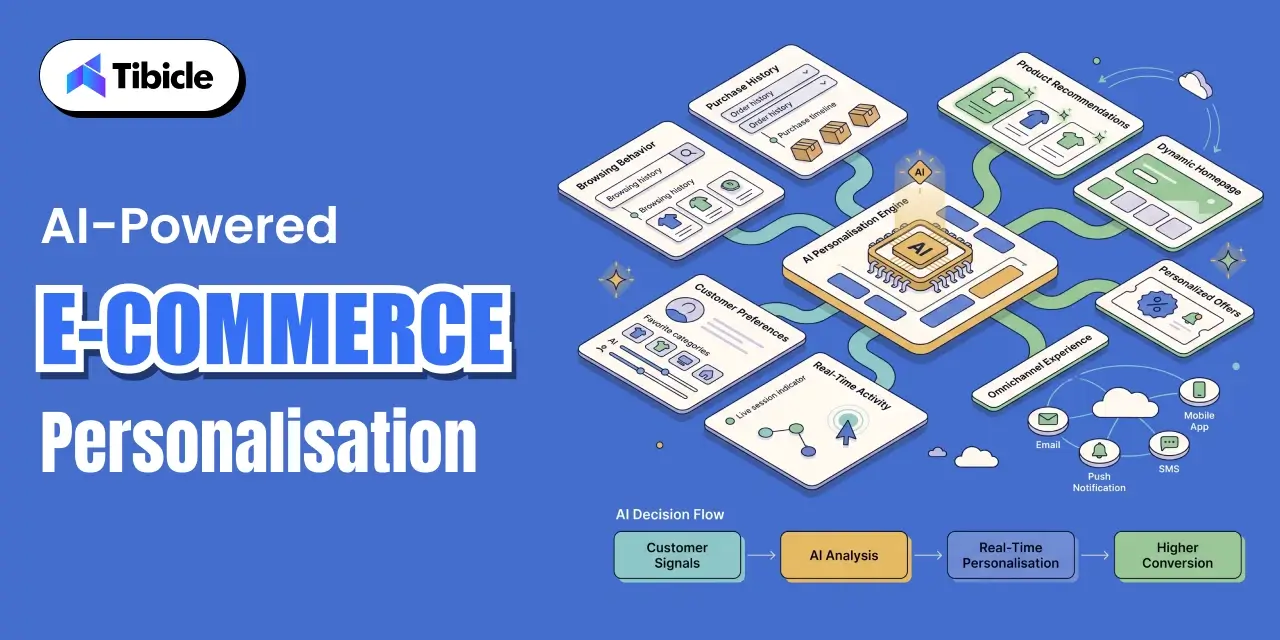
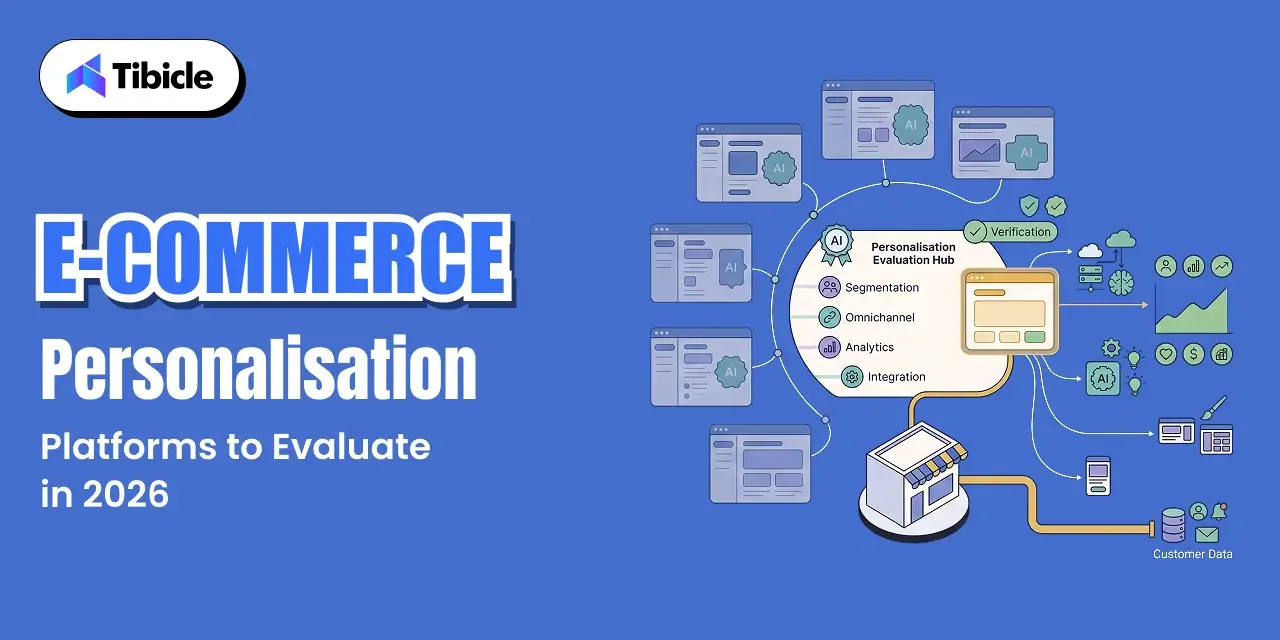
Ecommerce personalisation is the automated delivery of individualized shopping experiences, product recommendations, dynamic content, pricing, and messaging, based on behavioural, transactional, and demographic data. The engine is software. The output is a shopping environment that adjusts in real time to who is browsing, what they have purchased before, and what similar customers have done. It operates without manual curation at the individual level.

ecommerece

How It Differs from Product Customisation

Product customisation is buyer-controlled: the customer selects a colour, engraves a name, or configures a spec. Ecommerce personalisation is system-controlled: the platform adapts the experience before the customer makes any explicit choice, based on inferred or declared preferences. The distinction matters for budget allocation; customisation is a product decision; personalisation is a data and technology decision. In B2B contexts, the data models differ significantly: buying cycles are longer, purchasing is committee-driven, and account-level rather than individual-level signals drive the most relevant personalisation logic.

Why Ecommerce Personalisation Matters for Revenue Growth

The financial case for personalisation is well documented. Therefore, the real question in 2026 is not whether it works but which implementation model delivers the strongest return.

Impact on Conversion Rates and AOV

Product recommendations alone drive up to 31% of ecommerce revenue across mature implementations. At the session level, AI product recommendations increase average order value by up to 369% in high-engagement sessions, reflecting what happens when the right product reaches the right customer at the right moment in the purchase flow, rather than when a generic bestsellers grid occupies that real estate. These are not marginal improvements. They are structural revenue differences between personalised and non-personalised commercial environments.

Reduction in Customer Acquisition Cost

Personalisation reduces customer acquisition cost by up to 50%, according to McKinsey research. The mechanism: relevant experiences improve conversion rates at every funnel stage, which reduces the cost-per-acquisition from paid channels. First-party data strategies, collecting and activating data directly from customer interactions rather than purchasing third-party audiences, deliver a 2.9x revenue increase compared to cohorts still relying on third-party data models. As third-party cookie deprecation continues, the gap between operators with mature first-party data infrastructure and those without it widens every quarter.

Core Components of an Ecommerce Personalisation Strategy

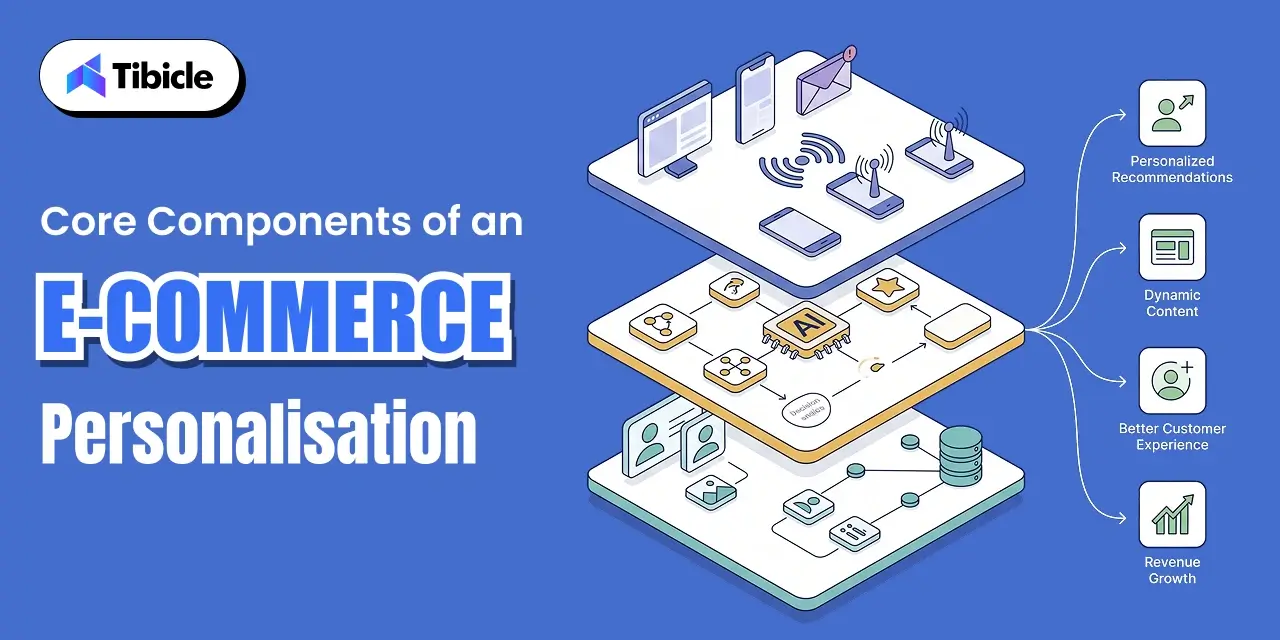
A personalised shopping experience at scale is built on three interdependent layers. Weakness in any one of them limits the output of the others.

ecommerece

Data Infrastructure and First-Party Data

The deprecation of third-party cookies has made zero-party data, data customers share voluntarily through quizzes, preference centers, and account profiles, and first-party behavioural data the primary inputs for personalisation engines. A customer data platform unifies these sources into a single customer profile. Without this foundation, personalisation engines operate on incomplete signals. 

AI and Machine Learning Layer

92% of businesses now use AI-driven personalisation in some form. Additionally, the AI layer handles tasks that manual segmentation simply : real-time personalisation of product recommendations based on session behaviour, dynamic pricing adjustments informed by demand signals, and predictive commerce that surfaces products a customer is statistically likely to want before they have searched for them. The accuracy of this layer is a direct function of data volume and model training quality, which is why platform selection and data infrastructure decisions are inseparable.

Omnichannel Orchestration

Likewise, personalisation that operates only on the website misses many valuable customer touchpoints. Omnichannel personalisation coordinates individualised experiences across email, web, push notifications, SMS, and social channels from a unified data model. Cross-channel brands see 6.5x more purchases per user than single-channel operators, a figure that reflects the compounding effect of consistent, relevant messaging across every surface a customer encounters.

Ecommerce Personalisation Use Cases by Funnel Stage

The specific capability that delivers the highest ROI depends on where the largest revenue leak sits in the current funnel. Each stage has a distinct set of personalisation levers.

Acquisition: Personalised Landing Pages and Retargeting

Behavioural targeting at the acquisition stage uses traffic source, device type, referral keyword, and prior session data to serve landing page variants that match the visitor’s inferred intent. A visitor arriving from a branded search query sees a different commercial proposition than one arriving from a generic category keyword, and conversion rates reflect that difference.

Consideration: Dynamic Product Recommendations and Search

Dynamic content at the consideration stage surfaces relevant products based on browse history, category affinity, and collaborative filtering signals. Personalised search, where results are ranked by individual relevance rather than global popularity, is one of the highest-leverage interventions available, particularly for large-catalog retailers where the default search experience buries relevant items under top-sellers.

Conversion: Cart Recovery and Checkout Optimisation

$260 billion in lost orders are recoverable through better checkout personalisation, according to Baymard Institute research. Cart abandonment personalisation, triggered emails, browser push notifications, and SMS recovery sequences with session-specific product references directly target that recoverable figure. Conversion rate optimisation at checkout also includes personalised payment method display, address pre-fill, and delivery option prioritisation based on past purchase behaviour.

Retention: Post-Purchase Flows and Loyalty Triggers

Post-purchase personalisation extends the commercial relationship beyond the transaction. Replenishment reminders timed to product consumption cycles, cross-sell sequences based on purchase category affinity, and loyalty milestone triggers all operate on first-party data the brand already holds. Operators running structured personalised recovery campaigns report a 56% repeat purchase rate, a benchmark that illustrates the compounding value of treating retention as a personalisation problem, not a discounting problem.

Ecommerce Personalisation Tools Comparison

The ecommerce personalisation tools market spans from $39 a month SMB solutions to $100,000+ a year enterprise platforms. The capability gap between tiers is significant, and choosing the wrong tier in either direction is expensive. Use this table as a first-pass filter before engaging vendors.

ToolBest ForAI CapabilityPricing ModelIntegration Depth
Dynamic YieldEnterprise on-site personalisationAdvanced MLCustom/enterpriseDeep (multi-platform)
KlaviyoEmail + SMS personalisationPredictive analyticsTiered (usage-based)Strong (Shopify, BigCommerce)
BloomreachFull-stack commerce experienceLoomi AI engineCustomCRM, CDP, search
NostoMid-market product recommendationsExperience AITieredShopify, Magento
InsiderOmnichannel journey orchestrationSirius AICustom (~$48K-$100K/yr)12+ channels
Adobe TargetEnterprise testing + personalisationAdobe SenseiEnterprise customAdobe ecosystem
PersonizelySMB on-site personalisationRules + basic AI$39-$59/mo (starting)Shopify, WordPress

Pricing Insights: What Ecommerce Personalisation Actually Costs

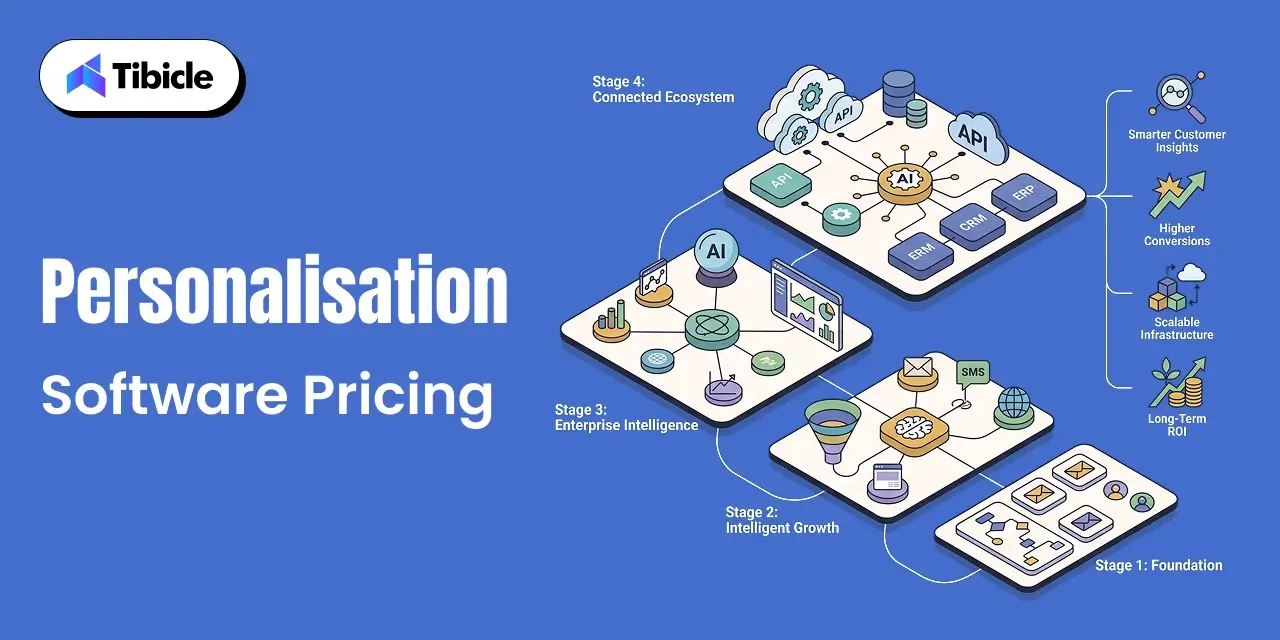
Personalisation platform pricing spans three distinct tiers, each with different capability ceilings and total cost of ownership implications. The sticker price is rarely the complete picture.

ecommerece Personalisation

SMB Tier ($39 to $500 per Month)

Tools at this tier, Personizely, Klaviyo’s entry plans, Nosto’s lower tiers, cover rule-based segmentation and basic e-commerce personalisation tools functionality. AI capability is limited. Suitable for single-channel operators with under $5M in annual revenue and relatively simple personalisation requirements.

Mid-Market Tier ($1,000 to $5,000 per Month)

Platforms like Bloomreach and Dynamic Yield at this tier deliver ML-driven recommendations, multi-channel support, and the integration depth needed to pull from CRM, CDP, and delivery platform data simultaneously. This is where the ROI case becomes compelling for operators with meaningful traffic volume and catalog complexity.

Enterprise Tier ($48,000 to $100,000+ per Year)

Insider, Adobe Target, and Salesforce Commerce Cloud operate at this level. Full-stack personalisation, dedicated implementation support, and contract structures that include onboarding and ongoing optimisation resource are standard. The pricing reflects platforms built for operators where personalisation is infrastructure, not a feature.

Hidden Costs to Account For

When planning an ecommerce personalisation strategy, the platform licence is only one part of the investment. Businesses should also budget for integrating systems such as the CDP, CRM, ecommerce platform, and email tools. In addition, building a reliable data infrastructure requires identity resolution and well-designed data pipelines.

Effective personalisation also requires creating multiple versions of content for different customer segments, which increases creative production efforts. Finally, achieving long-term success depends on continuous optimisation through testing, monitoring, and performance analysis rather than a one-time implementation.

ROI Benchmarks: Measuring the Business Impact

The ROI data on ecommerce personalisation is consistent across multiple independent sources and operator segments. Companies with advanced personalisation capabilities see $20 return per $1 spent. A Forrester study on Optimizely customers found 446% three-year ROI, with AI-powered personalisation reaching full ROI within 4 to 6 months of implementation. Personalised email campaigns generate 122% higher ROI compared to generic sends to the same contact list.

Metrics That Matter for Executive Reporting

Four KPIs translate personalisation performance into board-level language:

1) Revenue per visitor – the cleanest measure of whether personalisation is moving commercial outcomes

2) Recommendation-driven revenue share – percentage of total revenue attributable to personalised product surfaces

3) CAC reduction rate – improvement in cost-per-acquisition from paid channels as conversion rates increase

4) Customer lifetime value uplift – personalisation correlates with 33% higher CLV; track this at 6 and 12-month cohort intervals

Risks and Challenges in Ecommerce Personalisation

Three risk categories account for the majority of personalisation programmes that underperform their ROI projections.

Data Privacy and Compliance Exposure

GDPR, CCPA, and expanding regional consent requirements have changed the legal baseline for personalisation data collection. Consent-based data models are not optional infrastructure; they are a compliance requirement. Platforms that haven’t migrated away from third-party cookie dependency carry compounding legal and operational risk as cookie deprecation extends across browsers.

Over-Personalisation and Customer Pushback

However, personalisation has limits. If it becomes too intrusive, customer trust quickly declines. 76% of consumers report frustration when personalisation is irrelevant or feels intrusive, suggesting that getting it wrong erodes trust faster than not personalising at all. The failure mode is using data signals the customer hasn’t intentionally shared, or surfacing recommendations that reveal how much behavioural data is being tracked.

Integration Complexity and Vendor Lock-In

CDP dependency, siloed data across legacy tools, and non-portable data formats create switching costs that extend well beyond the contract exit fee. Evaluate data portability clauses and API openness before signing. The platforms with the deepest native integration typically create the deepest lock-in, and that trade-off needs to be explicit in the vendor selection decision.

Vendor Selection Checklist for Ecommerce Personalisation

Use this scorecard when evaluating any ecommerce personalisation strategy platform. Score each vendor against these criteria before shortlisting.

CriteriaWeightWhat to Verify
AI / ML capability depthHighDoes it generate predictive recommendations or apply static rules?
CRM and commerce stack integrationHighNative connectors vs. middleware dependency
Data residency and privacyHighGDPR, CCPA compliance; consent-based data model
Implementation timelineMediumSelf-service (hours), managed (days), enterprise (weeks to months)
Attribution model transparencyMediumSame-session vs. multi-day attribution clarity
ScalabilityMediumPerformance against traffic spikes and large catalog size
Support and onboarding qualityMediumDedicated CSM, structured onboarding, SLA response times
Total cost of ownershipHighLicense + integration + content production + ongoing headcount

Ultimately, any vendor that provides vague answers on data residency, attribution models, or total cost of ownership should not progress beyond the shortlist. These are not edge-case questions; they are the variables that determine whether the investment pays back.

Top Ecommerce Personalisation Platforms to Evaluate in 2026

Shortlisted by use case. Selection should be driven by the scorecard criteria above, not brand recognition or analyst positioning.

ecommerece Personalisation

  1. Dynamic Yield – best for enterprise A/B testing and on-site personalisation at scale
  2. Bloomreach – best for unified commerce search combined with AI-driven product recommendations
  3. Klaviyo – best for email and SMS-first personalisation with strong Shopify and BigCommerce integration
  4. Insider – best for omnichannel journey orchestration across 12+ channels
  5. Nosto – best for mid-market product discovery on Shopify and Magento
  6. Algolia – best for AI-powered personalised search and catalog relevance
  7. Personizely – best for SMB on-site personalisation on a budget without enterprise overhead

Why Tibicle Is a Strong Choice for Ecommerce Personalisation Implementation

Platform selection is the first decision. However, successful implementation is what ultimately determines ROI. Implementation is where ecommerce personalisation programmes succeed or fail. Tibicle operates as an implementation and technology partner, not a product vendor for ecommerce businesses at the stage where off-the-shelf configuration isn’t sufficient.

The integration complexity challenges covered earlier in this guide- CDP dependency, siloed data, non-native POS connectors, omnichannel orchestration across fragmented tools- are exactly the problems Tibicle’s development teams are built to solve. The scope covers custom ecommerce development, integration architecture across commerce and CRM platforms, data infrastructure consulting, and scalable build-to-operate models for teams that don’t have in-house engineering capacity.

Connect with Tibicle’s team to assess your personalisation readiness and build a phased rollout plan.

Conclusion

The market data on ecommerce personalisation supports action, not observation. A 4 to 6 month payback window on AI-powered implementations, $20 return per $1 spent at mature deployments, and a 33% customer lifetime value uplift are not marginal gains; they are the gap between operators who treat personalisation as infrastructure and those who treat it as a feature on a roadmap.

Overall, the comparison table, pricing breakdown, and vendor checklist are designed to help you create a practical shortlist rather than simply provide background information.

Talk to Tibicle to scope your ecommerce personalisation strategy and implementation roadmap.

Frequently Asked Questions

What is ecommerce personalisation and how does it work?
Ecommerce personalisation is the automated delivery of individualised shopping experiences, product recommendations, content, pricing, and messaging based on behavioural and transactional data. It works through a data layer that captures customer signals, a machine learning engine that identifies patterns, and a delivery layer that adapts the on-site or off-site experience in real time.

How much does ecommerce personalisation software cost in 2026?
SMB-tier tools start at $39 to $500 a month. Mid-market platforms run $1,000 to $5,000 a month. Enterprise platforms like Insider and Adobe Target start at $48,000 a year and scale upward. Total cost of ownership, including integration, content, and optimisation headcount, typically runs 2 to 3 times the license fee.

What ROI can businesses expect from ecommerce personalisation?
Companies with advanced personalisation see $20 return per $1 spent. AI-powered personalisation reaches full ROI within 4 to 6 months, with a Forrester-documented 446% three-year ROI for enterprise implementations. At the campaign level, personalised emails generate 122% higher ROI versus generic sends.

What is the difference between ecommerce personalisation and product customisation?
Product customisation is buyer-initiated; the customer selects product attributes. Ecommerce personalisation is system-initiated; the platform adapts the shopping experience based on data, before the customer makes any explicit choice. They operate at different layers of the commerce stack and require different technology and budget allocation.

Which ecommerce personalisation tools are best for mid-market businesses?
Bloomreach and Dynamic Yield are the strongest mid-market options for full-stack personalisation. Nosto is the most accessible entry point for product recommendation-focused use cases on Shopify and Magento. Klaviyo leads for email and SMS personalisation at this tier. The right choice depends on which funnel stage holds the largest revenue gap.

How long does it take to implement an ecommerce personalisation platform?
Self-service SMB tools are live within hours. Managed mid-market implementations typically take days to weeks depending on data complexity. Full enterprise deployments including CDP setup, multi-channel integration, and QA run 4 to 12 weeks. Budget 2 to 4 hours of team training before go-live regardless of platform tier.

What Is Food Service Technology? A Decision-Maker’s Guide

What This Guide Covers

Who this is for: Restaurant owners, multi-location operators, hospitality groups, cloud kitchen businesses, and operations leaders evaluating food service technology to improve operational efficiency, reduce costs, and build a technology stack that supports long-term growth.

Search intent: Commercial investigation. This guide is written for decision-makers who already understand the role of technology in restaurants and are evaluating which systems to implement, how much they cost, what return they generate, and how to avoid expensive implementation mistakes.

What you will walk away with: A detailed breakdown of the major categories of food service technology, pricing expectations, implementation costs, ROI benchmarks, vendor evaluation criteria, technology comparisons, and a practical framework for selecting the right technology stack for your restaurant.

Introduction

food service technology

Restaurant margins sit at 3 to 5%. Labor costs consume 30 to 35% of revenue. Without proper tracking, 30 to 40% of food inventory gets wasted before it ever reaches a plate. These are not abstract industry complaints; they are the exact gaps food service technology exists to close.

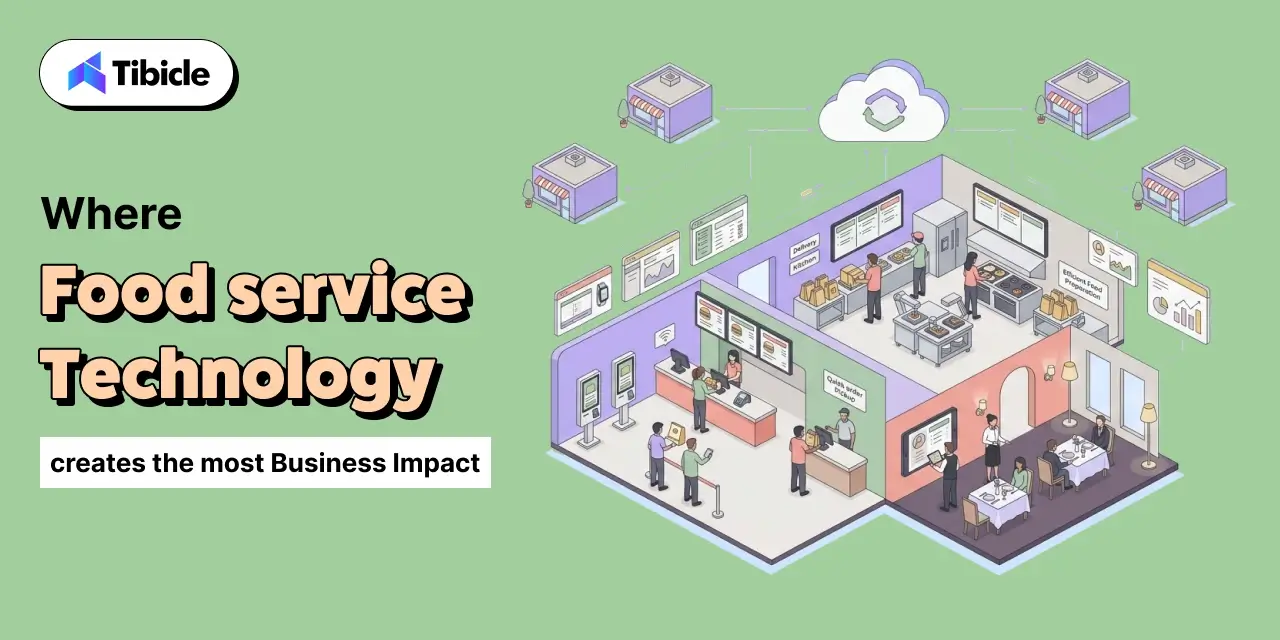
Food service technology is the connected stack of hardware, software, and AI-driven systems that runs restaurant operations end to end: order capture, kitchen execution, inventory, labor, compliance, and customer retention, all reporting through one operational layer instead of three disconnected ones.

If you’re evaluating whether food service technology is worth the investment, this guide gives you the numbers, the comparisons, and the checklist to decide.

What Is Food Service Technology?

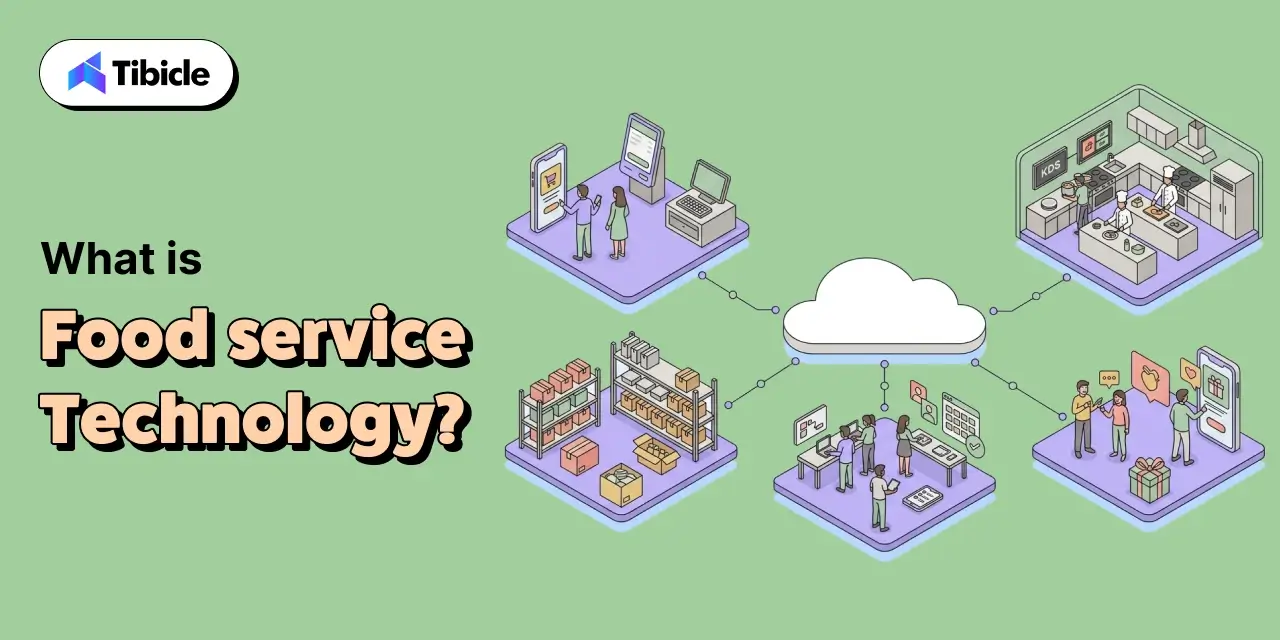
Food service technology refers to the integrated stack of hardware, software, and AI-driven systems that manage restaurant operations end to end, from order capture and kitchen execution to inventory, labor, compliance, and customer retention. It is the layer connecting the front counter, the back kitchen, and the supply chain into one reporting system.

food service technology

How It Differs from Generic Business Software

Generic ERP or retail POS platforms are not built for food service math. Retail software handles a static SKU count and predictable shelf life. A restaurant runs real-time order throughput across dine-in, delivery, and pickup at once, carries HACCP compliance requirements, and manages inventory that spoils in days rather than months. That gap is why category-specific architecture exists instead of retrofitted retail software.

Where Food Service Technology Sits in Your Operations Stack

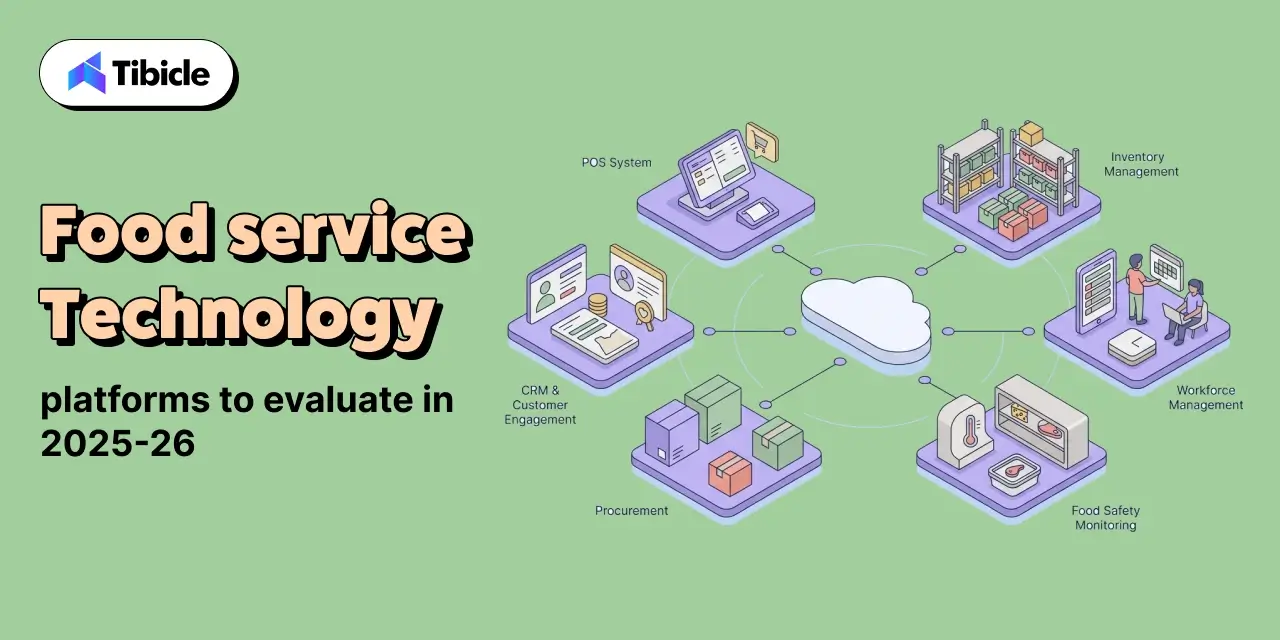
Four layers make up the stack. Front-of-house handles order capture and guest interaction. Back-of-house handles kitchen execution and prep. Supply chain covers procurement and inventory. The data layer sits above all three, turning transaction records into reporting and forecasting.

Core Types of Food Service Technology

food service technology

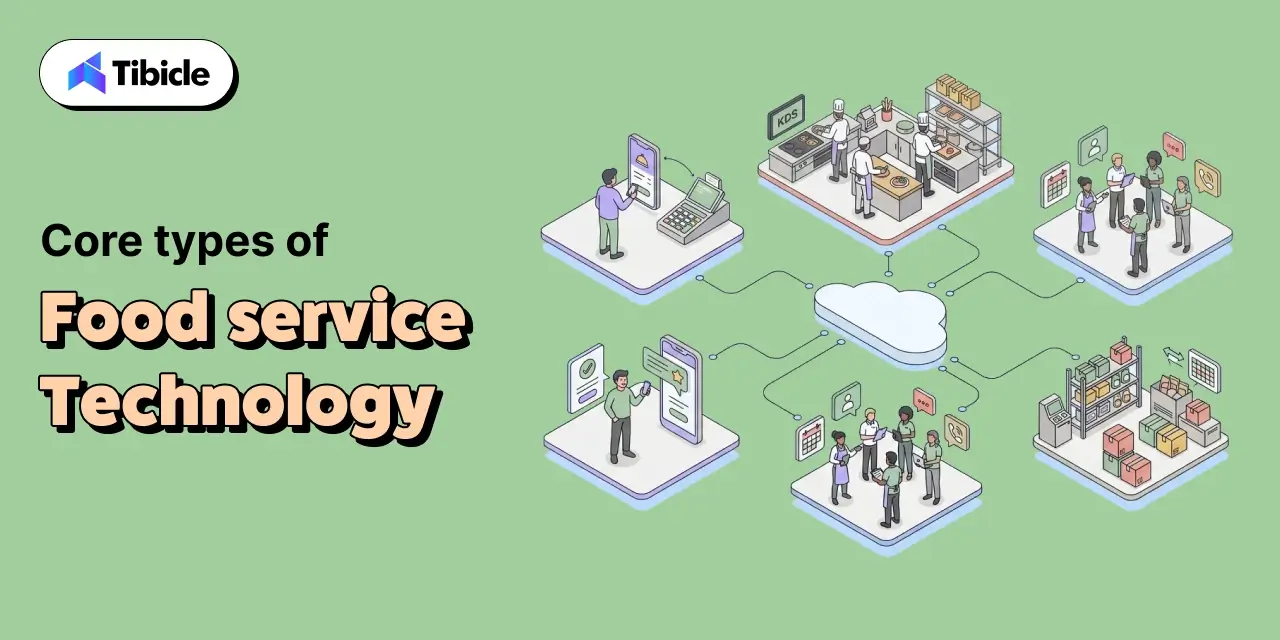
Point-of-Sale (POS) Systems

Modern POS software is no longer a transaction terminal; it functions as the central data hub for a restaurant. Multi-location support, real-time reporting, and native integrations with loyalty and delivery platforms determine which POS actually operates as infrastructure rather than a cash register with a screen. Toast, Square, Lightspeed, and Clover cover most of the market across different price and complexity tiers.

Kitchen Display Systems (KDS) and Automation

Kitchen display systems replace paper tickets with digital, updatable order queues visible across the entire back of house. This removes the miscommunication that paper handoffs cause during a rush and keeps modifiers and special requests visible in real time. Restaurants running a connected KDS report measurable improvement in table turn speed during peak service hours.

Inventory and Procurement Management Software

Inventory and procurement software tracks stock at the ingredient level, flags variance in real time, and generates AI-powered reorder recommendations tied directly to supplier data. Restaurants implementing modern inventory platforms report ROI above 150% in year one. (Supy, 2025)

Online Ordering and Digital Channels

Online ordering spans third-party marketplaces, first-party ordering apps, and QR code menus, each carrying its own margin profile. Restaurants running digital ordering channels see average check sizes roughly 30% higher than dine-in-only locations.

Labor Scheduling and Payroll Platforms

Labor is the single largest controllable expense in food service, typically 30 to 35% of revenue. Scheduling software targets that cost directly through demand forecasting, compliance tracking, and overtime alerts, catching problems before payroll processes them.

Food Safety and Compliance Technology

Cloud-based HACCP logging, IoT temperature sensors, and audit trail software turn compliance from a paper binder into a searchable record. A single safety violation or foodborne illness outbreak can cost an operator millions in lost sales and recall expenses, which is why this category functions as risk management rather than admin overhead.

Customer Loyalty and CRM Platforms

Loyalty and CRM platforms tied directly to POS data allow personalized offers based on actual visit and spend history instead of generic discounting. A 5 percentage point improvement in customer retention through loyalty programs can lift profit by up to 95%. (Bain, 2025)

Where Food Service Technology Creates the Most Business Impact

restaurant business models

Multi-Location Chains

At a multi-location scale, manual reporting and inconsistent operational controls stop working. Centralized data visibility, standardized processes, and cross-location benchmarking turn restaurant operations technology into required infrastructure rather than a convenience.

Fast-Casual and QSR Operators

Speed is the core KPI for fast-casual and QSR operators. Self-ordering kiosks, AI-powered drive-thru voice systems, and dynamic menu pricing all target throughput directly. IHOP and Applebee’s have both deployed voice AI agents to manage phone order volume at scale.

Fine Dining and Hospitality Groups

For fine dining and hospitality groups, CRM-driven personalization, reservation integration, and guest preference tracking build the ROI case around lifetime customer value rather than transaction speed.

Ghost Kitchens and Delivery-First Operators

For ghost kitchens and delivery-first operators, digital ordering systems are the entire operation, not supporting infrastructure. Integration between delivery aggregators, POS, and inventory data decides whether the business runs at a profit or bleeds margin on order errors.

Food Service Technology Comparison: Core Platforms by Function

Each technology category serves a distinct operational function at a different price point and payback window. Use the table below to match the category to your segment and expected ROI timeline before shortlisting vendors.

Technology CategoryCore FunctionBest For Avg. Monthly Cost ROI Timeline 
POS Systems Order management, payments, reporting All segments $0–$399/location 3–6 months 
Inventory Management Stock tracking, AI ordering Multi-unit, high volume $169–$429/month 3–9 months 
Kitchen Automation / KDS Back-of-house speed and accuracy QSR, fast-casual $50–$150/station 3–6 months 
Labor Scheduling Software Staffing, overtime, compliance All segments $50–$200/location 6–12 months 
Digital Ordering / Delivery Online channels, third-party integration Ghost kitchens, QSR Variable + commissions 3–6 months 
Food Safety & Compliance Tech HACCP, IoT monitoring, audit logs All segments, regulated $100–$300/month Ongoing risk reduction 
Loyalty & CRM Platforms Guest retention, personalization Multi-unit, full service $99–$500/month 3–6 months 

Enterprise pricing is custom across most categories. The figures above reflect mid-market tiers.

Not sure which stack fits your operation? Tibicle’s food tech consultants can map the right architecture to your scale and margin goals. Book a discovery call.

Food Service Technology Pricing: What Operators Actually Pay

Software Licensing vs. Total Cost of Ownership

Monthly SaaS pricing is one line item in a longer cost model. Hardware, including terminals, KDS screens, and IoT sensors, implementation and training, transaction processing rates, and integration fees all add to the total cost of ownership. A $189 per month POS plan commonly reaches $800 to $1,200 per month, all-in, once hardware and processing fees are factored in for a single location.

Free Tier vs. Paid Tier; When Free Stops Working

Free plans, such as Square, are the most common example and suit early-stage, single-location operators. Three signals indicate a business has outgrown the free tier: reporting needs span more than one location, inventory tracking requires ingredient-level detail rather than item counts, or the operation needs API access to connect third-party systems. At that point, paid tiers stop being optional.

Enterprise Pricing; What to Negotiate

Above a certain location count, custom pricing becomes standard. The levers worth negotiating are multi-location bundling, annual billing discounts of roughly 10 to 15%, dedicated support SLAs, and onboarding fee waivers.

ROI and Business Impact: The Numbers That Matter

Measured Returns by Technology Category

  • Inventory software: ROI above 150% in year one, with 10 to 15% reduction in food waste. (Supy, 2025)
  • AI forecasting: 20 to 50% reduction in inventory errors. (McKinsey, 2025)
  • Food cost control: 2 to 5% cost reduction through real-time variance detection.
  • Digital ordering: average check is roughly 30% higher than dine-in only.
  • Scheduling automation: $15,000–$40,000 in avoided manager replacement costs over three years.
  • Loyalty programs: a 5% retention improvement lifting profit 25 to 95%. (Bain, 2025)
  • AI phone reception: $3,000–$18,000 in recovered monthly revenue per location.

Payback Timelines by Segment

Payback windows run 3 to 6 months for POS and digital ordering, and 6 to 12 months for labor scheduling platforms, since scheduling ROI compounds through avoided overtime and turnover cost rather than an immediate transaction gain. A 2025 National Restaurant Association survey found that 76% of operators consider technology a measurable competitive edge. (NRA, 2025)

The Margin Math: Why Every Percentage Point Matters

At 3 to 5% margins, a 2 percentage point food cost reduction changes the outcome of a full year. For a five-unit operator running $1M in annual revenue per location, a 2% food cost reduction recovers $100,000 across the group, well above what most inventory platforms cost annually.

Risks and Implementation Challenges Operators Don’t Talk About

Integration Failure – When Systems Don’t Talk to Each Other

The most common hidden cost of new restaurant management software is a system that does not connect cleanly to what is already running. A platform that fails to integrate with existing POS or accounting software creates data silos, operational disruption, and unplanned custom development spend.

Data Quality Dependency

AI-powered forecasting and inventory tools only produce useful output when the data feeding them is accurate. Operators migrating from manual processes carry real exposure here, since messy historical data produces wrong predictions before anyone notices.

Staff Resistance and Change Management

Technology that staff refuse to use, or were never properly trained on, returns zero value regardless of cost. Skipping structured training and change management is one of the most predictable ways an implementation fails.

Cybersecurity Exposure

Every additional connected system, from payment processing to loyalty databases to supplier integrations, adds another point of vulnerability. Vendors should be evaluated directly on security certifications, specifically PCI DSS and SOC 2, not on sales assurances.

Over-Automation Risk

In full-service segments, particularly, removing too much human interaction erodes the guest experience that drives repeat visits and loyalty.

Vendor Selection Checklist for Food Service Technology

Before You Shortlist – Internal Readiness Questions

  • What is the current tech stack, and where are the integration dependencies?
  • Is there a dedicated implementation owner internally?
  • What payback timeline is acceptable?
  • Is the goal a single-point solution or a unified platform?

Vendor Evaluation Criteria

CriteriaWhat to Verify
Integration capabilityNative connectors to your existing POS/ERP 
Pricing transparency All-in TCO, not just the SaaS fee 
Security compliance PCI DSS, SOC 2 certification 
Scalability Multi-location support, API flexibility 
Implementation support Onboarding, training, go-live SLA 
Reference customers Same segment, similar scale 
Support model 24/7 vs. business hours, matters on a Friday night 

Red Flags to Watch For

Vague pricing, no reference customers in your segment, thin integration documentation, and contracts with no clearly defined data ownership terms are all reasons to keep looking.

Top Food Service Technology Platforms to Evaluate in 2025–26

restaurant business models

This is a neutral, informational list, not ranked and not endorsed. These platforms are frequently evaluated by operators at different scale points. Match them against the checklist above rather than brand recognition alone.

  • Toast – Full-stack restaurant management: POS, payroll, and marketing.
  • Square for Restaurants – Strong free tier, suited to early-stage and single-location operators.
  • Lightspeed Restaurant – Enterprise-grade, multi-location inventory and reporting.
  • Oracle Food and Beverage – Large chain and hospitality-grade infrastructure.
  • 7shifts – Labor scheduling and workforce management specialist.
  • Supy – Inventory and procurement for F&B, strong AI-driven ordering.
  • Smart Food Safe – Food safety, compliance, and HACCP automation.

No ranking is implied. Best fit depends on operator type, scale, and existing stack.

Why Tibicle LLP Is a Considered Choice for Food Service Technology Implementation

Tibicle  works with food and hospitality operators at the intersection of software development, integration architecture, and custom food tech builds. Where off-the-shelf platforms hit a ceiling, in custom ordering flows, proprietary loyalty engines, POS integrations with legacy infrastructure, or multi-channel delivery orchestration, Tibicle’s development team builds to spec instead of forcing a workaround.

The difference is not price. It is the ability to close the gap between what a SaaS vendor ships out of the box and what a scaling operator actually needs to run in production, day to day.

Evaluating a custom food tech build or integration project? Talk to Tibicle’s team.

Conclusion

Thin margins, labor cost pressure, and food waste are not abstract industry complaints. They are measurable line items that food service technology is proven to move. The operators pulling ahead in 2025 to 2026 are not running the most technology; they are running the stack matched correctly to their scale, deployed with real training discipline, and measured against actual operational benchmarks rather than vendor promises.

Ready to build or optimize your food service technology stack? Tibicle’s team helps operators at every scale, from integration audits to full custom builds. Schedule a consultation.

FAQs

What is food service technology and what does it include?
Food service technology covers all hardware, software, and AI systems used to manage restaurant operations, from POS and inventory to scheduling, safety compliance, and customer loyalty platforms.

How much does food service technology cost for a mid-size restaurant group?
Costs vary by category and scale. Mid-market inventory platforms run $169–$429/month per location, POS solutions run $189–$399/month. Enterprise plans are custom, and total cost of ownership including hardware and integrations typically runs 3 to 5 times the base SaaS fee.

What ROI can operators realistically expect from restaurant operations technology?
ROI timelines range from 3 to 12 months depending on category. Inventory software delivers 150%+ ROI in year one for many operators, AI forecasting reduces inventory errors 20 to 50%, and scheduling automation can save $15,000–$40,000 in management costs over three years.

What are the biggest risks when implementing food service technology?
Integration failure with existing systems, poor data quality undermining AI tools, staff resistance without structured training, cybersecurity exposure from connected systems, and over-automation that degrades guest experience in full-service segments.

How do I choose the right food service technology solutions for my operation?
Start with a tech stack audit and map integration dependencies before shortlisting vendors. Evaluate on total cost of ownership, integration capability, security certifications, scalability, and reference customers in your specific segment, not brand recognition alone.

Is custom food service technology development better than off-the-shelf platforms?
Off-the-shelf platforms suit most operators at standard scale. Custom development becomes justified when ordering flows, loyalty architecture, or multi-system integrations exceed what SaaS vendors support natively, particularly for chains with proprietary processes or complex supplier ecosystems.

5 Best Inventory Management Apps in 2026

Introduction

An inventory management apps is now a critical tool for businesses looking to reduce stockouts, improve inventory visibility, and scale operations efficiently. In 2023, inventory distortion, stemming from stockouts and overstocking, cost global retailers $1.77 trillion. This makes inventory management a critical operational decision. Despite this, 43% of companies still rely on spreadsheets for inventory visibility in 2026.

inventory management app

The inventory management software market is projected to reach $2.75 billion in 2026, growing at a 9.13% CAGR through 2034, driven by the increasing complexity of managing multiple channels and SKUs. Inefficient inventory practices can lead to an 11% loss in annual revenue.

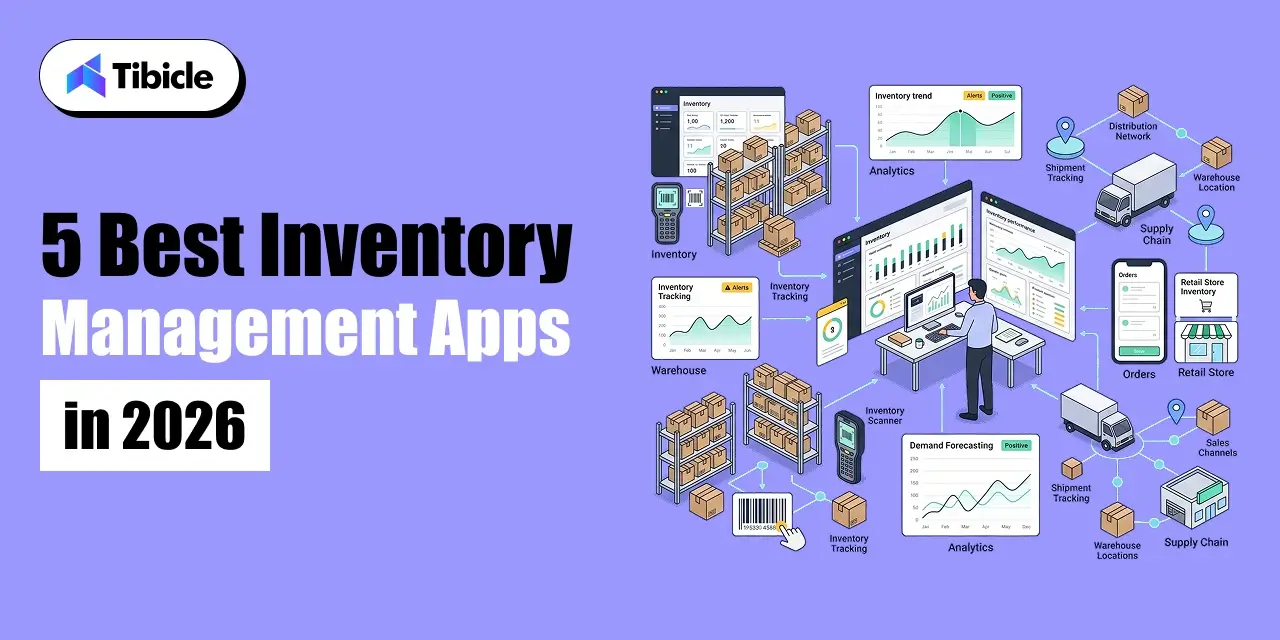
For decision-makers, the challenge lies not in whether to invest in an inventory management app, but in choosing the right one from a crowded market with seemingly similar features and hidden costs. This manual reviews the 5 best inventory management apps of 2026, focusing on features, pricing, ROI, scalability, and use-case fit, to support informed decision-making.

What Is an Inventory Management Apps?

Core Functions That Define an Inventory Management Apps

inventory management app

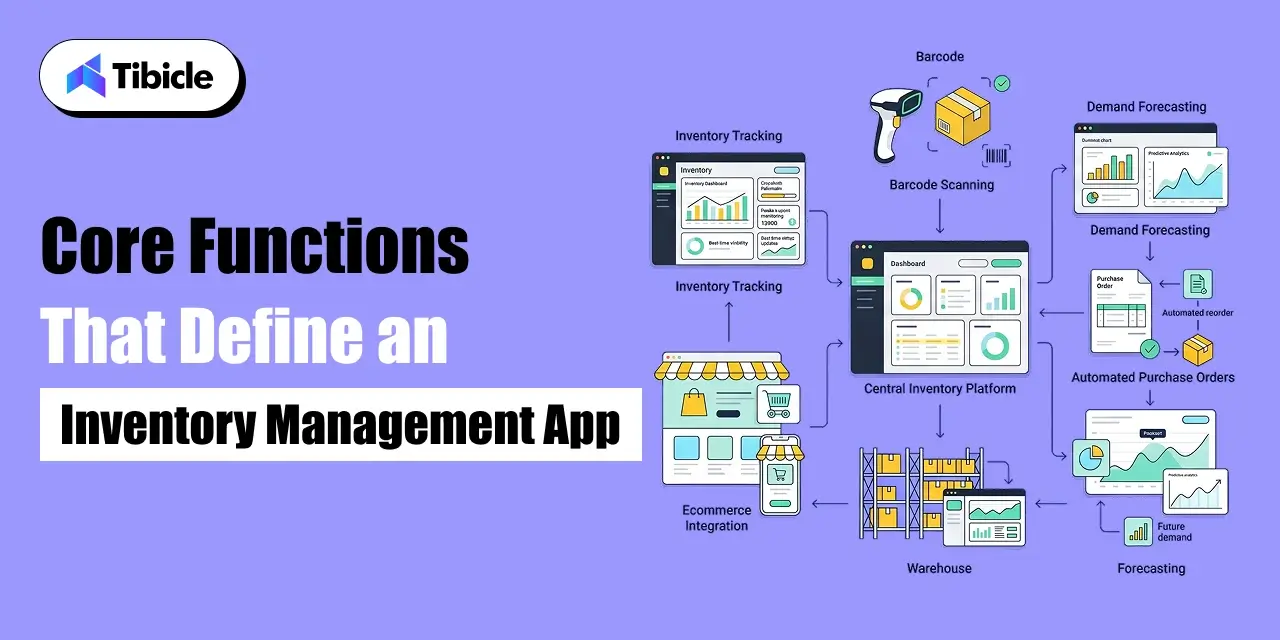
An inventory management app is a software system that tracks stock levels, manages purchase orders, monitors warehouse activity, and synchronises inventory data across sales channels and locations in real time. At its foundation, it replaces the spreadsheet with a system that updates automatically, alerts proactively, and integrates with the other tools the business depends on.

The core functions that define a production-grade inventory management system include:

Real-time inventory tracking: live stock level visibility across all locations and channels, updated with every transaction.

Automated reorder triggers: rules-based or AI-driven purchase order generation when stock falls below defined thresholds, the foundation of reorder automation.

Demand forecasting: historical sales data and seasonal trend analysis used to predict future stock requirements and prevent both stockouts and overstocking.

Barcode and QR scanning: mobile or fixed scanner integration for fast, accurate stock intake, picking, and cycle counting without manual data entry.

Multi-location inventory sync: unified visibility across multiple warehouses, stores, and 3PL partners from a single interface.

Purchase order management: end-to-end supplier order creation, tracking, and receipt confirmation with automated matching against expected deliveries.

Businesses that implement automated inventory management reduce stockouts by 30 % compared to manual approaches. That single metric, the reduction in revenue lost to empty shelves, is typically the primary driver of payback period calculation for any inventory management investment.

It is also worth distinguishing between standalone inventory management apps and ERP-embedded inventory modules. Standalone apps, the five covered in this guide, are purpose-built for inventory operations and offer faster implementation, lower cost, and more focused functionality. ERP-embedded modules offer deeper integration across finance, HR, and operations but come with significantly higher implementation cost and complexity. The right choice depends on operational scope and growth stage.

What to Look for Before Choosing an Inventory Management Apps

Scalability and Multi-Location Support

The most common and most expensive mistake in inventory management software selection is choosing a tool that fits today and breaks in 18 months. A business operating two warehouses today may need to manage 20 in three years. A retailer selling on one channel may expand to five. The app you select needs to support that growth without requiring a full platform migration, because platform migrations at scale are expensive, disruptive, and time-consuming.

Evaluate multi-location inventory capability not just as a feature checkbox but as an architectural question. How does the app handle stock transfers between locations? Does it support zone-level tracking within a warehouse? Can it sync in real time with third-party logistics partners? Supply chain visibility at the multi-location level is where mid-market inventory management systems most frequently fall short.

Integration With Existing Business Systems

An inventory management app that does not connect cleanly to your accounting system, ecommerce platform, and CRM is an app that creates manual reconciliation work, which is precisely the problem you are trying to eliminate. Before selecting any tool, map your current technology stack and verify native integration support for every system in it.

The integrations that matter most for most businesses are: QuickBooks or Xero for accounting, Shopify or WooCommerce for ecommerce, and the shipping or logistics platforms handling fulfilment. API availability and webhook support are important for any custom integration requirements beyond the standard connector library. A vendor with a limited API or no webhook support will constrain your ability to build the connected operations infrastructure your business needs as it grows.

Total Cost of Ownership vs. Sticker Price

The monthly subscription price is rarely the number that matters. Businesses spend 25 to 35 % of their operational budgets on inventory, making even small inefficiencies costly over time. That same principle applies to the tools managing inventory: the cost that appears in the pricing page is typically a fraction of what the tool actually costs over 36 months.

The cost components that consistently catch businesses off guard are per-user fees that scale with headcount, ecommerce channel add-ons charged per integration, implementation and data migration fees that are not included in the base subscription, staff training overhead that is never line-itemed in a vendor quote, and annual price escalation clauses in multi-year contracts. Evaluate every tool on a 3-year total cost of ownership basis, not a monthly sticker price.

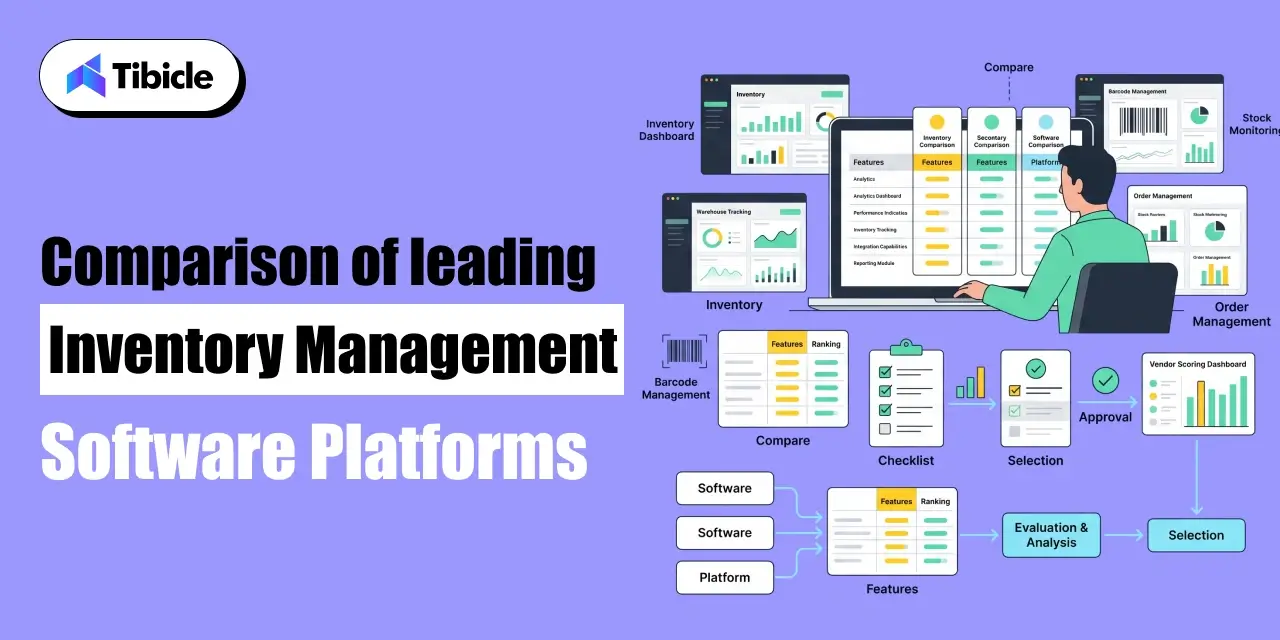
Comparison of leading inventory management software platforms

inventory management app

1. Cin7: Best for Multi-Channel Retail and Mid-Market Brands

Cin7 is a leading inventory management system for mid-market brands with multiple sales channels. It excels in channel integrations, offering a real-time inventory view across retail POS, ecommerce platforms, wholesale, and 3PL. For brands on Shopify, Amazon, and physical stores, Cin7 provides seamless multi-channel inventory sync, a feature that competitors often struggle to match without heavy customisation.

Key features: real-time multi-channel stock sync, advanced warehouse management with zone and bin tracking, built-in EDI for wholesale and retail compliance, demand forecasting as an add-on module, and automated purchase order management.

Pricing: starts at approximately $349 per month. Channel add-ons and per-user fees apply at higher tiers.

Limitations: native accounting integration is limited outside of Xero and QuickBooks. The demand forecasting module is an additional cost rather than included in the base subscription.

Ideal business size: mid-market retailers and wholesalers with 50 to 500 SKUs operating across two or more sales channels.

2. Zoho Inventory: Best for Growing SMBs and Multi-Marketplace Sellers

Zoho Inventory is an ideal choice for small and growing businesses needing affordable multi-channel inventory tracking. It’s particularly suited for businesses expanding to multiple marketplaces, like adding Amazon to Shopify, and requires a cost-effective solution to manage that growth.

Key features: multi-channel order and inventory management across Shopify, Amazon, eBay and others, barcode scanning with mobile app support; basic demand forecasting, native integration with Zoho Books for accounting; and automated reorder point alerts.

Pricing: starts at $39 per month, making it the most affordable option in this guide with a meaningful feature set.

Limitations: lower pricing tiers cap order volume and item count, which forces upgrades earlier than the price point suggests. The demand forecasting functionality is basic compared to that of Cin7 or NetSuite.

Ideal business size: SMBs and early-stage ecommerce brands with straightforward inventory needs and a Zoho ecosystem already in place.

3. Fishbowl: Best for Manufacturers and QuickBooks-Dependent Teams

Fishbowl is a specialised inventory management software designed for manufacturing businesses using QuickBooks. It offers unmatched integration with QuickBooks, eliminating reconciliation issues faced by other inventory management solutions. For those whose financial records rely on QuickBooks, Fishbowl provides a seamless experience.

Key features: Bill of Materials (BOM) and work order management for manufacturing, deep two-way QuickBooks sync, multi-location warehouse management, barcode scanning for shop floor and warehouse operations, and purchase order automation.

Pricing: approximately $349 per month on a SaaS model, or available as a one-time perpetual licence for businesses preferring to avoid recurring fees.

Limitations: a QuickBooks licence is effectively a prerequisite; the tool’s value proposition is substantially reduced without it. Demand forecasting capability is limited compared to AI-powered alternatives.

Ideal business size: small to mid-size manufacturers and product businesses with production operations that need BOM management alongside inventory tracking.

4. NetSuite: Best for Enterprise-Grade Operations and the Oracle Ecosystem

NetSuite stands out as the only true ERP in this comparison, ideal for enterprise-scale businesses with complex multi-entity, multi-currency, and multi-warehouse operations. Unlike standalone inventory management apps, NetSuite’s inventory system is integrated within a comprehensive financial and operational platform, allowing stock data to connect seamlessly with financial reporting, demand forecasting, procurement, and supply chain visibility.

Key features: AI-powered demand forecasting, real-time multi-location and multi-warehouse inventory, advanced financial consolidation across entities, built-in procurement and supplier management, and full supply chain visibility from PO to delivery.

Pricing: custom pricing, typically starting above $2,000 per month at mid-market scale. Implementation costs range from $10,000 to $100,000 or more depending on scope.

Limitations: the implementation cost and timeline make NetSuite inaccessible for most SMBs. The platform requires dedicated administrator resource post-launch. Total cost of ownership is significantly higher than any other option in this guide.

Ideal business size: enterprise businesses and fast-scaling mid-market companies with multi-entity operations, international presence, or complex supply chain requirements.

5. inFlow: Best for Lean Teams and Cost-Conscious Operations

inFlow is an excellent inventory tracking app for small teams seeking reliable, straightforward inventory management without unnecessary features. Its user-friendly interface stands out in its category, and it integrates seamlessly with QuickBooks and Xero for essential accounting connectivity. Ideal for lean operations managing a simple product catalog from one or two locations, inFlow provides the necessary tools without the complexity of larger platforms.

Key features: clean, user-friendly interface with low onboarding overhead, barcode scanning with mobile app, multi-location support, native QuickBooks and Xero integration, and purchase order management with supplier tracking.

Pricing: starts at $89 to $189 per month, positioned between Zoho’s entry price and the mid-market platforms.

Limitations: no demand forecasting capability. No Bill of Materials support, which rules it out for any manufacturing use case.

Ideal business size: small businesses, lean operations, and teams that prioritise ease of use and a clean interface over advanced analytics or manufacturing functionality.

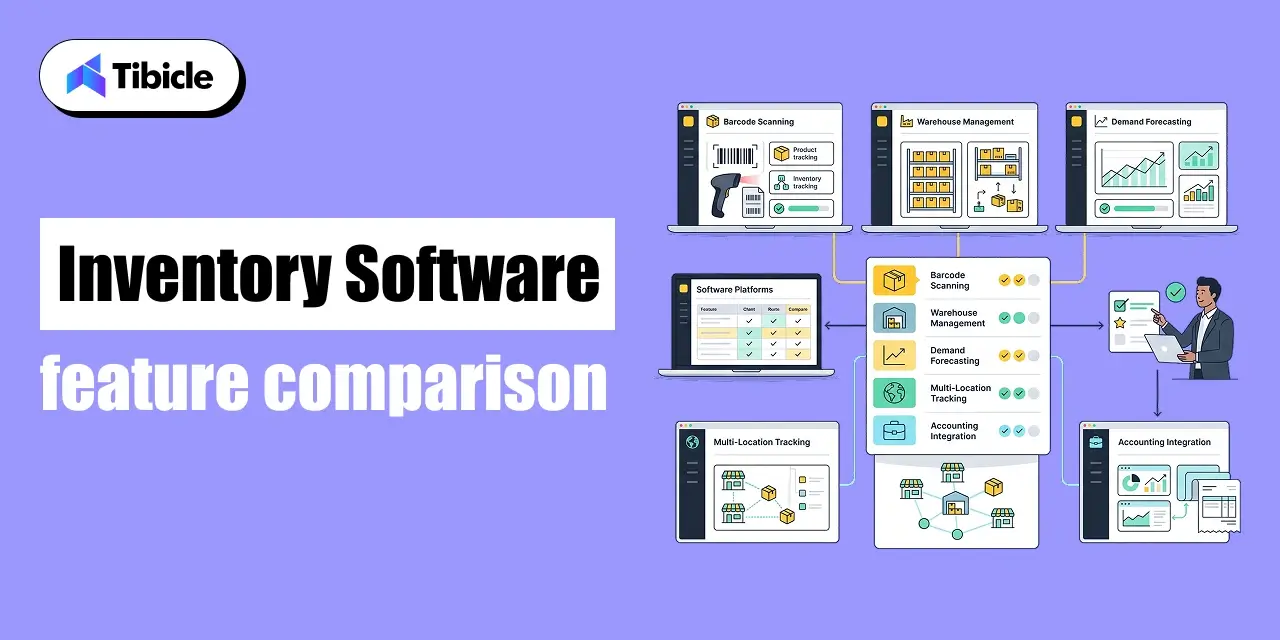
Feature-by-Feature Comparison Table

The table below maps all five inventory management apps across the features that matter most to purchase decisions. Use it alongside the individual app profiles above to identify which tool aligns with your specific operational requirements.

Inventory software feature comparison

Inventory software

The table below maps all five inventory management apps across the features that matter most to purchase decisions. Use it alongside the individual app profiles above to identify which tool aligns with your specific operational requirements.

FeatureCin7Zoho InventoryFishbowlNetSuiteinFlow
Multi-Location Support
Barcode/QR Scanning
Demand ForecastingAdd-onBasicLimitedAI-poweredNo
Manufacturing (BOM)NoNo
Native Accounting IntegrationLimitedZoho BooksQuickBooksBuilt-inQuickBooks/Xero
Starting Price/mo~$349$39~$349 (one-time license available)Custom$110
Best ForMulti-channel retailGrowing SMBsManufacturersEnterpriseSmall teams

Note: Feature availability and pricing are based on published data as of 2026. Verify current pricing tiers with each vendor before committing, as subscription structures update regularly.

Which Inventory Management Apps Fits Your Business Model?

Feature parity at the surface level masks significant differences in use-case fit. The table below maps each app to the business model it serves best, based on the operational requirements that define each model.

Business TypeRecommended App(s)Key RequirementsSelection Note
Retail / eCommerceCin7, Zoho InventoryMulti-channel sync, real-time inventory, barcode scanningCin7 for multi-channel complexity; Zoho for early-stage cost control
ManufacturingFishbowl, NetSuiteBill of Materials (BOM), work order management, production trackingFishbowl for QuickBooks-dependent teams; NetSuite for full ERP scope
Wholesale / B2BCin7, NetSuiteBulk order logic, tiered pricing, multi-warehouse managementNetSuite for enterprise scale; Cin7 for mid-market efficiency
Small Business / Lean TeamsinFlow, Zoho InventorySimple interface, affordable pricing, core stock trackinginFlow for straightforward ops; Zoho for growing multi-channel sellers

Pricing Breakdown and Hidden Costs

AppBase PriceTypical Onboarding CostKey Hidden CostsBest Model Fit
Cin7~$349/mo$1,000–$3,000Channel add-ons, per-user feesMid-market retail
Zoho Inventory$39/mo$500–$1,500Order and item caps on lower tiersSMBs, startups
Fishbowl~$349/mo or one-time license$1,000–$4,000QuickBooks licence requiredManufacturers
NetSuiteCustom (typically $2,000+/mo)$10,000–$100,000+Module fees, user licencesEnterprise
inFlow$189/mo$500–$1,000Limited forecasting, no BOMLean teams

Subscription vs. One-Time Licence Models

Four of the five apps in this guide use SaaS subscription models: Cin7, Zoho Inventory, NetSuite, and inFlow. Fishbowl offers both a monthly SaaS option and a one-time perpetual license. Perpetual licenses can be cost-effective for businesses with stable inventory needs, while SaaS is ideal for those wanting regular updates and cloud access.

A common hidden cost in SaaS models is tier-based feature gating. Entry-level subscriptions on Zoho and Cin7 limit order volumes, item counts, and user seats, leading to quicker upgrades than expected. Choose your subscription tier based on an 18 to 24 month growth trajectory rather than current volume.

Implementation and Migration Costs

NetSuite implementations can range from $10,000 to $100,000 or more, depending on modules and customizations. Mid-tier tools like Cin7 and Fishbowl typically cost between $1,000 and $5,000 for onboarding, while Zoho and inFlow are more accessible at $500 to $1,500 for standard setups.

It’s important to consider additional costs that are often overlooked, including data migration, staff training (hands-on sessions for warehouse teams), and custom integration development, which can add 20 to 40 percent to the overall implementation cost.

When Free Becomes Expensive

Both Zoho Inventory and inFlow have low introductory pricing that makes them seem more affordable than Cin7 or Fishbowl initially. However, as your business grows, you’ll encounter limitations: Zoho’s $39 tier restricts users, order volume, and warehouse locations, while inFlow’s $189 tier limits user seats and reporting features. If you’re likely growing, you’ll hit these caps within 12 to 18 months and face increased upgrade costs. Always assess costs based on your projected volume in 24 months, not just your current levels.

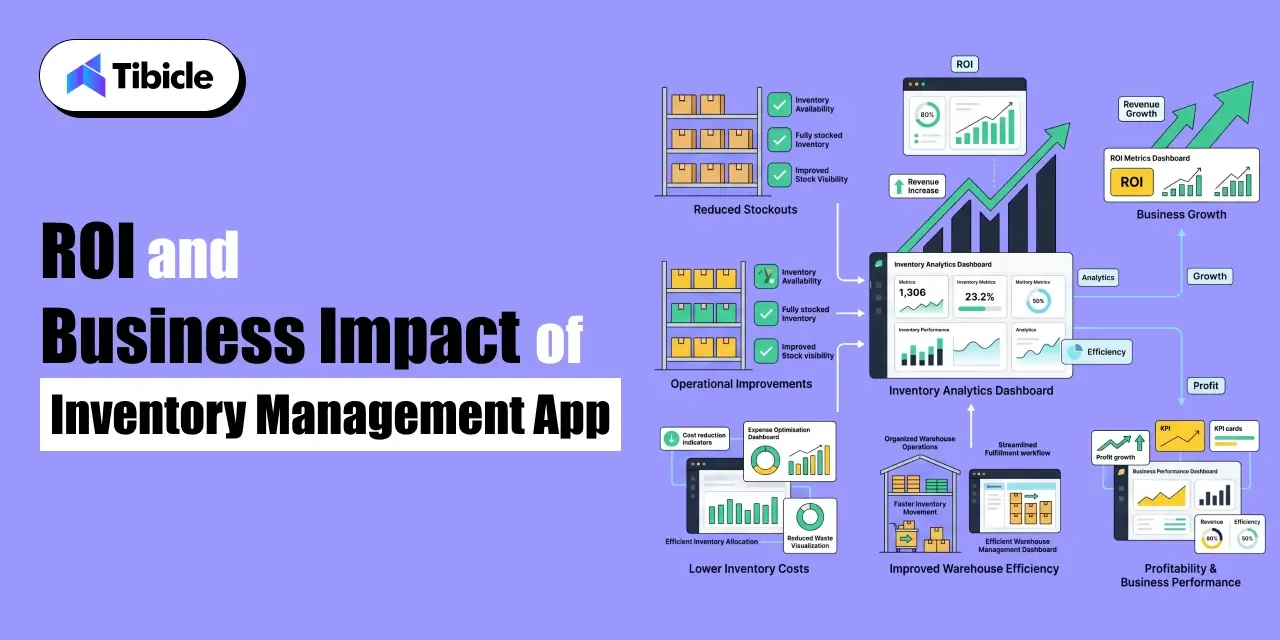
ROI and Business Impact of Inventory Management Apps

ROI and Business

Measurable Gains From Automated Inventory

The ROI for inventory management software is backed by documented performance data across various industries. In 2025, RFID-enabled merchants improved inventory accuracy by 15 percentage points, reducing fulfillment latency to under two hours, which positively impacted customer satisfaction. Overstocking can increase storage costs by 20-30%, but automated demand forecasting and reorder automation help mitigate this.

Key operational gains post-implementation include: reduced manual labor hours through barcode scanning, fewer emergency reorders due to proactive automation, lower inventory write-offs thanks to better demand forecasting, and faster order fulfillment with real-time stock visibility that minimizes errors.

Calculating Payback Period

The payback period formula for any inventory management app investment is straightforward: annual cost of the app divided by annual savings from reduced stockouts plus labour savings plus carrying cost reduction. For most mid-market businesses, this calculation produces a payback period of 4 to 8 months.

The KPIs to track once the system is live are inventory turnover ratio (how quickly stock is sold and replaced), stockout rate (the percentage of demand that goes unfulfilled due to zero stock), and order accuracy percentage (the proportion of orders fulfilled without error). These three metrics together form the operational scorecard that confirms whether the investment is delivering its projected return.

Vendor Lock-In and Data Portability

Proprietary data formats and limited export options in inventory management software can raise switching costs if the tool underperforms or the business outgrows it. Before signing a contract, ensure that stock data, transaction history, and supplier records can be exported in standard formats (at least CSV) and that the process is documented for user access.

The risk of vendor lock-in is highest with NetSuite due to high implementation and data migration costs, making switching difficult. In contrast, Zoho and inFlow have lower implementation costs, resulting in more manageable switching expenses. Consider this alongside feature fit and pricing during your selection process.

Vendor Selection Checklist for Decision-Makers

Use this checklist when evaluating any inventory management app or custom inventory management system before committing to a purchase or build decision:

  • Does the app support your current SKU volume and your projected volume at 24-month scale?
  • Can it integrate natively with your existing ERP, accounting platform, and ecommerce stack without custom middleware?
  • What is the total 3-year cost including subscription fees, implementation, training, and add-on modules?
  • Does the vendor offer SLA-backed uptime guarantees with defined compensation for downtime events?
  • Is data exportable in standard formats (CSV and API access) without requiring vendor assistance
  • Does the platform support your industry-specific compliance requirements (food expiry tracking, serial number traceability, lot management)?
  • What is the vendor’s documented track record with businesses at your size and operational complexity?
  • Is a free trial or sandbox environment available before committing to a paid subscription?

Why Tibicle Is a Strong Choice for Custom Inventory Management Apps Development

Off-the-shelf inventory management apps solve 80 % of inventory management requirements effectively. The remaining 20% of businesses with unique workflows, industry-specific compliance requirements, or operational complexity that standard tools cannot accommodate need a custom-built inventory management system designed around their exact processes, not adapted to fit the constraints of a generic platform.

Tibicle builds custom inventory management software for mid-market businesses that have outgrown spreadsheets and generic tools but do not need or cannot justify the cost of a full NetSuite ERP implementation. Core capabilities include multi-warehouse real-time inventory sync, role-based access control for warehouse, procurement, and management functions, custom reporting dashboards built around the KPIs that matter to your operations, and API integration with any existing ERP, accounting, or ecommerce system in your stack.

The engagement model starts with a structured discovery phase that maps your current inventory workflows, identifies the specific failure points costing revenue, and produces a build scope tied directly to measurable operational outcomes. Pricing is milestone-based with transparent phase-wise breakdowns, no lump-sum quotes, and no scope ambiguity. Post-launch support is provided under a defined SLA.

Cross-industry experience across retail, manufacturing, logistics, and wholesale means the team builds with commercial context, not just technical capability. If the five apps in this guide do not fit your operational requirements, a custom inventory management app built by Tibicle might. Talk to Tibicle’s team to scope an inventory management solution that matches your exact workflow.

Conclusion

The right inventory management app for your business is determined by three variables: your current and projected operational scale, the business model you are running, and the systems your new platform needs to integrate with. There is no single best answer but there is a right answer for each business context, and this guide has laid out the data to find it.

Zoho Inventory provides the most accessible entry point for SMBs and growing ecommerce brands thanks to its affordable pricing and strong multi-channel capabilities. Mid-market retailers operating across multiple sales channels will find Cin7 to be the most balanced solution for inventory visibility and operational control. Businesses that rely heavily on QuickBooks and require manufacturing functionality should consider Fishbowl. NetSuite remains the benchmark for enterprise organisations needing a complete ERP ecosystem with advanced inventory management. Meanwhile, inFlow is an excellent fit for lean teams seeking a straightforward, cost-effective solution without the complexity of larger platforms.

Use the feature comparison table and vendor checklist in this guide as your decision tools. If none of the five apps fits your operational requirements precisely, a custom inventory management system built around your specific workflows is the alternative worth evaluating. Schedule a free consultation with Tibicle to discuss a custom inventory management app built for your business needs.

Frequently Asked Questions

What is the best inventory management app for small businesses in 2026?
Zoho Inventory and inFlow are strong options for small teams. Zoho starts at $39/month with multi-channel support, while inFlow offers a clean interface with  QuickBooks/Xero integration from $110/month.

How much does an inventory management app cost?
Pricing ranges from $39/month (Zoho Inventory) to custom enterprise pricing (NetSuite). Factor in implementation, training, and add-on fees for an accurate 3-year cost estimate.

Can an inventory management app integrate with QuickBooks?
Yes. Fishbowl offers the deepest QuickBooks integration among standalone apps. Zoho Inventory and inFlow also support QuickBooks and Xero syncing.

What ROI can I expect from an inventory management app?
Mid-market businesses typically see a 4–8 month payback period through reduced stockouts, lower carrying costs, and fewer manual labor hours.

When should a business consider custom inventory management software instead of off-the-shelf apps?
When your workflows require industry-specific compliance, multi-system integrations that existing apps don’t support, or unique reporting and automation that standard tools can’t deliver.

Frontend Development for Beginners: The 2026 Learning Roadmap That Actually Works

Introduction

JavaScript is used by 66% of professional developers, React holds 44.7% adoption, and TypeScript has reached 44%, according to the Stack Overflow Developer Survey 2025. Frontend development is, by usage data, the most common entry point into a software career.

frontend development

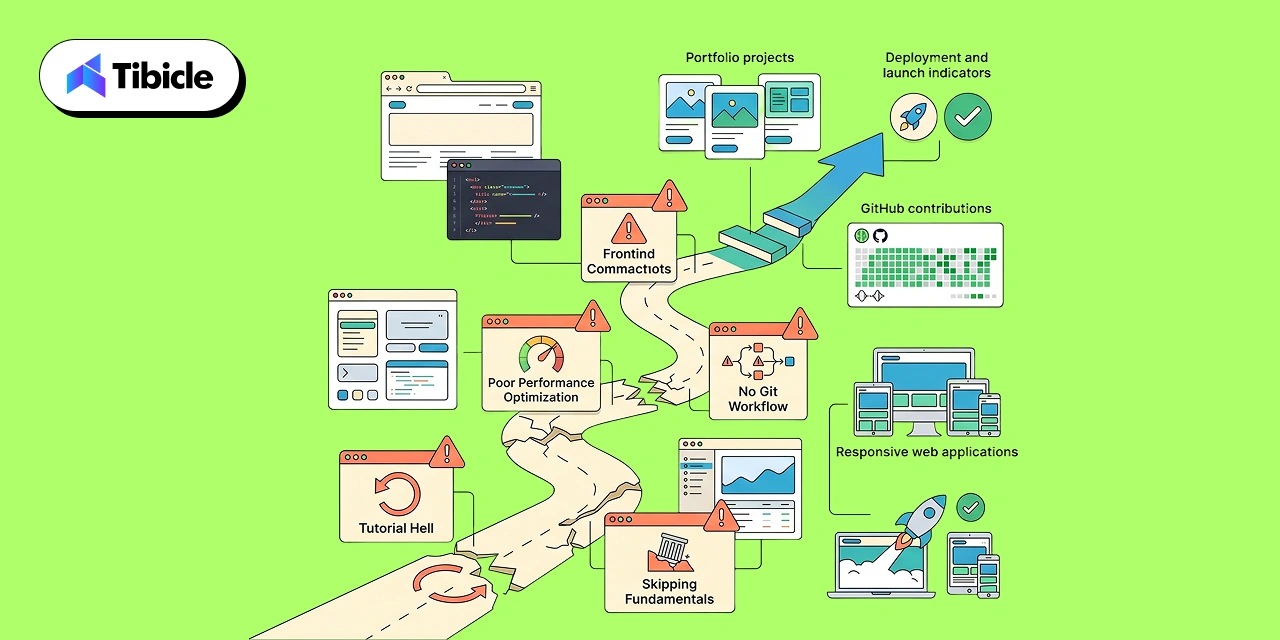
The problem is not a shortage of learning resources. The problem is tutorial hell: the experience of completing 40 hours of video content and still not being able to build a working app without the instructor’s code in front of you. Most beginners burn three to six months learning the wrong things in the wrong order.

This frontend development guide is built around one principle: the order you learn things matters more than the resources you use. It lays out the exact sequence for 2026, phase by phase, with data on timelines and the specific mistakes that derail beginners at each stage.

What Is Frontend Development in 2026?

Frontend development is the practice of building the interfaces that users see and interact with on websites and web applications. It covers everything between the data your backend produces and the experience your user has: layout, interactivity, performance, and accessibility.

In 2026, frontend development has expanded well beyond static HTML pages. The U.S. Bureau of Labor Statistics projects 7% job growth for web developers through 2034, with roughly 14,500 annual job openings. Employers now expect responsive design, component-based architecture, Core Web Vitals optimization, and TypeScript proficiency alongside traditional HTML, CSS, and JavaScript fluency.

The React Compiler, which shipped as stable in late 2024, automates performance optimizations like memoization that once required manual effort, changing how beginners learn React patterns. AI coding assistants are reshaping how juniors learn: 84% of developers say they use or plan to use AI tools in their workflow, per the 2025 Stack Overflow Survey. Learning frontend development today means learning alongside AI tooling, not instead of it.

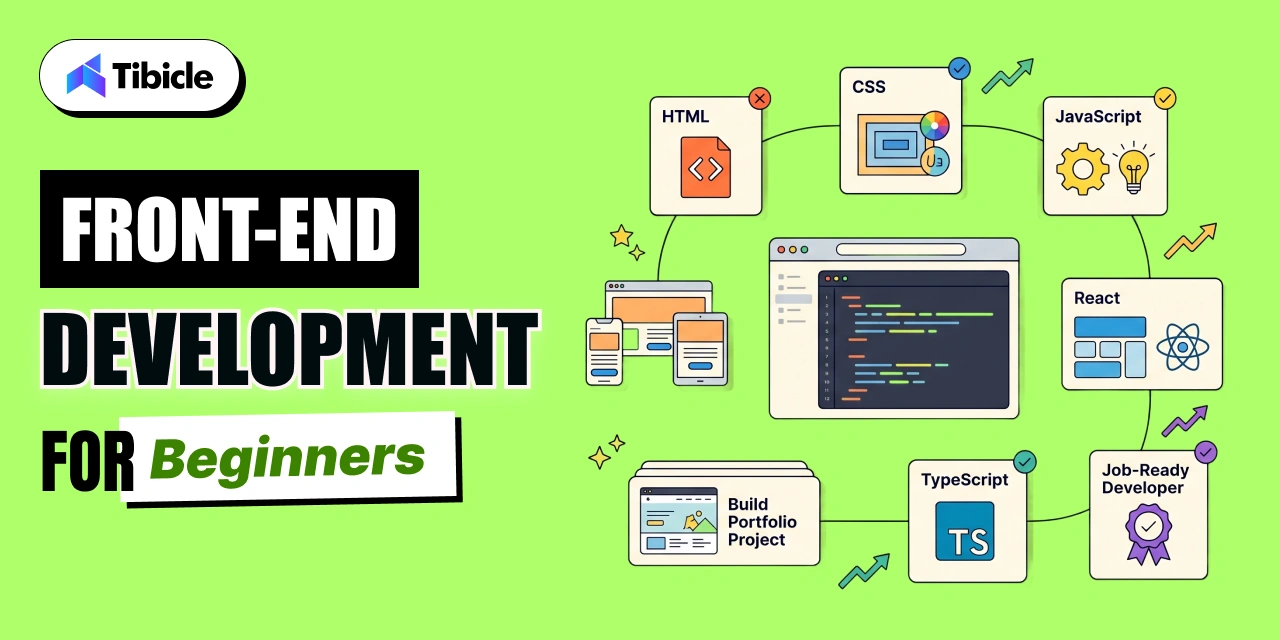
The Frontend Development Learning Roadmap: Phase by Phase

frontend development

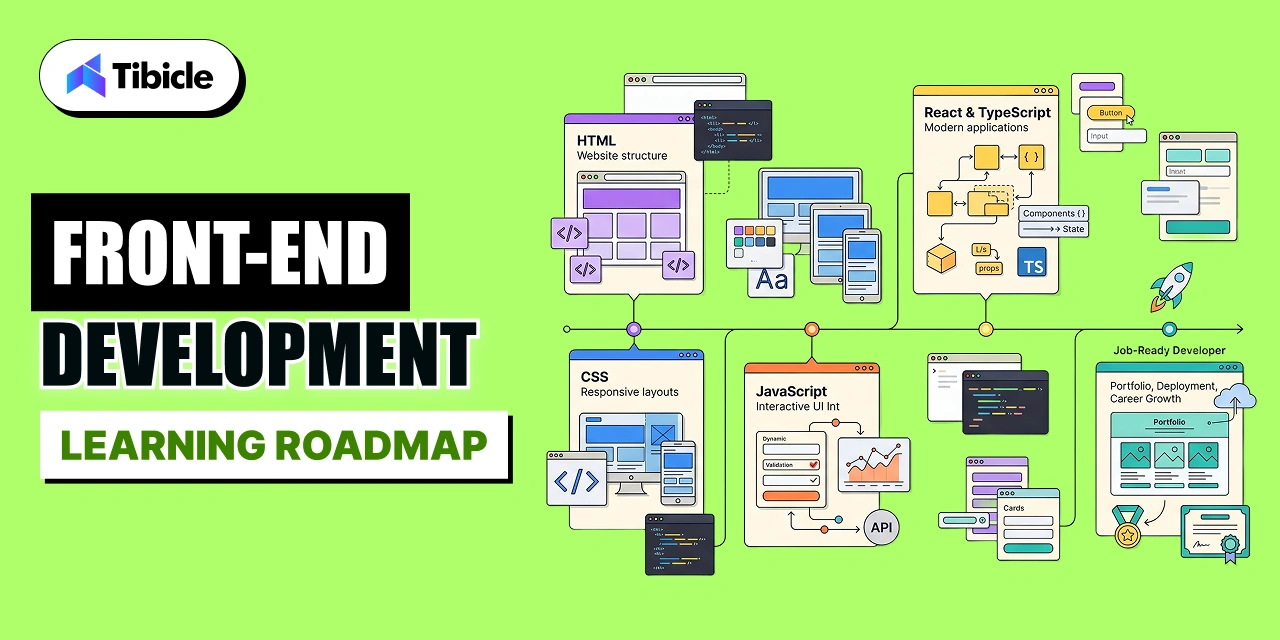
Most beginners who fail do so between Phase 1 and Phase 3. They rush toward React before their CSS and JavaScript fundamentals are solid enough to understand what React is doing. The timeline below assumes 2-3 hours of practice daily. At that pace, most learners reach job-readiness in 8-10 months.

Phase 1: HTML and Semantic Structure (Weeks 1-3)

HTML is the skeleton of every web page. Learning it is faster than most beginners expect, but most beginners learn it wrong: they memorize tags without understanding semantic structure.

Semantic HTML uses elements that communicate meaning to browsers and assistive technologies. A screen reader navigating a page built with proper header, nav, main, article, and footer elements can provide a usable experience. The same page built entirely with div elements cannot. Employers in 2026 evaluate semantic HTML during frontend development interviews because it signals an understanding of accessibility and how browsers parse documents.

By the end of Phase 1, you should be able to build a multi-section HTML page using appropriate semantic elements, link between pages, and embed images and forms without referencing documentation for every tag.

Phase 2: CSS, Flexbox, Grid, and Responsive Design (Weeks 4-7)

CSS is where most frontend development beginners slow down or quit. The reason is not complexity. It is that CSS taught in isolation from real layouts produces skills that do not transfer to real projects.

The learning sequence that works: start with the box model, then CSS selectors, then Flexbox, then CSS Grid. Add responsive design with media queries after you are comfortable with Flexbox layouts. Do not add Tailwind CSS until you can build a layout from scratch without it. Tailwind is a utility library that accelerates work you already know how to do. Beginners who reach for Tailwind before understanding the box model write styles they cannot debug.

Core Web Vitals, specifically Cumulative Layout Shift (CLS), are directly affected by how well you understand CSS layout. Pages with CLS above 0.1 are penalized in Google rankings. Learning CSS well is not just a user experience investment; it is an SEO investment.

Phase 3: JavaScript Fundamentals and DOM Manipulation (Weeks 8-14)

JavaScript is where frontend development becomes interactive. This phase is the longest because JavaScript has the steepest conceptual curve of the three foundational technologies.

The concepts that matter most for a working frontend developer: variables and data types, functions and scope, arrays and objects, DOM manipulation and event listeners, asynchronous JavaScript with promises and async/await, and the fetch API for making HTTP requests. That is the complete list. Everything else is either framework-specific or an advanced pattern that emerges from these fundamentals.

Common mistake: skipping DOM manipulation to jump straight to React. React is a JavaScript library that abstracts the DOM. Developers who skip direct DOM work do not understand why React exists or what problem it solves. That gap surfaces in every technical interview.

By the end of Phase 3, you should be able to build a working to-do application, a weather app using a public API, and a form with client-side validation, all in vanilla JavaScript without a framework.

Phase 4: React and TypeScript (Weeks 15-24)

React is the first frontend framework worth learning in 2026 for four reasons: 44.7% adoption among professional developers, the largest ecosystem of component libraries and tooling, the most job postings, and the most learning resources with the highest average quality.

Start with functional components and hooks: useState, useEffect, useContext. Add React Router for client-side navigation. Add a state management solution (Zustand is simpler than Redux for most use cases in 2026). Then add TypeScript. TypeScript has reached 44% developer adoption not because it is required but because it catches an entire class of errors before they reach production.

Vite has replaced Create React App as the standard development tooling for new React projects in 2026. If a tutorial still uses Create React App, it is out of date. Next.js is the production-grade framework layered on top of React for server-side rendering and static generation. Learn React before Next.js. Knowing the tool that Next.js builds on top of makes Next.js significantly easier to learn.

Common Mistakes Beginners Make in Frontend Development

Common Mistakes

These four mistakes account for the majority of stalled frontend development learners in 2026:

  1. Reaching for Tailwind CSS before understanding Flexbox. Tailwind accelerates what you already know. Applied before CSS fundamentals are solid, it produces styles you cannot debug because you do not understand what they are doing.
  2. Copying Vite or Webpack configurations without reading them. Build tool configuration contains decisions about how your frontend development project compiles, optimizes, and deploys. Developers who do not understand their config cannot diagnose build failures.
  3. Not using Git from day one. Version control is not a tool you add later. Every project you build during the learning phase should be committed to GitHub. Employers look at GitHub profiles during frontend development hiring. A profile with 40 weeks of consistent commits tells a story no resume can.
  4. Building without measuring. Chrome DevTools, Lighthouse, and Core Web Vitals are part of the frontend development toolkit. Every project you ship should be audited for performance before you add it to a portfolio.

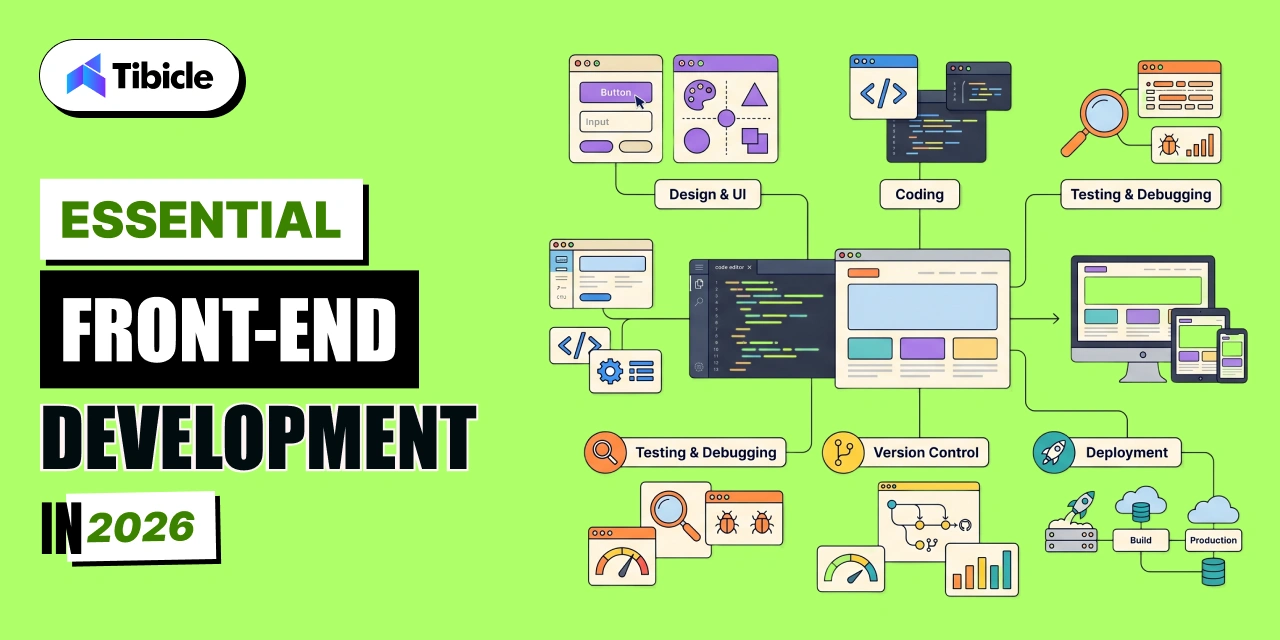
Essential Frontend Development Tools in 2026

Essential Frontend

The tool stack for a working frontend developer in 2026 is shorter than most tutorials suggest. Master these five before adding anything else:

  • VS Code: The dominant code editor for frontend development. Install the Prettier, ESLint, and GitLens extensions as your first three additions.
  • Chrome DevTools: Your debugging environment. Learn the Elements panel for HTML and CSS inspection, the Console for JavaScript debugging, the Network tab for API calls, and Lighthouse for performance audits.
  • Git and GitHub: Version control and portfolio hosting. If you do not have a GitHub account, create one today.
  • Figma: Frontend developers who can read and extract values from Figma design files are significantly easier to hire. Most companies design in Figma. You do not need to be a designer. You need to understand how to translate a design file into CSS.
  • Storybook: Component documentation and isolated development. Used by professional frontend teams to develop and test UI components independently from the application.

How AI Is Changing Frontend Development for Beginners

Changing Frontend

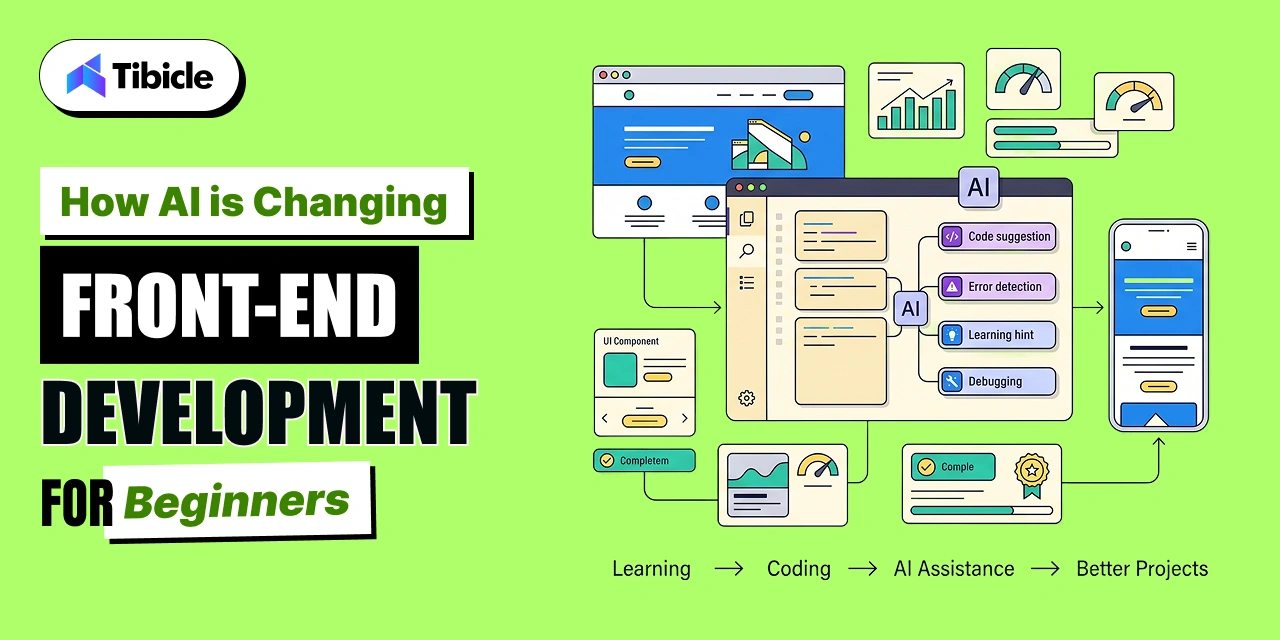
GitHub Copilot, Cursor, and Claude are now part of how many junior frontend developers write code. The 2025 Stack Overflow Survey found 84% of developers use or plan to use AI tools in their workflow.

For beginners, the risk is using AI to bypass the understanding phase. A beginner who uses Copilot to complete their Phase 3 projects without reading and understanding the generated code will arrive at Phase 4 with a gap in JavaScript fundamentals that slows every subsequent step. Use AI tools to check your work and understand alternatives, not to write the code for you during the learning phase.

The frontend development skill that AI has not replaced, and will not replace in the near term, is debugging. Debugging requires understanding what the code is supposed to do, reading error messages fluently, and forming a mental model of program state. Those skills only develop through practice. Write your own code during the learning phase. Use AI to learn from your mistakes after you have written them.

Why Tibicle Is the Right Partner for Frontend Development Projects

Learning frontend development is one path. Hiring a team that already has the stack mastered is another. For businesses that need production-grade frontend work delivered now, Tibicle’s frontend engineering capability covers React, Angular, Next.js, and Vite  the exact tooling this roadmap identifies as the 2026 standard.

Their senior Angular and React developers have shipped web applications across edtech, healthcare, e-commerce, and enterprise SaaS. Tibicle’s UI/UX team works directly with frontend engineers, which means the gap between Figma design file and production component  the gap that trips up most mid-level frontend developers — is handled inside a single team rather than across two separate vendors.

Clients working with Tibicle on frontend projects report consistent outcomes: high-quality designs delivered ahead of schedule, clear communication, and fast adaptation to feedback. One client noted that Tibicle’s delivered designs enabled a seamless transition directly into development without rework. That handoff quality reflects a team that understands both the design system and the component architecture it needs to produce.

Conclusion

Frontend development in 2026 has a clear learning path: HTML to CSS to JavaScript to React. The order matters, the timeline is predictable, and the tools are well-established. Beginners who follow this sequence and build real projects at each phase reach job-readiness in under a year.

For businesses that need frontend development expertise now rather than 8-10 months from now, Tibicle’s frontend engineering team delivers React, Angular, and Next.js applications across the full project lifecycle. Get in touch to discuss your project requirements and engagement options.

Frequently Asked Questions

What should a complete beginner learn first in frontend development?
Start with HTML, specifically semantic HTML. It takes two to three weeks to reach working proficiency. It is the fastest of the three foundational technologies to learn, and it makes the subsequent CSS and JavaScript phases significantly easier because you already understand how browsers structure documents.

Is React still worth learning in 2026?
Yes. React holds 44.7% adoption among professional developers per the Stack Overflow Developer Survey 2025, has the most job postings of any frontend framework, and the most mature ecosystem. Vue and Svelte are worth exploring after React proficiency, but React is the correct first framework for a frontend development beginner optimizing for employability.

How long does it take to learn frontend development?
At 2-3 hours of daily practice, most learners reach job-readiness in 8-10 months following the four-phase roadmap above. This assumes building real projects at each phase rather than only watching tutorials. The learners who take 18-24 months are almost always spending more time consuming content than building things.

Do I need to learn TypeScript as a frontend developer?
TypeScript is not required to get a frontend development job, but it significantly improves your candidacy. TypeScript has reached 44% developer adoption and is standard at most companies building production React applications. Learn it in Phase 4 after you are comfortable with JavaScript and React. Adding TypeScript before those fundamentals are solid adds friction without payoff.

What is the difference between frontend and full stack development?
Frontend development focuses on what users see and interact with: HTML, CSS, JavaScript, and frameworks like React. Full stack development adds backend skills: server-side languages, databases, APIs, and deployment infrastructure. Most frontend developer roles in 2026 expect some familiarity with APIs and version control, but dedicated full stack skills are a separate learning track that typically requires another 6-12 months of study after frontend proficiency is established.