0%

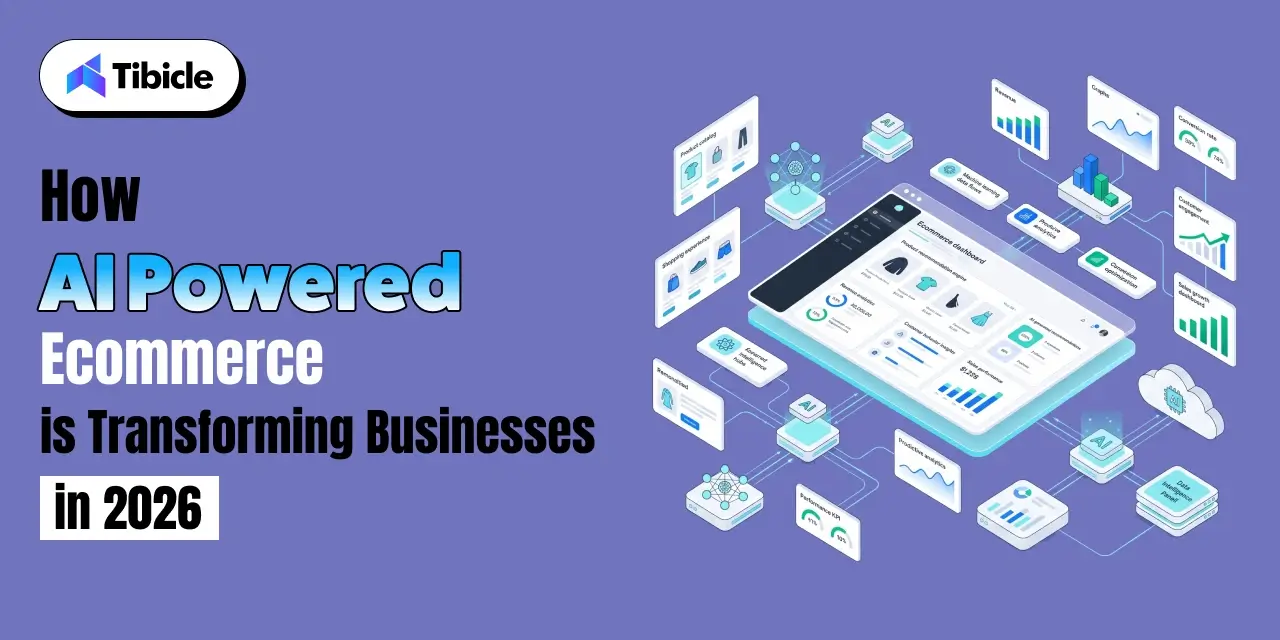
How AI Powered Ecommerce is Transforming Businesses in 2026

Introduction

The ai powered ecommerce market crossed $10.5 billion in 2026 and 84% of ecommerce businesses now rank AI as their top strategic priority. That is not a pilot-stage statistic. It reflects a market that has moved from experimentation to operational infrastructure, where AI sits inside search, pricing, logistics, and customer support stacks across companies of every size.

ai powered ecommerce

For C-suite leaders, the question is no longer whether to adopt ai in ecommerce. Most competitors already have. The real question is where to invest first, which capabilities deliver measurable returns, and what it actually costs to build or buy the right solution.

This guide breaks down the core use cases, ROI benchmarks, pricing models, risks, and vendor selection criteria that matter for decision-makers evaluating ai powered ecommerce in 2026.
What Is AI Powered Ecommerce? A Quick Breakdown

ai powered ecommerce

AI powered ecommerce is the integration of machine learning, natural language processing, computer vision, and generative AI into the systems that run online retail. The goal is not automation for its own sake. Each layer serves a specific commercial function increasing revenue, reducing operational cost, or improving customer experience at scale.

Artificial intelligence ecommerce is now built into platforms most retailers already use, from product discovery to post-purchase logistics. The shift from rule-based to AI-driven operations is the defining infrastructure change of 2026. For a broader look at how this connects to retail tech strategy, see our guide on custom eCommerce development for retail businesses.

Core Technologies Behind AI Ecommerce Solutions

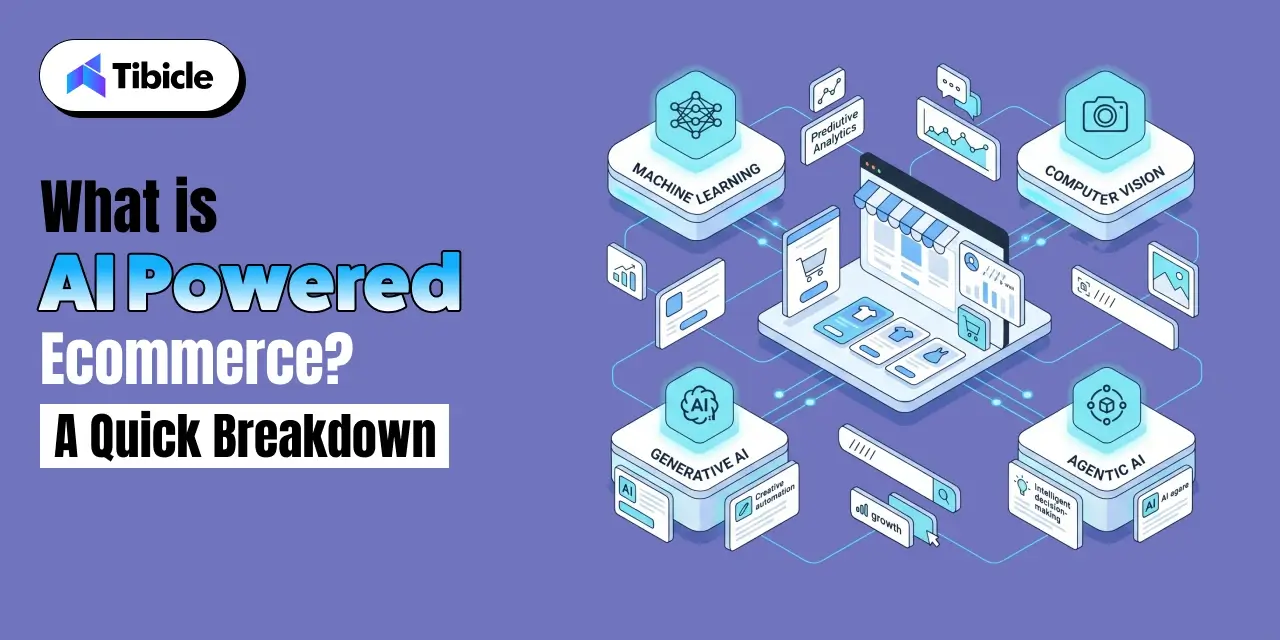
These are the five technology layers that power modern ai ecommerce solutions and what each one does in a retail environment:

  • Machine Learning (ML): Processes transaction and behavioral data to generate product recommendations, predict churn, and optimize pricing in real time.
  • Natural Language Processing (NLP): Powers intent-aware search, conversational chatbots, and review analysis that surface buying signals from unstructured text.
  • Computer Vision: Enables visual search and product tagging shoppers upload images to find matching items without typing a keyword.
  • Generative AI: Produces dynamic product descriptions, personalized email copy, and on-demand visual assets at scale.
  • Agentic Commerce: Executes multi-step tasks autonomously, reordering inventory, adjusting bids, or escalating support tickets without human intervention at each step.

6 High-Impact Use Cases of AI Powered Ecommerce

ai powered ecommerce

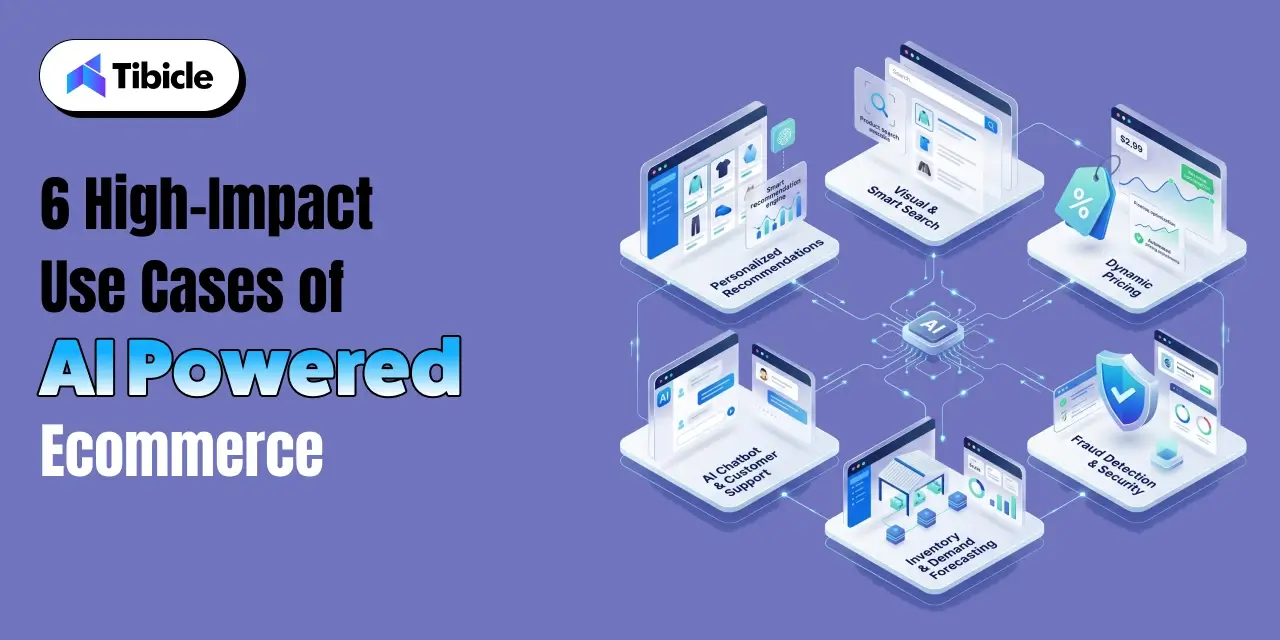
The return on ai powered ecommerce investment concentrates in a small number of high-leverage areas. These six use cases account for the majority of measurable business impact reported by retailers in 2025 and 2026.

Hyper-Personalized Product Recommendations

AI-driven personalized product recommendations contribute between 25% and 35% of total ecommerce revenue for retailers who have fully implemented them. The mechanism is direct: when a shopper sees products matched to their behavior, purchase history, and real-time session data, average order value increases and the likelihood of repeat purchase rises.

The customer lifetime value impact compounds over time. Recommendation engines do not just increase the current order they shape return visit behavior. Retailers running ML-driven recommendation stacks report meaningful gains in both AOV and 90-day retention rates compared to rule-based or manual merchandising approaches.

Intent-Aware Search and Product Discovery

Keyword-based site search is being replaced by semantic search that reads shopper intent rather than matching strings. A shopper searching for “something to wear to a beach wedding” now receives contextually relevant results rather than a literal keyword match.

Visual search has scaled faster than most retailers expected. Google Lens processed over 20 billion searches per month in 2025. Retailers with visual search capabilities capture high-intent shoppers who know what they want but cannot describe it in text a segment that converts at above-average rates once friction is removed.

Dynamic Pricing and Margin Optimization

Fewer than 15% of retailers currently use AI-driven dynamic pricing ecommerce tools, yet those that do report margin gains of 5% to 10%. The gap represents a competitive opportunity that is closing as pricing AI becomes more accessible through SaaS platforms.

Dynamic pricing tools ingest competitor prices, demand signals, inventory levels, and time-based patterns to adjust prices in real time. The result is better margin capture during high-demand windows and reduced excess inventory through price-driven clearance without manual merchandiser intervention.

AI-Driven Customer Support and Conversational Commerce

64% of consumers plan to use AI chatbots ecommerce tools for shopping assistance by 2026. More immediately, AI systems already handle 70% of initial customer interactions for retailers who have deployed conversational commerce tools.

The operational impact is measurable on two lines: support cost reduction through deflection of tier-1 queries, and revenue contribution through guided selling. Chatbots that surface product recommendations during support conversations consistently increase order attach rates versus static FAQ systems. See how this connects to broader customer experience automation strategies.

Predictive Inventory and Supply Chain Management

AI reduces excess inventory holdings by up to 20% and cuts supply chain costs by up to 10% for retailers with sufficient historical data to train demand forecasting models. The mechanism is demand signal aggregation combining sales history, weather data, promotional calendars, and supplier lead times into a single forecast.

Predictive analytics retail applications in supply chain directly reduce the two largest inventory costs: overstock write-downs and stockout-driven lost sales. Both have measurable impact on gross margin, making supply chain AI one of the highest-ROI deployment areas in ecommerce automation.

Fraud Detection and Payment Intelligence

AI fraud detection analyzes transaction patterns in real time device fingerprint, behavioral biometrics, purchase velocity, and network signals to flag suspicious transactions before authorization. The speed advantage over rule-based systems is decisive: AI systems evaluate hundreds of signals per transaction in milliseconds.

The commercial outcome is reduced chargebacks, lower false-positive rates that would otherwise block legitimate orders, and reduced manual review costs. Payment intelligence systems also identify friendly fraud patterns that standard chargeback rules miss, protecting margin in high-volume categories.

AI Powered Ecommerce ROI: What the Numbers Say

ai powered ecommerce

ROI data for ai powered ecommerce now comes from large enough sample sizes to be reliable benchmarks, not anecdotal case studies. The figures below reflect multi-retailer studies and are directional validate against your own baseline before building a business case.

Revenue and Conversion Metrics

69% of retailers report measurable revenue lift from AI deployment. AI-referred shoppers convert at a rate 31% higher than organic traffic across comparable segments. AI personalization drives up to 40% revenue increase versus competitors who rely on manual merchandising or rules-based recommendation engines.

The conversion rate optimization ai effect is most pronounced in three areas: search-to-cart rates, recommendation click-through, and post-add-to-cart completion. Retailers who personalize all three stages see compounding improvement rather than isolated gains. For benchmarks specific to your category, see our ecommerce performance metrics guide.

Cost Reduction and Operational Efficiency

72% of AI-adopting retailers report cost reductions following deployment. Logistics savings range from 5% to 20% depending on network complexity and model maturity. Inventory reductions of up to 35% have been reported in categories with stable SKU structures and clean historical data.

Customer support cost reduction is the fastest-payback deployment area for most mid-market retailers. Deflecting 50% of tier-1 queries to AI without customer satisfaction loss directly reduces headcount requirements and seasonal support scaling costs.

ROI Timeline Expectations

Organizations earn an average of $1.41 for every $1 spent on AI, according to Snowflake’s 2025 industry study. Most organizations achieve satisfactory ROI within 2 to 4 years of deployment. Only 6% report ROI in under 12 months.

The variables that compress timeline most are: data readiness, deployment scope, and internal capability to act on AI outputs. For C-level planning purposes, model a 2-year break-even and treat anything faster as upside.

Pricing Models for AI Ecommerce Solutions

Pricing for ai ecommerce solutions varies significantly based on deployment model, integration complexity, and the level of customization required. The following frameworks apply to mid-market and enterprise buyers evaluating investments in 2026.
SaaS Subscription vs. Custom Development

SaaS platforms like Shopify’s AI features or BigCommerce’s integrated tools operate on monthly subscription models. Deployment is faster weeks rather than months and requires less internal technical resource. The tradeoff is standardization: SaaS AI modules are designed to work for a broad range of merchants, not for the specific business logic of any one retailer.

Custom-built AI tools carry higher upfront investment but deliver alignment with proprietary data structures, pricing rules, and operational workflows that SaaS modules cannot accommodate. For retailers with complex catalogs, multi-region operations, or proprietary fulfillment systems, custom development often produces better long-term unit economics despite the higher entry cost. Our guide on custom vs. off-the-shelf software for ecommerce covers this tradeoff in detail.

Cost Variables That Affect Total Investment

Four variables determine total AI investment beyond the quoted platform or development cost:

  • Data infrastructure readiness: Disconnected or low-quality data requires cleaning and architecture work before AI models can be trained. This is frequently the largest underestimated cost.
  • Integration complexity: Connecting AI tools to existing ERP, CRM, POS, and CDP systems adds engineering cost proportional to system fragmentation.
  • Team training and change management: AI outputs require human interpretation and action. Upskilling commercial and operations teams is a real cost that affects time-to-value.
  • Ongoing optimization: Models degrade without retraining. Budget for quarterly model review and continuous improvement as part of total cost of ownership.

Ballpark ranges for mid-market implementations run from $50,000 to $250,000 in year one, depending on scope. Enterprise builds with custom model development and multi-system integration typically begin at $300,000 and scale with complexity.

AI Powered Ecommerce Platform Comparison

Three deployment approaches cover most buyer profiles evaluating ai powered ecommerce in 2026.
FeatureSaaS Platforms (Shopify, BigCommerce)Custom AI SolutionsHybrid Approach
Deployment SpeedFastSlowMedium
CustomizationLimitedFullModerate
Cost (Year 1)Low to MidHighMid to High
ScalabilityPlatform-dependentHighHigh
Data OwnershipSharedFullFull
Best ForSMBs, fast launchesEnterprise, niche needsMid-market scaling

SaaS platforms are the right starting point for SMBs and retailers running standard catalog structures who need AI capabilities without a large internal engineering team. They offer the fastest path to value in personalization and search.

Custom AI solutions suit enterprise buyers with complex product catalogs, proprietary data advantages, or operational requirements that no off-the-shelf tool supports. The higher year-one cost is offset by full data ownership and the ability to build competitive moats from proprietary AI behavior.

Hybrid approaches where a SaaS platform handles standard functions and custom AI handles differentiated use cases are the most common architecture for mid-market retailers scaling beyond what platforms offer without committing to full custom builds.

Key Risks and Challenges of AI in Ecommerce

Ecommerce Implementation

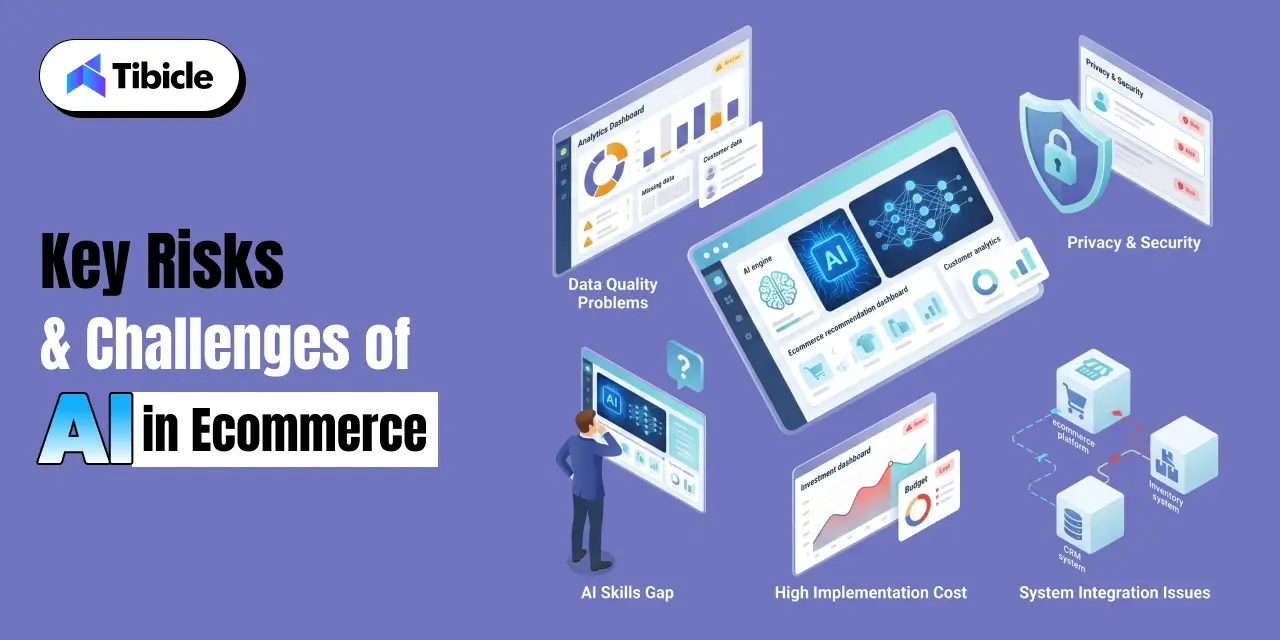
89% of retailers are currently using or testing AI in ecommerce. Only 33% have fully implemented it. The gap is not strategic hesitation it is operational. The risks below are the most common blockers between pilot and production.

Data Quality and Integration Gaps

AI models perform in direct proportion to data quality. Fragmented data across legacy systems, inconsistent SKU structures, and incomplete customer records are the primary reason AI pilots fail to scale. Before evaluating vendors, audit data completeness across transaction history, product catalog, and customer identity resolution.

Integration gaps between AI tools and existing infrastructure, particularly between recommendation engines and inventory systems, create scenarios where AI surfaces out-of-stock products or mispriced items. These are customer experience failures with direct revenue impact. Our ecommerce data architecture guide covers the audit process in detail.

Consumer Trust and AI Transparency

Only 14% of consumers currently trust AI to make purchasing decisions autonomously on their behalf. This is a meaningful constraint on how far agentic commerce can advance in the near term. AI that surfaces recommendations or personalizes content is accepted. AI that takes action without explicit customer approval faces adoption resistance.

Privacy compliance adds a regulatory layer. GDPR in Europe and a growing body of US state-level privacy law govern how customer behavioral data can be collected, stored, and used for AI training. Any ai ecommerce solution that processes EU or California resident data requires explicit compliance architecture, not a checkbox.

Talent and Change Management

Internal skill gaps are the most consistent challenge reported by retailers who have deployed AI. The problem is not just technical it is organizational. AI outputs require commercial judgment to act on. A demand forecasting model that flags overstock requires a buyer who understands how to respond. A pricing AI that recommends a margin increase requires a category manager who trusts the signal.

Cross-functional AI literacy at the executive level is the change management priority that correlates most strongly with successful AI deployment.

Vendor Selection Checklist for AI Powered Ecommerce

Use this checklist before issuing an RFP or entering vendor conversations. It identifies the questions that separate vendors with real deployment capability from those with strong sales materials.

  1. Pre-built vs. custom build: Does the vendor offer pre-built ecommerce AI modules, or does every capability require a full custom build from scratch?
  2. Data integration depth: What integration capabilities exist across CRM, ERP, CDP, and POS and which connections are native versus requiring custom middleware?
  3. Implementation timeline: What is the average timeline for businesses at your revenue scale and catalog complexity?
  4. Scalability: Can the solution scale across multiple geographies, currencies, and product catalog structures without re-implementation?
  5. ROI benchmarks: What performance data does the vendor provide from deployments comparable to your business in size, category, and data maturity?
  6. Ongoing support: What is included post-launch model retraining cadence, optimization review, and SLA for performance degradation?
  7. Data privacy compliance: How does the vendor handle GDPR and US state-level regulations, and who owns the data used to train models?

Add one question specific to your vertical the answer will separate vendors who understand your category from those pitching a generic platform.

Top AI Ecommerce Tools and Platforms in 2026

The following categories represent the primary tool types buyers evaluate when building an ai powered ecommerce stack. This is a starting point for research, not a ranked review.

  • Personalization Engines: Dynamic Yield, Bloomreach, Nosto ML-driven recommendation and content personalization platforms with strong ecommerce track records.
  • Conversational AI: Gorgias, Tidio, Intercom chatbot and live-chat tools with ecommerce integrations for cart recovery, product guidance, and post-purchase support.
  • Dynamic Pricing Tools: Prisync, Wiser, BlackCurve competitive price monitoring and AI pricing recommendation tools for mid-market and enterprise retail.
  • Visual Search and Discovery: Google Vision API, Syte, Visenze image recognition and visual search infrastructure connecting shopper-uploaded images to product catalog matches.
  • All-in-One Commerce Platforms with AI Built In: Shopify, BigCommerce, Salesforce Commerce Cloud platforms that integrate AI across search, recommendations, and fulfillment within a single managed environment.

Evaluate each category against your highest-priority use case first. Deploying across all categories simultaneously without sequencing increases implementation risk without accelerating ROI.

Why Tibicle Is a Strong Choice for AI Powered Ecommerce Implementation

Ecommerce Implementation

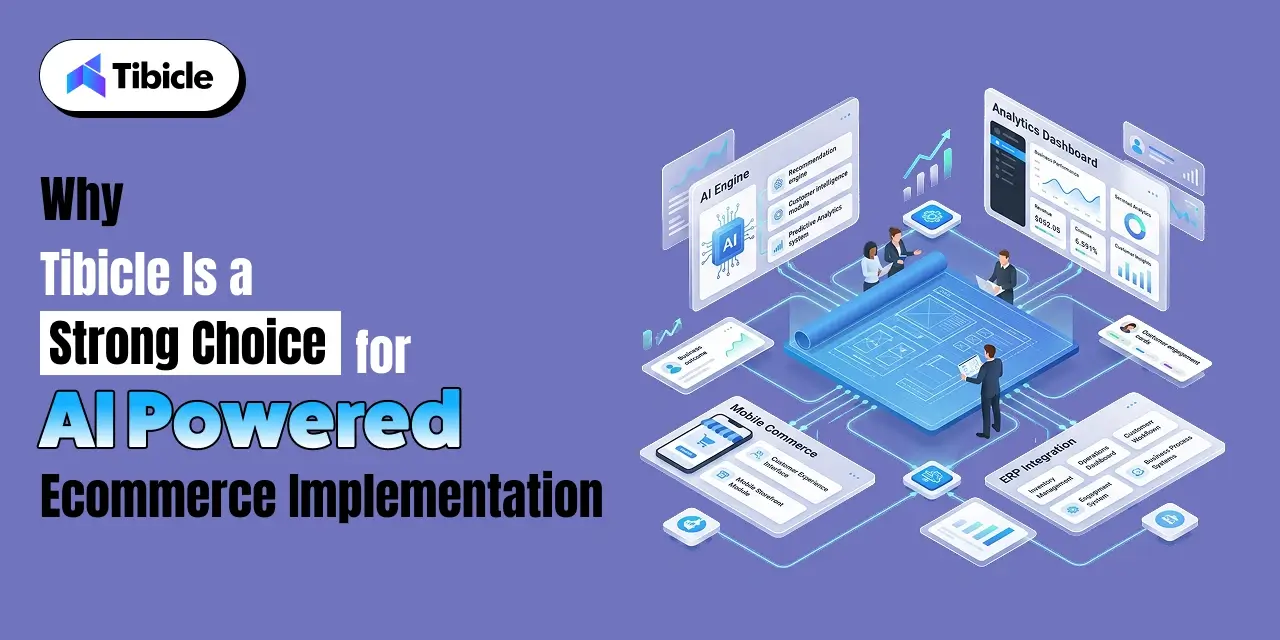
Tibicle builds custom AI ecommerce solutions for mid-market and enterprise clients where standard SaaS platforms reach their ceiling. If the vendor checklist above surfaces gaps in pre-built options catalog complexity, integration depth, or data ownership requirements custom development is the correct path.

Tibicle’s delivery model covers the four areas that determine implementation success: custom AI solution development tied to specific business logic, ecommerce platform integration across CRM, ERP, POS, and CDP systems, data architecture designed for scalability across markets and SKU volumes, and a proven engagement model for clients who need AI to fit their operation rather than adapting their operation to fit a platform.

Retailers evaluating ai ecommerce solutions for 2026 implementation can start with a scoping consultation with Tibicle to identify which use cases match your data maturity and where custom development delivers the best return.
Conclusion

The strategic decision for 2026 is not whether to invest in ai powered ecommerce 84% of competitors are already moving. The decision is where to start and who builds it. Retailers who sequence deployment around their highest-ROI use case, with data architecture in place, reach the $1.41-per-dollar return faster than those who run broad platform experiments without prioritization.

The 69% revenue lift benchmark and 31% conversion improvement are achievable for businesses that match deployment scope to data maturity. The gap between piloting AI and running it as operational infrastructure is closed by the right implementation partner.

Contact Tibicle today to map your AI ecommerce roadmap and identify the highest-return starting point for your business.

Frequently Asked Questions

What is AI powered ecommerce and how does it work?
AI powered ecommerce is the use of machine learning, NLP, computer vision, and generative AI to automate and personalize online retail operations. It works by processing large volumes of behavioral, transactional, and operational data to generate outputs product recommendations, dynamic prices, demand forecasts, chatbot responses that improve revenue, reduce cost, or improve customer experience faster than manual or rules-based systems can.

How much does it cost to implement AI in an ecommerce business?
Cost depends on deployment model and scope. SaaS AI tools built into platforms like Shopify or BigCommerce are available within standard subscription tiers or as low-cost add-ons. Point solutions for personalization or search run $500 to $5,000 per month depending on traffic volume. Custom AI development for mid-market retailers typically starts at $50,000 to $250,000 in year one, with enterprise implementations beginning at $300,000 and scaling with integration complexity and catalog size.

What ROI can businesses expect from AI powered ecommerce in 2026?
The average return is $1.41 for every $1 spent on AI, based on Snowflake’s 2025 industry data. 69% of retailers report measurable revenue lift, and AI-personalized shoppers convert at 31% higher rates than non-personalized traffic. Most organizations reach satisfactory ROI within 2 to 4 years. Faster timelines correlate with data readiness and deployment scope.

What are the biggest risks of using AI in ecommerce?
The three primary risks are data quality gaps that cause AI models to underperform or surface incorrect outputs, consumer trust constraints that limit how far autonomous AI purchasing can advance, and internal talent gaps that prevent teams from acting on AI-generated insights. Privacy compliance particularly GDPR and US state-level data regulations is a regulatory risk that must be addressed in the architecture, not retrofitted after deployment.

How do I choose the right AI ecommerce vendor for my business?
Start with the vendor selection checklist above. Prioritize vendors with documented deployments at comparable business scale, native integration capabilities for your existing tech stack, and clear data ownership terms. Verify ROI benchmarks against businesses in your category and revenue range, not general market averages. For complex catalogs or proprietary operational requirements, evaluate custom development against SaaS options before defaulting to whichever platform has the strongest marketing presence.

What Is a Progressive Web App? Beginner’s Guide

Introduction

The global progressive web app market was valued at USD 3.53 billion in 2024 and is projected to hit USD 21.44 billion by 2033, growing at a 18.98% CAGR. Straits Research Yet most businesses still split their budgets across separate iOS and Android builds two codebases, two maintenance cycles, two app store approval processes when a single progressive web app can serve both platforms from one deployment.

progressive web app

This guide covers what a progressive web app is, how it works, real cost and ROI data, a full comparison with native apps, known risks, and a vendor selection checklist for 2026.

What Is a Progressive Web App?

Core Definition

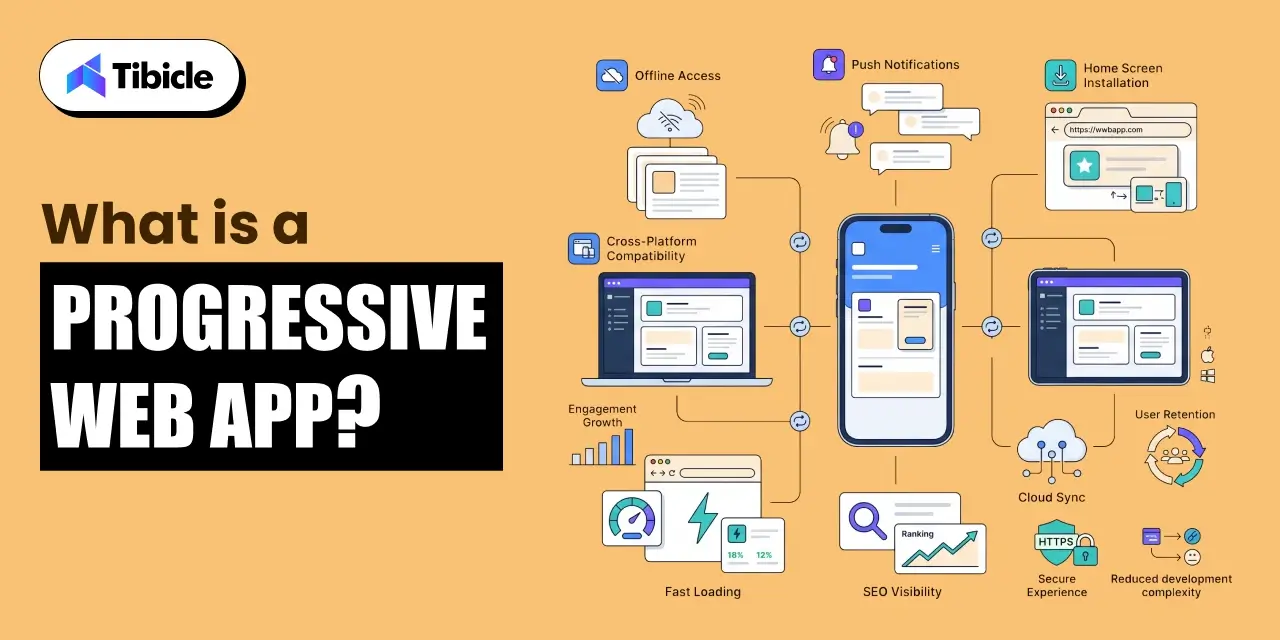
A progressive web app is a browser-based application built with HTML, CSS, and JavaScript that behaves like a native mobile app. It can be installed on a user’s home screen, works offline, and sends push notifications without requiring distribution through the Apple App Store or Google Play.

PWAs show a 70% increase in session length and a 20% increase in page views per session compared to traditional web apps. ResearchGate, cited by Straits Research The architecture behind this performance is what separates a progressive web app from a standard website.

How Does a Progressive Web App Work?

progressive web app

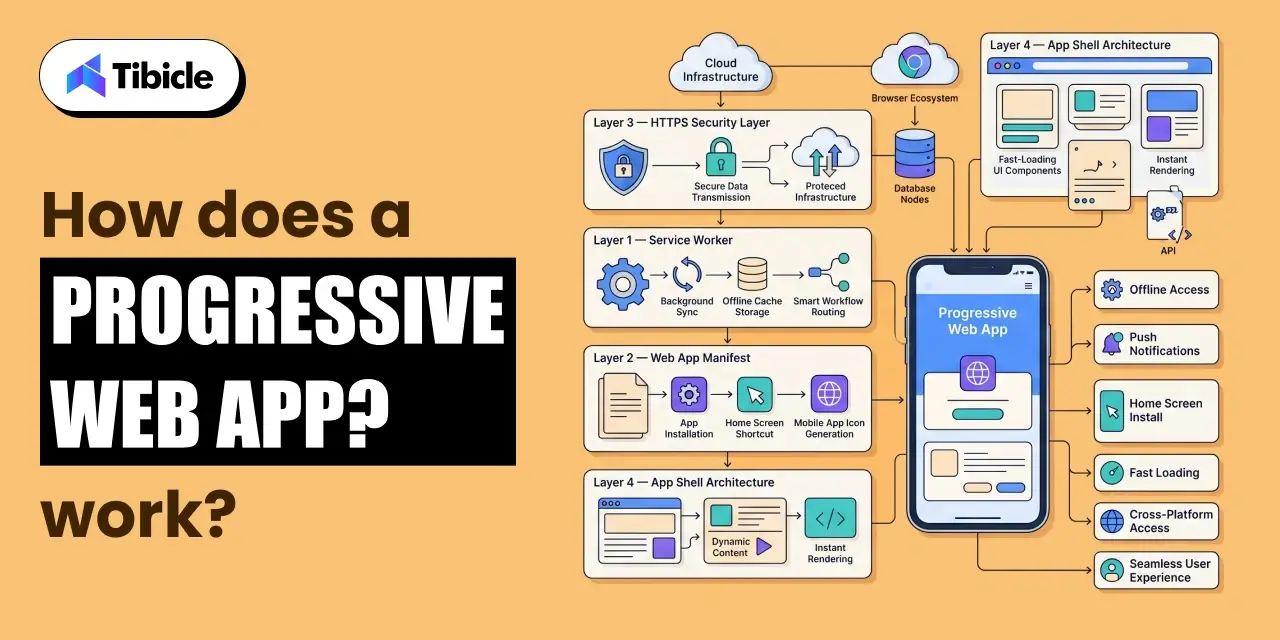
A progressive web app is built on four technical components working together. Each layer handles a specific function, and together they produce the app-like experience users expect on mobile.

What Are Service Workers?

Service workers are background scripts that run separately from the main browser thread. They manage PWA caching, handle offline access, and enable background sync. When a user opens a progressive web app without internet access, the service worker serves cached content instead of showing an error, this is what makes an offline web app possible.

What Is a Web App Manifest?

The web app manifest is a JSON configuration file that defines the app’s name, icon, theme color, and display behavior. It tells the browser how to present the installable web app, whether in full-screen, standalone, or browser mode. This file is what enables home screen installation without an app store.

Why Does HTTPS Matter for a PWA?

HTTPS is mandatory for a progressive web app. All data transmitted between the browser and server must be encrypted. This is not optional browsers block service worker registration on non-secure origins. It also establishes the trust baseline that search engines and users expect.

What Is App Shell Architecture?

App shell architecture loads a minimal set of HTML, CSS, and JavaScript on the first request, just enough to render the UI instantly. Content is then loaded dynamically as the user interacts. This approach cuts perceived load time and improves Core Web Vitals scores, both of which affect search rankings.

PWA Component Overview

PWA ComponentFunctionBusiness Impact
Service WorkerCaching, offline access, background syncKeeps app functional without internet
Web App ManifestDefines name, icon, display modeEnables home screen installation
HTTPS LayerEncrypts all data in transitSecurity compliance, browser trust
App Shell ArchitectureMinimal UI load, dynamic contentFaster perceived load, better Core Web Vitals

Why Businesses Are Adopting Progressive Web Apps in 2026

progressive web app

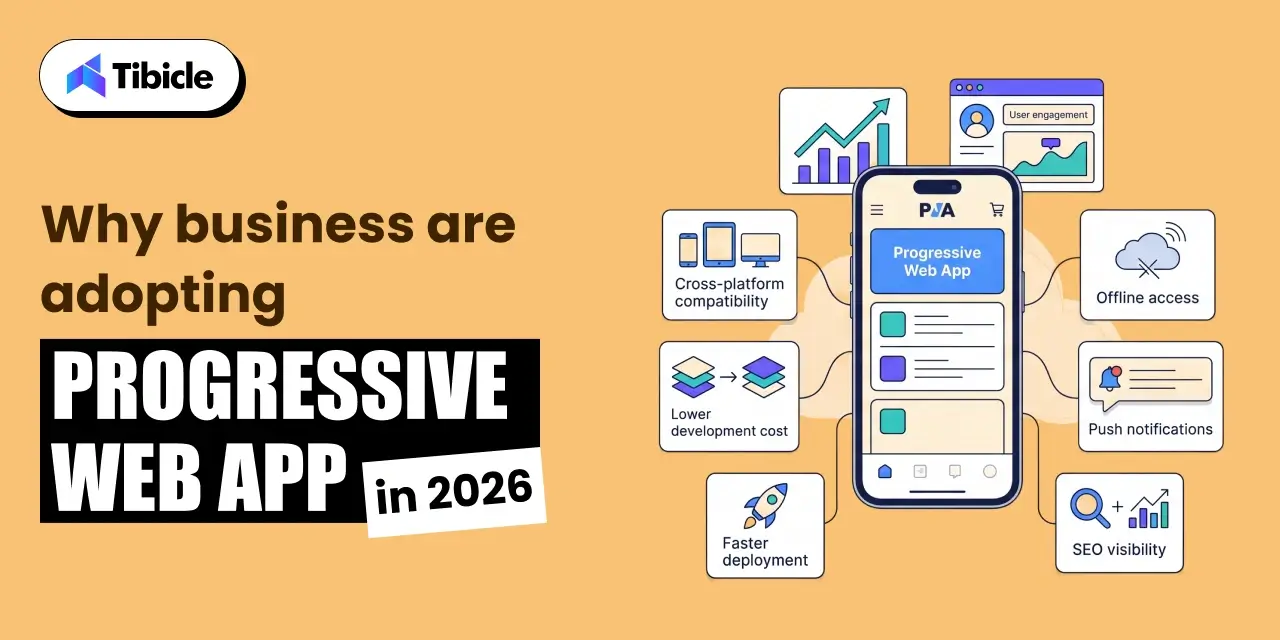
Cost Reduction with a Single Codebase

PWA development costs 30%-75% less than building separate native apps. Glance Research, cited by Newly The average PWA development project runs $8,000–$25,000, compared to $50,000–$150,000+ for dual native builds across iOS and Android. For early-stage businesses and mid-market companies, that gap often determines whether a product launches on schedule or gets delayed by 12 months.

A single codebase app also reduces ongoing maintenance overhead. One update deploys across all platforms simultaneously, no separate release cycles, no app store approval queues.

Higher User Engagement and Retention

The business case for progressive web app development is backed by documented results across industries:

  • Pinterest saw a 60% increase in engagement after launching its PWA.
  • Twitter Lite reported a 65% increase in pages per session and a 75% increase in tweets sent.
  • Starbucks doubled its daily active users after deploying a PWA that was 99.84% smaller than its iOS app.

These are not edge cases. They reflect what happens when load time drops, offline access is restored, and the friction of app store downloads is removed.

SEO and Discoverability Advantage

A progressive web app is fully indexable by search engines. Native apps are not as they sit behind app store walls that Google’s crawler cannot access. For businesses where organic search drives acquisition, this distinction matters. PWA development gives you a cross-platform app that also functions as a discoverable web property.

Progressive Web App Use Cases by Industry

E-commerce and Retail

E-commerce holds 31.4% of the PWA market share in 2025. Coherent Market Insights Faster load times, offline browsing, and push notifications for cart recovery make PWAs well-suited for retail. Reducing page load time by one second can lift conversions by up to 7%, a metric that compounds across high-traffic stores.

Media and Content Publishing

Forbes deployed a progressive web app and reported significant improvements in session depth and ad revenue per user. Media publishers benefit from offline reading mode and fast article load times, both of which reduce bounce rate and increase time-on-page, two signals that affect ranking.

Travel and Hospitality

Travel companies using PWAs have reported a 3x conversion rate increase and 180% retention improvement. Clutch.co Offline itinerary access and fast booking flows are the primary drivers. Users in airports or low-connectivity areas can complete bookings without the experience breaking.

B2B SaaS and Enterprise Tools

Enterprise teams use PWAs for offline dashboards, real-time sync across devices, and field sales tools that function without a stable internet connection. The cross-platform app model means a sales rep on Android and a manager on iOS both use the same product, updated at the same time.

Progressive Web App vs Native App: Full Comparison

progressive web app

Feature and Cost Breakdown

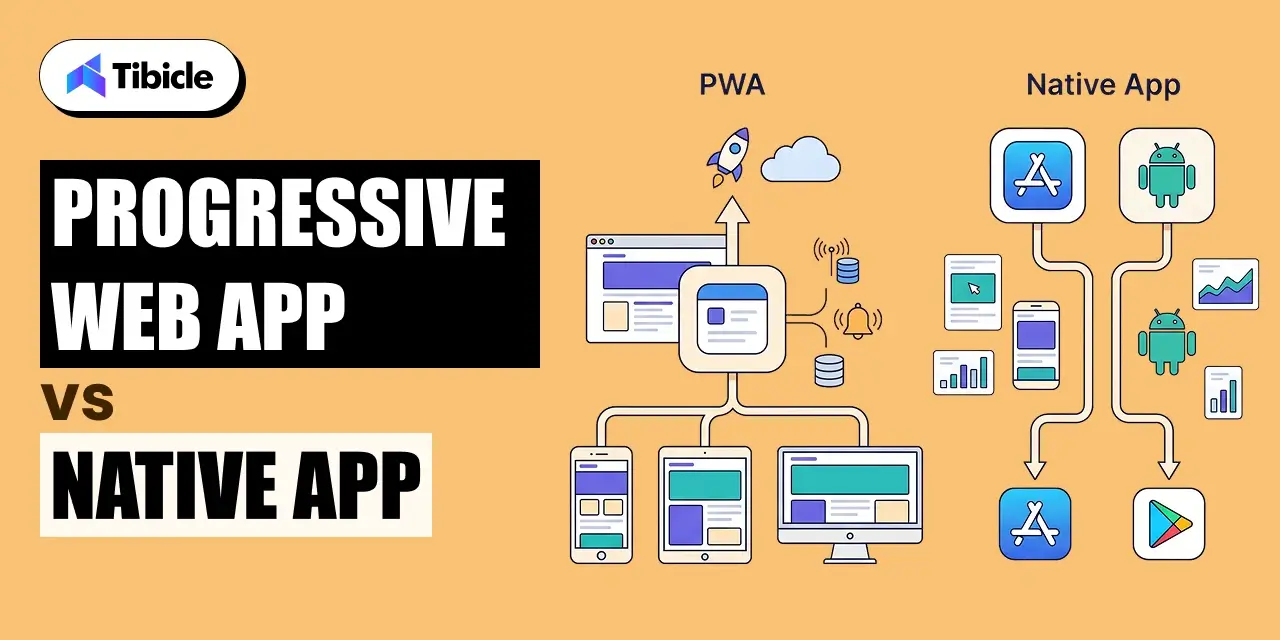
ParameterProgressive Web AppNative App
Development Cost$8K–$25K (single codebase)$50K–$150K+ (per platform)
Time to Market4–8 weeks12–24 weeks
MaintenanceSingle update, instant deploySeparate updates per OS, store approval
Offline SupportPartial (service worker caching)Full
Device AccessLimited (camera, GPS, push)Full hardware access
App Store PresenceOptionalRequired
SEO VisibilityFully indexableNot indexable
Performance GapUnder 10% for standard business apps [Brainhub 2025]Superior for graphics-heavy apps

When to Choose a Progressive Web App

Choose a progressive web app when your product serves a broad cross-platform audience, organic search is part of your acquisition strategy, budget or timeline is a constraint, or your core features do not require deep hardware access. E-commerce, SaaS dashboards, content platforms, and service-based businesses typically fit this profile.

When Native Still Wins

Native development remains the right call for applications that require Bluetooth, NFC, AR, or advanced camera control. Gaming apps, financial apps with biometric authentication, and augmented reality tools hit the performance ceiling of what a browser-based app can currently deliver. For those use cases, a native build or React Native hybrid is the stronger choice.

Progressive Web App Development Cost Breakdown

Development

Cost by Complexity Tier

PWA development cost scales with scope. Three tiers cover most business use cases:

  • Basic PWA: $8,000–$12,000. Covers simple informational apps, content sites, or lead-gen tools with standard PWA features.
  • Mid-range PWA: $15,000–$25,000. Covers e-commerce stores, SaaS dashboards, and tools with third-party integrations.
  • Enterprise PWA: $30,000–$60,000. Covers complex API integrations, custom backend architecture, and high-traffic production environments.

Cost Variables

Four factors move the number up or down within each tier:

  • UI/UX design complexity: custom design systems cost more than component libraries.
  • Third-party integrations: payment gateways, CRMs, ERPs, and analytics tools add scope.
  • Backend complexity: real-time sync, custom APIs, and data processing add development hours.
  • Developer location: North America and Western Europe carry higher rates; Asia and Latin America typically run 40–60% lower for equivalent output.

Maintenance and Ongoing Costs

A progressive web app has no app store fees and no platform-specific approval delays. Updates deploy instantly to all users. Long-term, this lowers total cost of ownership compared to maintaining two native codebases with staggered release cycles.

ROI of a Progressive Web App: What the Data Shows

Revenue Impact Model

A straightforward ROI model: a business generating $100,000 in monthly mobile revenue at a 2% conversion rate sees a 40% improvement post-PWA launch. That produces $480,000 in additional annual revenue on a $50,000 build cost an 860% first-year ROI. Codebrand The model assumes no increase in traffic, only conversion rate improvement from faster load times and offline access.

Conversion and Engagement Metrics

  • Businesses switching to PWAs report a 36% increase in mobile conversions on average. AppVerticals
  • Starbucks’ PWA is 99.84% smaller than its iOS app and generated 2x daily active users post-launch.
  • Twitter Lite reduced data consumption by 70% while increasing engagement across all measured metrics.

Total Cost of Ownership vs Native

A single codebase app saves up to 60% on development budget over a three-year period. Webshark When you factor in app store fees, separate QA cycles, and platform-specific bug fixes, the savings compound annually.

Looking to build a progressive web app that drives measurable ROI? Tibicle helps businesses plan, develop, and scale PWAs with a conversion-first approach. Talk to our team today.

Risks and Challenges of Progressive Web Apps

iOS Limitations

Safari’s support for PWA features still lags behind Chrome and Edge. Push notification control on iOS is limited, Apple’s implementation of the Web Push standard remains inconsistent across versions. Businesses with a predominantly iPhone user base should test PWA behavior thoroughly on Safari before launch and factor potential workarounds into the development scope.

Limited Hardware Access

A progressive web app cannot access Bluetooth, NFC, or advanced AR capabilities through the browser. Camera and GPS work in most modern browsers, but the depth of hardware integration available to native apps is not currently replicable in a browser-based app. This is a fixed constraint, not a configuration issue.

App Store Discoverability Trade-off

Users conditioned to search the App Store or Google Play may not find your PWA through those channels. While Google Play now supports TWA (Trusted Web Activity) packaging for PWA submission, App Store distribution for PWAs remains limited. Businesses that depend on app store traffic as an acquisition channel should account for this gap.

Performance Ceiling for Complex Use Cases

AR/VR applications, AAA-grade mobile games, and financial apps with heavy cryptographic requirements still favor native architecture. A progressive web app performs within 10% of native for standard business applications, but that gap widens significantly for compute-intensive use cases.

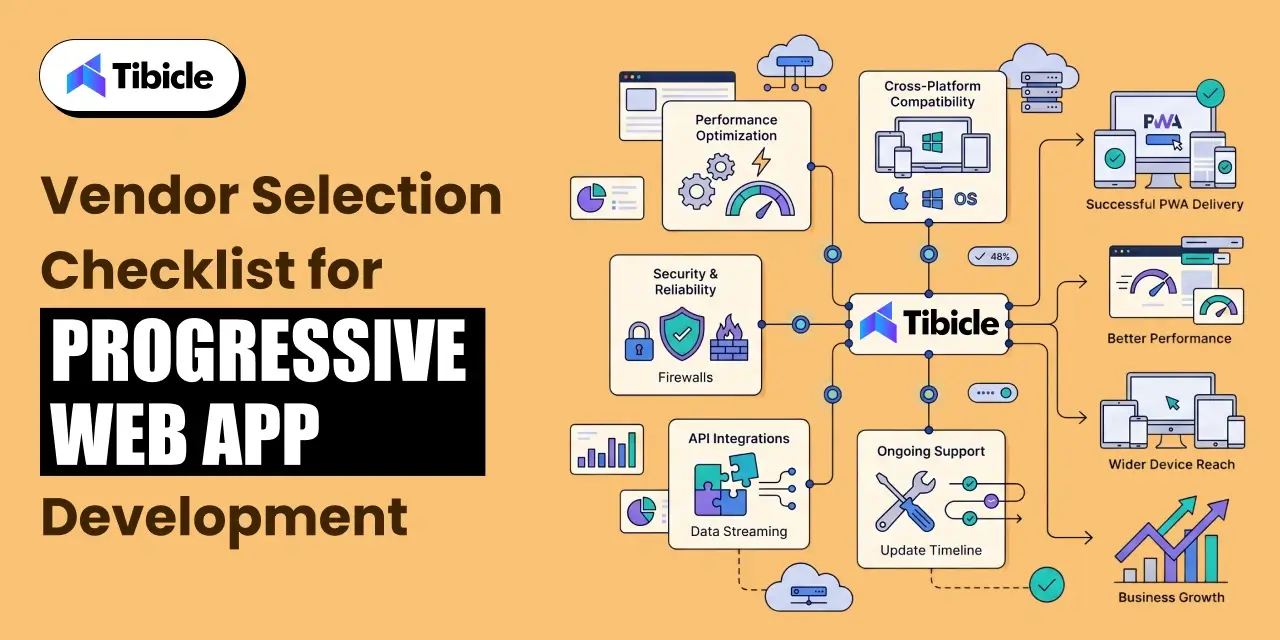
Vendor Selection Checklist for Progressive Web App Development

Development

Use this checklist before signing a contract with any PWA development partner:

  • Does the vendor have documented PWA case studies with measurable outcomes?
  • Do they implement service workers and PWA caching strategies correctly not just add a manifest file?
  • Can they handle both frontend frameworks (React, Next.js, Vue) and backend integrations?
  • Do they offer post-launch performance optimization, including Core Web Vitals monitoring?
  • What is their approach to offline-first architecture and background sync?
  • Do they test across Chrome, Safari, Edge, and Firefox before delivery?
  • Can they integrate push notifications and background sync across Android and iOS?
  • Do they provide Lighthouse audit scores as part of the delivery package?
  • What is their maintenance and support model after go-live?
  • Do they offer PWA-to-app-store publishing via TWA for Google Play?

A vendor who cannot answer the service worker, Lighthouse, and cross-browser questions directly is likely treating PWA as a checkbox feature rather than an architecture decision.

Top Progressive Web App Development Companies in 2026

Major players in PWA development include Google, Microsoft, OutSystems, Alokai, IBM, GoodBarber, Cloud Four, and DockYard. When evaluating any vendor, the selection criteria that matter most are: cross-platform expertise across React and Vue ecosystems, Lighthouse performance scores on delivered projects, depth of client portfolio in your industry, and the clarity of their post-launch support model. Technical skill and communication structure both matter, delivery without documentation is a recurring problem in this space.
Why Tibicle Is a Strong Choice for Progressive Web App Development

Tibicle brings technical depth in React, Next.js, and Node.js to PWA projects, paired with an SEO-first development approach that aligns with how progressive web apps are discovered and ranked. The team focuses on performance optimization from the architecture stage not as a post-launch patch and follows a documented delivery process that includes Lighthouse audits, cross-browser testing, and structured handoffs. For businesses that need PWA development without the overhead of a large agency, Tibicle offers the same technical capability at a more accessible cost tier.

Want to explore how a progressive web app fits your business model? Reach out to Tibicle for a free consultation.

Conclusion

Progressive web apps reduce development cost by 30–75%, increase mobile conversions by up to 36%, and offer a viable alternative to dual native builds for most business applications. For companies that need cross-platform reach without the budget or timeline of separate iOS and Android projects, a PWA delivers on both counts. The risks are iOS limitations, hardware access gaps, app store discoverability are real but manageable with the right vendor and architecture decisions.

Schedule a free PWA assessment with Tibicle to evaluate your use case and projected ROI. Book here.

FAQs

What is a progressive web app and how is it different from a regular website?
A progressive web app is a browser-based application built with standard web technologies HTML, CSS, and JavaScript  that adds native app capabilities on top. A regular website loads fresh content on every page request and cannot function offline. A PWA uses service workers to cache content, allowing it to work without internet access. It can also be installed on a home screen, send push notifications, and load in under two seconds on repeat visits. The gap between a website and a progressive web app is not visual  it is architectural.

How much does it cost to build a progressive web app in 2026?
PWA development cost ranges from $8,000–$12,000 for basic builds, $15,000–$25,000 for mid-range projects like e-commerce or SaaS dashboards, and $30,000–$60,000 for enterprise-grade PWAs with complex integrations. Developer location, UI complexity, and backend requirements are the main cost variables. By comparison, a dual native app build (iOS + Android) typically costs $50,000–$150,000+, making PWA development 30–75% less expensive for most use cases.

Can a progressive web app work offline?
Yes. Offline functionality is one of the core features of a progressive web app. Service workers cache key assets and data on the first load. On subsequent visits without internet access, the app serves cached content instead of showing a connection error. The extent of offline functionality depends on the caching strategy implemented during PWA development  some apps cache full data sets, others cache only the shell and show a limited offline mode.

Is a progressive web app better than a native app for small businesses?
For most small businesses, yes. A progressive web app costs significantly less to build and maintain, launches faster, and reaches users across iOS and Android without separate codebases. It is fully indexable by search engines, which native apps are not. The trade-off is limited hardware access and some iOS feature gaps. If your product does not require Bluetooth, NFC, AR, or advanced camera control, a PWA delivers comparable user experience at a fraction of the cost.

Do progressive web apps work on iPhones and Safari?
Yes, with limitations. Safari supports core PWA features including home screen installation, service workers, and offline caching. Push notification support on iOS improved with iOS 16.4, but remains less consistent than Chrome or Edge on Android. Full-screen mode and some advanced PWA capabilities are still restricted on Safari. If your audience is predominantly iPhone users, test PWA behavior on Safari specifically and confirm your vendor accounts for iOS limitations in the development scope.

How long does it take to develop a progressive web app?
A basic progressive web app takes 4–6 weeks from scope sign-off to delivery. Mid-range PWAs with e-commerce functionality or dashboard integrations typically run 6–10 weeks. Enterprise PWAs with complex APIs and custom backend architecture can take 12–16 weeks. These timelines assume a defined scope, available design assets, and API documentation from third-party services. Delays in content, design feedback, or API access are the most common schedule risks.

What is mCommerce vs eCommerce

Introduction

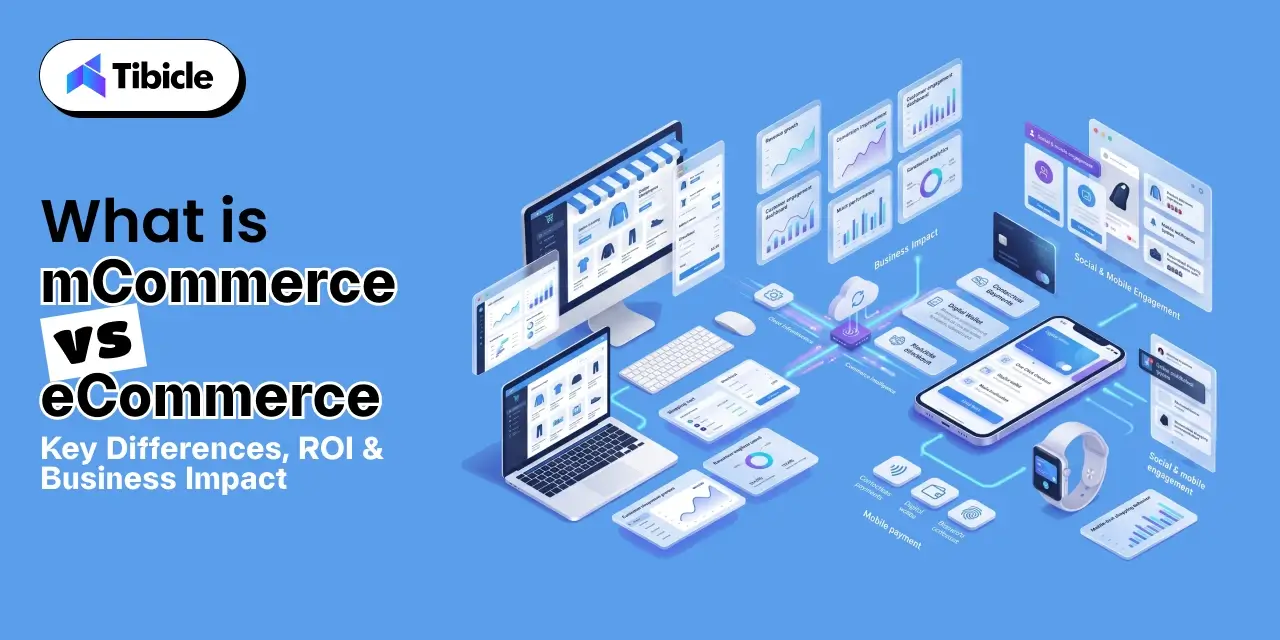
eCommerce covers any commercial transaction online, across desktop and mobile alike. mCommerce is the subset specific to smartphones and tablets, via apps or mobile-optimized sites. Mobile commerce hit $2.51 trillion in 2025, or 60% of global e-commerce sales (Statista, 2025). Understanding mCommerce vs eCommerce this way makes clear why mobile readiness is now essential to any modern strategy. As the two increasingly overlap, the real question for businesses is no longer which one to choose, but how well they work together.

mcommerce vs ecommerce

Yet the question most C-suite leaders are still wrestling with is not whether mobile matters but what separates m-commerce vs. e-commerce at the operational and revenue level, and where exactly budget, development resources, and UX investment should be concentrated.

This is not a beginner’s guide to definitions. Companies investing in digital commerce must make high-stakes decisions about platform architecture, development spend, and customer experience design. Getting the m-commerce vs e-commerce distinction wrong at the strategic layer leads to misallocated budgets, underperforming conversion rates, and competitive disadvantage in a market where mobile-first has already become the default consumer expectation.

This guide will break down the structural, financial, and strategic differences between m-commerce and e-commerce, including ROI benchmarks, cost models, risk factors, and a vendor selection framework, everything a decision-maker needs to act, not just understand.

What Is eCommerce? A Quick Operational Overview

E-commerce, in a business context, refers to the buying and selling of goods and services through internet-connected devices, primarily desktops and laptops. It encompasses the full digital transaction infrastructure: product catalog management, payment processing, order fulfillment, and customer data management, typically delivered through a web-based storefront.

The global e-commerce market is projected to be $6.86 trillion in 2025 (eMarketer), spanning both B2B and B2C models. B2C e-commerce powers the consumer retail experiences most people interact with daily. B2B e-commerce, valued at $36 trillion and growing at 14.5% CAGR, drives procurement, wholesale, and supply chain transactions between businesses.

From a conversion standpoint, desktop conversion rates average 3%, outperforming mobile web at 2% (Dynamic Yield). Desktop users tend to be higher-intent buyers: they complete longer research cycles, handle more complex transactions, and show lower cart abandonment rates than their mobile counterparts.

Understanding e-commerce as the foundation is essential before evaluating the differences between e-commerce and m-commerce, because m-commerce does not replace the e-commerce infrastructure. It extends and complicates it.
What Is mCommerce? Why Mobile Is a Separate Strategic Channel

mCommerce (mobile commerce) refers to commercial transactions conducted via smartphones, tablets, and other handheld devices. It is technically a subset of eCommerce, but treating it as merely a responsive version of a desktop site is one of the most common and costly strategic mistakes in digital commerce.
The scale is not a forecast anymore. The US alone has 200+ million adults who have purchased via smartphone (Shopify). Globally, mobile commerce is the primary interface for most consumers, particularly in high-growth markets across Southeast Asia, India, and Latin America.

M-commerce operates across three primary business categories:

Mobile shopping: Purchasing via mobile browsers or dedicated shopping apps, including social commerce platform integrations on TikTok Shop, Instagram, and Pinterest.
Payments on mobile: Digital wallet adoption through Apple Pay, Google Pay, and PayPal, enabling one-tap or biometric-authenticated checkout flows.

Banking on mobile: In-app financial services, BNPL integrations, and account management that support the full commerce transaction lifecycle.

The strategic capabilities that define m-commerce are distinct: push notifications for cart recovery and offer delivery, geolocation targeting for proximity-based promotions, in-app purchasing with reduced checkout friction, and biometric authentication that improves both security and conversion.

Critically, shopping app users convert at 3.5% versus 2% on mobile web (BuildFire). The mobile shopping app development investment is not just a UX upgrade it is a measurable conversion rate improvement that compounds across customer lifetime value.

Understanding the difference between e-commerce and m-commerce at this level is what separates reactive platform decisions from strategic ones.

mCommerce vs eCommerce: Core Differences That Affect Business Decisions

mcommerce vs ecommerce

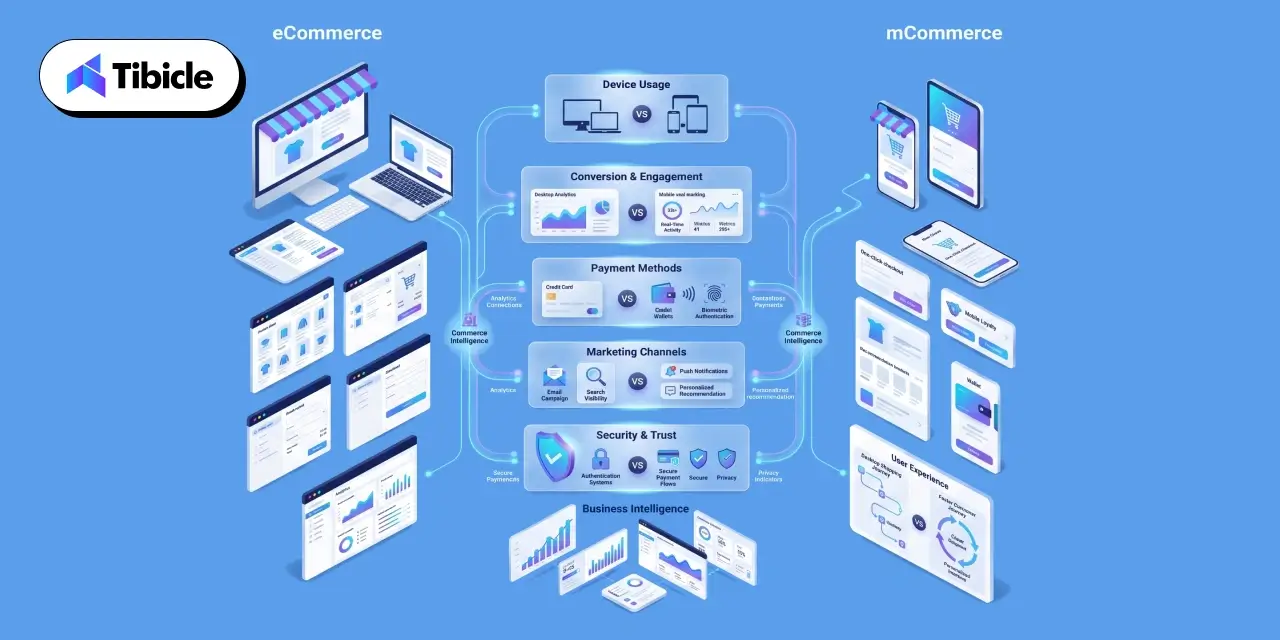
The e-commerce and m-commerce difference is not simply about screen size. At the operational level, the two channels diverge across device behavior, technology requirements, marketing infrastructure, and security posture. Each dimension carries direct business implications.

Device and User Behavior Split

Mobile drives 78% of global e-commerce traffic but only 66% of orders, a conversion gap that represents billions in underperforming revenue across the industry. Desktop users are high-intent buyers: they arrive further along in the purchase journey, complete longer research cycles, and transact with lower abandonment rates. Mobile users browse more, compare across sessions, and are more susceptible to checkout friction. The mobile commerce vs electronic commerce distinction in user behavior is not a preference difference it is a purchase psychology difference that must inform UX and funnel design.

Technology Stack and Development Requirements

E-commerce platforms are built around CMS and website infrastructure, such as Shopify, WooCommerce, Magento, and BigCommerce, with responsive design, payment gateway integration, and SEO-optimized architecture. The technology investment is primarily web-based.

M-commerce requires a fundamentally different technical layer: native app development or progressive web app e-commerce architecture, mobile payment integration with digital wallet providers, push notification infrastructure, biometric authentication, and app store compliance management. The mobile shopping app development requirement alone introduces an entirely new development discipline and cost structure that e-commerce websites do not encounter. This is a central dimension of the m-commerce vs e-commerce decision for any technology leader evaluating build-vs-buy options.

Marketing and Personalization Channels

E-commerce marketing is built around email, organic search, display advertising, and retargeting channels optimized for desktop sessions and longer consideration windows. M-commerce unlocks a distinct and often higher-engagement channel set: SMS marketing, in-app messaging, location-based offers, and social commerce platform integrations where discovery and purchase happen within a single session.

AI-powered recommendations drive up to 25% of mobile revenue (industry benchmarks), and mobile-first strategy increasingly depends on real-time behavioral personalization delivered at the session level, not the campaign level. Mobile conversion optimization through contextual, behavioral, and location-aware personalization is a genuine revenue lever, not a UX enhancement.

Security and Compliance Considerations

The difference between e-commerce and m-commerce extends into the security and compliance layer. Mobile introduces additional attack surfaces: app store compliance requirements, device-level data access permissions, biometric data regulations under GDPR and CCPA, and a fraud environment that is materially worse than desktop.

1 in 20 mobile verification attempts in 2024 were fraudulent. Any m-commerce investment must account for mobile-specific fraud prevention infrastructure, biometric authentication protocols, and ongoing compliance with regional data protection regulations costs and complexity that do not appear in a standard e-commerce platform evaluation.

mCommerce vs eCommerce Comparison Table

ParameterE-CommerceM-Commerce
Primary deviceDesktop/laptopSmartphone/tablet
Avg. conversion rate3%2% (web), 3.5% (app)
Traffic share35% globally62–64% globally
Revenue share (2025)40%60%
UX focusFull-page layouts, detailed specsSpeed, thumb-friendly UI, one-tap checkout
Payment methodsCards, bank transfers, walletsDigital wallets, BNPL, biometric pay
PersonalizationEmail, cookies, retargetingPush, geolocation, in-app behavior
Development costLower (website-only)Higher (app + mobile web + integrations)
Cart abandonment rate66%80%

Analysis: The data on m commerce vs e commerce conversion rates reveals something important. Mobile generates the majority of traffic but converts less on the mobile web. The gap is not a demand problem — it is a UX and checkout optimization problem. Businesses that close this gap through mobile shopping app development and streamlined checkout flows access a revenue pool that is already visiting their store.

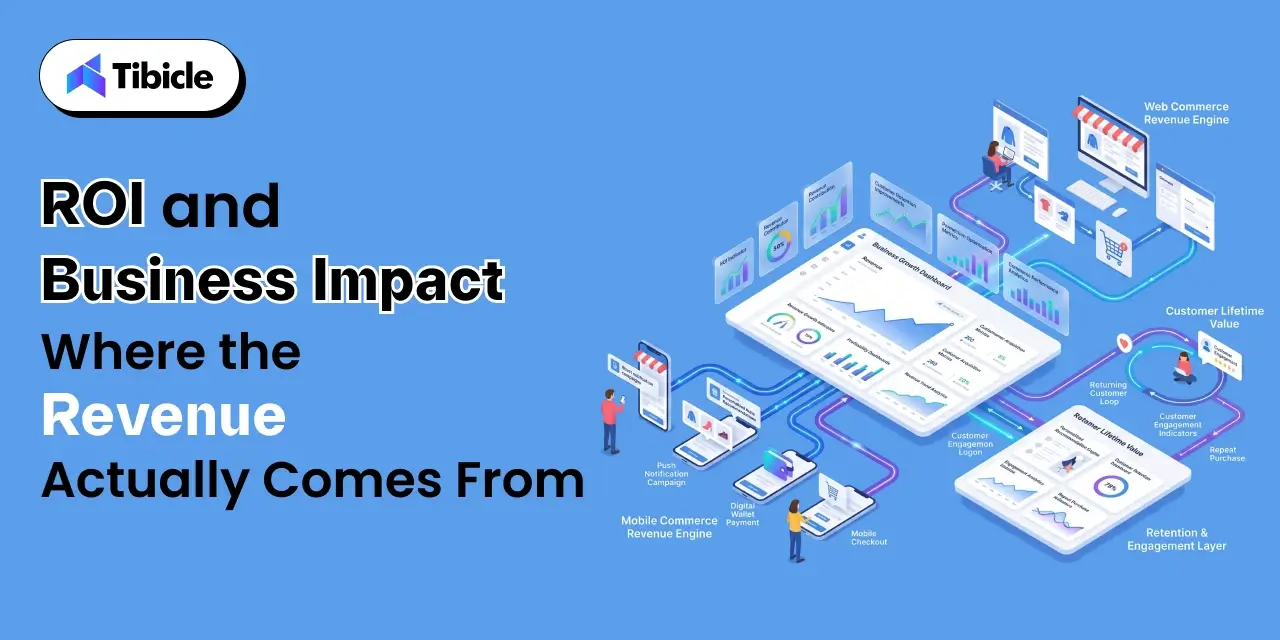
ROI and Business Impact Where the Revenue Actually Comes From

mcommerce vs ecommerce

The mobile commerce vs electronic commerce debate becomes less philosophical and more actionable when you look at where revenue is actually being generated.

Revenue Distribution by Channel

M-commerce drives 63% of global retail commerce revenue (Statista, 2025). On Black Friday 2025, 70% of all sales came from mobile devices, a figure that should recalibrate any strategic plan that treats desktop as the primary commerce channel. Mobile app users generate 2.8–5x higher customer lifetime value than web-only shoppers, making the mobile shopping app development investment one of the highest-return capital allocations available in digital commerce.

Cost of Inaction

Businesses without a mobile-optimized experience lose 78% of traffic that never converts. Customer acquisition cost (CAC) has risen 222% over the last decade, a trend that makes high-retention channels like native apps increasingly critical to unit economics. Mobile apps, through push notifications, loyalty mechanics, and personalized re-engagement, deliver higher retention and lower CAC over time than desktop-only or mobile web approaches.

App vs Mobile Web ROI

Abandoned cart push notifications alone can generate $10,000+ per month in recovered revenue for mid-market retailers. App users purchase 33% more often than non-app users. With full mobile payment integration, personalized in-app experiences, and push notification infrastructure in place, total app ROI can scale to 5–10x within the first year of deployment. For businesses evaluating the difference between e-commerce and m-commerce investment, this is the clearest financial argument for committing to native or PWA mobile development.

Cost and Pricing Factors for mCommerce vs eCommerce Implementation

Understanding the cost structure of each channel is essential for accurate ROI modeling and budget sequencing. The e-commerce and m-commerce difference in investment requirement is significant and varies considerably by business maturity.

eCommerce Platform Costs

Website development ranges from $5,000 to $50,000+, depending on platform choice (Shopify, WooCommerce, Magento, or custom builds) and feature complexity. Ongoing operational costs, such as hosting, security, maintenance, and platform licensing, typically run $500 to $5,000 per month. For most businesses, e-commerce web infrastructure is the lower-cost starting point.

mCommerce Development Costs

Native app development for iOS and Android combined typically costs $30,000 to $150,000+, depending on feature depth, integration complexity, and development partner location and seniority. A progressive web app ecommerce alternative ranges from $10,000 to $50,000, delivering app-like performance within a browser context at lower build cost, though with some capability limitations versus native. Ongoing m-commerce costs include app store fees, push notification services, mobile analytics platforms, mobile-specific QA cycles, and compliance monitoring.

Where to Prioritize the Budget

The right sequencing of m-commerce vs. e-commerce investment depends on the business stage:

  • Under $1M revenue: Mobile-responsive website first. Optimize for mobile web before investing in app development.
  • $1M–$10M revenue: Progressive web app or hybrid app investment. Capture mobile conversion improvements with lower capital outlay than a full native build.
  • Above $10M revenue: Dedicated native apps with full mobile payment integration, personalization stack, and push notification infrastructure. At this scale, the ROI math justifies the full investment.

Risks and Challenges of Each Model

No mCommerce vs eCommerce analysis is complete without an honest assessment of the risks on both sides.

eCommerce Risks

Desktop traffic share is declining globally as mobile-first behavior becomes the norm across demographics. E-commerce platforms built without a mobile-first strategy face increasing structural disadvantage. SEO volatility with algorithm updates creates revenue unpredictability for traffic-dependent businesses. And businesses that have not optimized mobile checkout on their desktop-first e-commerce sites are already losing the majority of their traffic to non-converting mobile sessions a compounding loss.

mCommerce Risks

Cart abandonment on mobile sits at 80%, the highest across all commerce channels, and a persistent challenge even for mature mobile experiences. App fatigue is a real risk: 30% of shoppers delete apps due to excessive push notifications, meaning mobile conversion optimization must be balanced against engagement frequency. Security exposure is higher: fraud rates on mobile are significant, and compliance with GDPR, CCPA, and evolving biometric data regulations adds ongoing operational cost. Perhaps most sobering: only 12% of consumers find mobile web shopping “convenient” (Dynamic Yield), a figure that underscores why mobile shopping app development, rather than mobile-responsive web, is the stronger long-term investment for businesses serious about the m-commerce channel.

Vendor Selection Checklist: What to Evaluate Before Building

Whether investing in e-commerce, m-commerce, or both, evaluate every technology partner against these criteria before committing budget:

  • Platform flexibility: Does the vendor support both e-commerce and m-commerce from a single codebase or unified backend?
  • Mobile-first architecture: Is the platform natively built for mobile-first UX, or is mobile a retrofit of a desktop-first design?
  • Payment integration: Does it support digital wallet adoption, BNPL, and biometric payment natively?
  • Scalability: Can it handle 2x–5x traffic surges during holiday peaks and flash sales without performance degradation?
  • Analytics and attribution: Does it track cross-device customer journeys and mobile-specific KPIs (push open rates, in-app conversion, session depth)?
  • Security compliance: PCI-DSS, GDPR, CCPA readiness  including mobile-specific data access and biometric regulations?
  • Post-launch support: Does the partner provide app store management, push notification strategy, and ongoing mobile QA?
  • Total cost of ownership (TCO): Upfront build cost plus 12-month operational cost  not just the development quote.

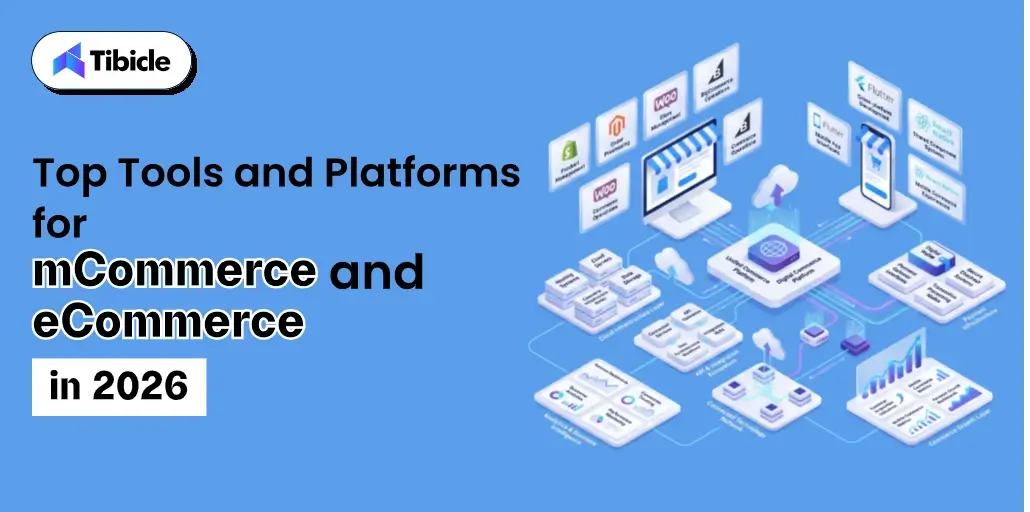
Top Tools and Platforms for mCommerce vs eCommerce in 2026

Tools and Platforms

The right platform for your m-commerce vs e-commerce architecture depends on business maturity, budget, and technical requirements. No single platform fits all.

Shopify remains the strongest mid-market option for businesses that need both e-commerce and m-commerce capability quickly. Its PWA support and native mobile payment integration make it a strong default for businesses under $10M revenue.

Magento delivers enterprise-grade flexibility for custom mobile experiences, with deep API-first architecture suited to complex B2B ecommerce and B2C at scale.

WooCommerce with mobile plugins serves budget-conscious SMBs that need mobile-responsive e-commerce without the overhead of a dedicated app investment.

BigCommerce offers native mobile optimization and strong out-of-the-box mobile conversion tools, particularly for mid-market retailers.

React Native and Flutter are the leading custom app development frameworks for businesses building dedicated native mobile apps, enabling shared codebases across iOS and Android, reducing mobile shopping app development cost by 30–40% versus fully separate native builds.

Match the tool to your business stage. Over-investing in enterprise infrastructure at an early stage, or under-investing in mobile at a growth stage, are equally costly mistakes in the m-commerce vs. e-commerce decision.

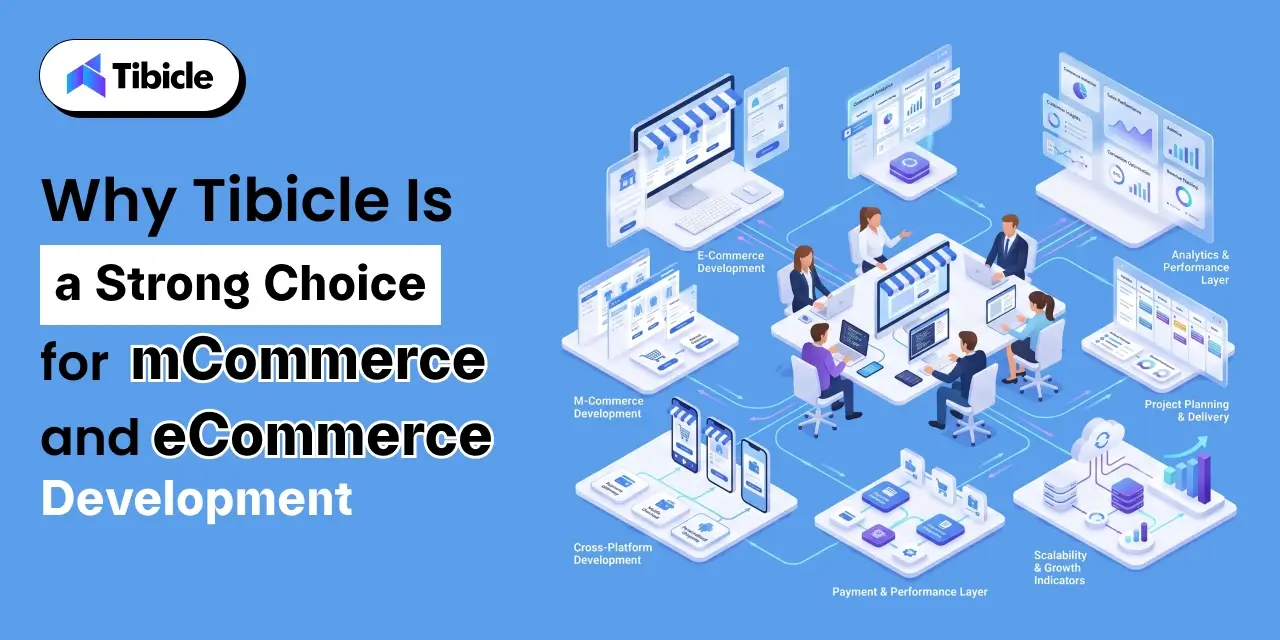
Why Tibicle Is a Strong Choice for mCommerce vs eCommerce Development

Development

Businesses that have worked through the vendor checklist above and concluded they need a custom build or a development partner capable of delivering both e-commerce and m-commerce infrastructure under a single technical relationship need more than a platform vendor. They need an engineering team.

Tibicle builds custom e-commerce and m-commerce solutions: native iOS and Android apps, progressive web app ecommerce builds, and responsive web platforms designed for a mobile-first strategy from the ground up. The team is based in Ahmedabad with senior development capability across the full stack design, build, QA, and launch, with a transparent pricing model that makes TCO forecasting straightforward.

The use case fit is specific: mid-market and enterprise B2B and B2C businesses that need both desktop and mobile commerce under one technical partner, without the coordination overhead of managing multiple vendors across the commerce stack. Tibicle’s mobile payment integration experience, cross-platform deployment capability, and mobile conversion optimization track record align directly with the criteria outlined in the vendor checklist above.

Talk to Tibicle’s commerce team to scope your mCommerce or eCommerce build and get a technical assessment of where your current architecture is leaving revenue on the table.

Conclusion

The mCommerce vs. eCommerce question is no longer an either/or decision for serious digital commerce businesses. It is a sequencing and budget allocation question one where the wrong answer at the platform architecture stage creates compounding conversion and retention problems that are expensive to unwind.

Mobile commerce is the majority revenue channel: 60% of global e-commerce revenue, 70% of Black Friday sales, and the primary commerce interface for the majority of consumers under 45. But e-commerce infrastructure, the web platform, the backend, the fulfillment and payment systems, remain the foundation on which mobile experiences are built.

For C-suite leaders, the decisions made now on vendor selection, platform architecture, and mobile investment level will directly affect conversion rates, customer lifetime value, and competitive positioning through 2026 and beyond. The businesses that treat mobile-first strategy as a core infrastructure decision, not a UX project, will be structurally better positioned to capture the commerce revenue that mobile is already generating.

Contact Tibicle to discuss your commerce platform strategy and get a custom development roadmap tailored to your current architecture, business model, and 2026 growth targets.

Frequently Asked Questions

What is the main difference between mCommerce vs eCommerce?
eCommerce covers all online buying and selling via the internet, typically through desktop or laptop browsers. mCommerce is a subset of e-commerce that involves transactions conducted specifically through mobile devices like smartphones and tablets. The core e-commerce and m-commerce difference at a strategic level lies in user behavior, technology stack, marketing channels, and conversion mechanics, not just the device used.

Is mCommerce more profitable than eCommerce?
mCommerce now drives 60% of global e-commerce revenue and mobile app users deliver 2.8–5x higher customer lifetime value than web-only shoppers. However, profitability in mobile commerce vs electronic commerce depends heavily on mobile UX quality, the level of app investment (native vs PWA), and how effectively cart abandonment, which runs at 80% on mobile, is addressed through checkout optimization and push notification recovery flows.

How much does it cost to build an mCommerce app?
A native m-commerce app for iOS and Android typically costs $30,000–$150,000+. Progressive web app ecommerce alternatives range from $10,000–$50,000 and deliver app-like performance at a lower build cost. Ongoing costs include app store fees, mobile analytics platforms, push notification services, and mobile-specific QA, typically adding $1,000–$5,000 per month in operational overhead.

Which is more profitable, mCommerce vs eCommerce?
Profitability depends on the business model, product type, and target audience rather than the platform alone. However, with mobile commerce accounting for 60% of global e-commerce sales in 2025, businesses that ignore mobile optimization risk losing a significant share of potential revenue.

Can a business run both eCommerce and mCommerce from the same platform?
Yes. Platforms like Shopify, BigCommerce, and Adobe Commerce support both e-commerce and m-commerce from unified backends. Custom builds using React Native or Flutter can share a single backend while delivering native mobile experiences on iOS and Android. For businesses evaluating mobile commerce vs electronic commerce infrastructure, a unified platform reduces development cost, simplifies analytics attribution, and eliminates backend duplication.

What conversion rate should I expect from mobile commerce?
Mobile web converts at roughly 2%, while mobile apps convert at 3.5%. Desktop e-commerce still leads at approximately 3%. The m-commerce vs e-commerce conversion gap on mobile web is primarily a UX and checkout optimization problem, not a demand problem. Businesses that invest in mobile shopping app development, one-tap checkout, and digital wallet adoption consistently see mobile conversion rates that meet or exceed desktop benchmarks.

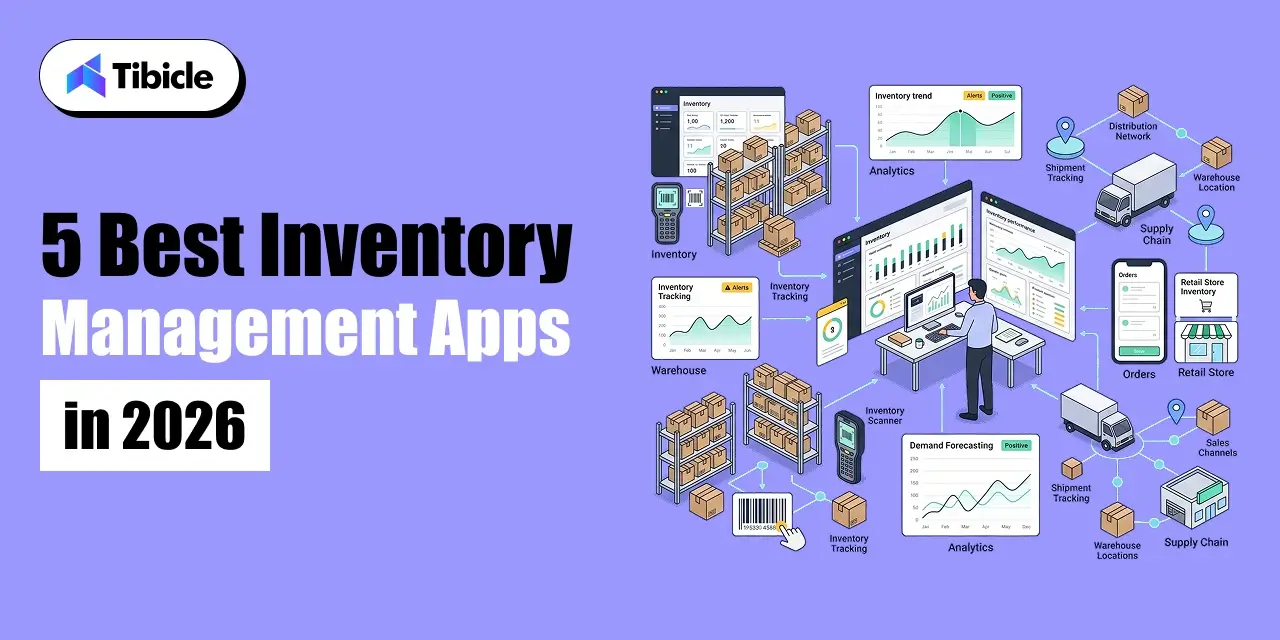
5 Best Inventory Management Apps in 2026

Introduction

An inventory management apps is now a critical tool for businesses looking to reduce stockouts, improve inventory visibility, and scale operations efficiently. In 2023, inventory distortion, stemming from stockouts and overstocking, cost global retailers $1.77 trillion. This makes inventory management a critical operational decision. Despite this, 43% of companies still rely on spreadsheets for inventory visibility in 2026.

inventory management app

The inventory management software market is projected to reach $2.75 billion in 2026, growing at a 9.13% CAGR through 2034, driven by the increasing complexity of managing multiple channels and SKUs. Inefficient inventory practices can lead to an 11% loss in annual revenue.

For decision-makers, the challenge lies not in whether to invest in an inventory management app, but in choosing the right one from a crowded market with seemingly similar features and hidden costs. This manual reviews the 5 best inventory management apps of 2026, focusing on features, pricing, ROI, scalability, and use-case fit, to support informed decision-making.

What Is an Inventory Management Apps?

Core Functions That Define an Inventory Management Apps

inventory management app

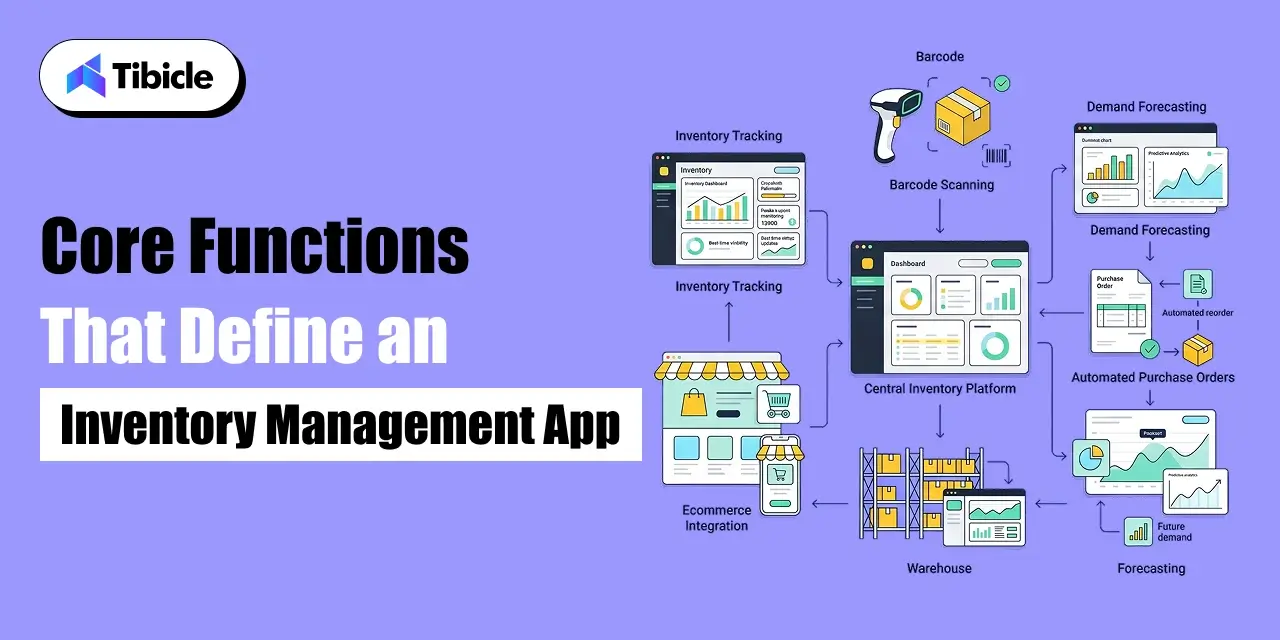
An inventory management app is a software system that tracks stock levels, manages purchase orders, monitors warehouse activity, and synchronises inventory data across sales channels and locations in real time. At its foundation, it replaces the spreadsheet with a system that updates automatically, alerts proactively, and integrates with the other tools the business depends on.

The core functions that define a production-grade inventory management system include:

Real-time inventory tracking: live stock level visibility across all locations and channels, updated with every transaction.

Automated reorder triggers: rules-based or AI-driven purchase order generation when stock falls below defined thresholds, the foundation of reorder automation.

Demand forecasting: historical sales data and seasonal trend analysis used to predict future stock requirements and prevent both stockouts and overstocking.

Barcode and QR scanning: mobile or fixed scanner integration for fast, accurate stock intake, picking, and cycle counting without manual data entry.

Multi-location inventory sync: unified visibility across multiple warehouses, stores, and 3PL partners from a single interface.

Purchase order management: end-to-end supplier order creation, tracking, and receipt confirmation with automated matching against expected deliveries.

Businesses that implement automated inventory management reduce stockouts by 30 % compared to manual approaches. That single metric, the reduction in revenue lost to empty shelves, is typically the primary driver of payback period calculation for any inventory management investment.

It is also worth distinguishing between standalone inventory management apps and ERP-embedded inventory modules. Standalone apps, the five covered in this guide, are purpose-built for inventory operations and offer faster implementation, lower cost, and more focused functionality. ERP-embedded modules offer deeper integration across finance, HR, and operations but come with significantly higher implementation cost and complexity. The right choice depends on operational scope and growth stage.

What to Look for Before Choosing an Inventory Management Apps

Scalability and Multi-Location Support

The most common and most expensive mistake in inventory management software selection is choosing a tool that fits today and breaks in 18 months. A business operating two warehouses today may need to manage 20 in three years. A retailer selling on one channel may expand to five. The app you select needs to support that growth without requiring a full platform migration, because platform migrations at scale are expensive, disruptive, and time-consuming.

Evaluate multi-location inventory capability not just as a feature checkbox but as an architectural question. How does the app handle stock transfers between locations? Does it support zone-level tracking within a warehouse? Can it sync in real time with third-party logistics partners? Supply chain visibility at the multi-location level is where mid-market inventory management systems most frequently fall short.

Integration With Existing Business Systems

An inventory management app that does not connect cleanly to your accounting system, ecommerce platform, and CRM is an app that creates manual reconciliation work, which is precisely the problem you are trying to eliminate. Before selecting any tool, map your current technology stack and verify native integration support for every system in it.

The integrations that matter most for most businesses are: QuickBooks or Xero for accounting, Shopify or WooCommerce for ecommerce, and the shipping or logistics platforms handling fulfilment. API availability and webhook support are important for any custom integration requirements beyond the standard connector library. A vendor with a limited API or no webhook support will constrain your ability to build the connected operations infrastructure your business needs as it grows.

Total Cost of Ownership vs. Sticker Price

The monthly subscription price is rarely the number that matters. Businesses spend 25 to 35 % of their operational budgets on inventory, making even small inefficiencies costly over time. That same principle applies to the tools managing inventory: the cost that appears in the pricing page is typically a fraction of what the tool actually costs over 36 months.

The cost components that consistently catch businesses off guard are per-user fees that scale with headcount, ecommerce channel add-ons charged per integration, implementation and data migration fees that are not included in the base subscription, staff training overhead that is never line-itemed in a vendor quote, and annual price escalation clauses in multi-year contracts. Evaluate every tool on a 3-year total cost of ownership basis, not a monthly sticker price.

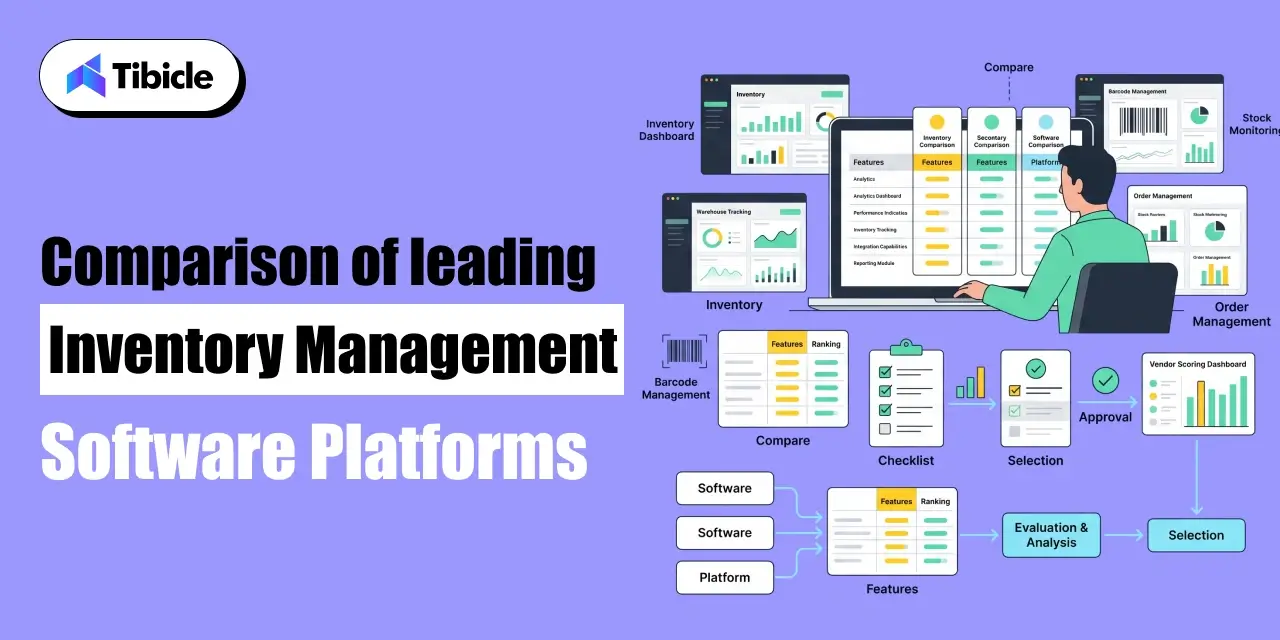
Comparison of leading inventory management software platforms

inventory management app

1. Cin7: Best for Multi-Channel Retail and Mid-Market Brands

Cin7 is a leading inventory management system for mid-market brands with multiple sales channels. It excels in channel integrations, offering a real-time inventory view across retail POS, ecommerce platforms, wholesale, and 3PL. For brands on Shopify, Amazon, and physical stores, Cin7 provides seamless multi-channel inventory sync, a feature that competitors often struggle to match without heavy customisation.

Key features: real-time multi-channel stock sync, advanced warehouse management with zone and bin tracking, built-in EDI for wholesale and retail compliance, demand forecasting as an add-on module, and automated purchase order management.

Pricing: starts at approximately $349 per month. Channel add-ons and per-user fees apply at higher tiers.

Limitations: native accounting integration is limited outside of Xero and QuickBooks. The demand forecasting module is an additional cost rather than included in the base subscription.

Ideal business size: mid-market retailers and wholesalers with 50 to 500 SKUs operating across two or more sales channels.

2. Zoho Inventory: Best for Growing SMBs and Multi-Marketplace Sellers

Zoho Inventory is an ideal choice for small and growing businesses needing affordable multi-channel inventory tracking. It’s particularly suited for businesses expanding to multiple marketplaces, like adding Amazon to Shopify, and requires a cost-effective solution to manage that growth.

Key features: multi-channel order and inventory management across Shopify, Amazon, eBay and others, barcode scanning with mobile app support; basic demand forecasting, native integration with Zoho Books for accounting; and automated reorder point alerts.

Pricing: starts at $39 per month, making it the most affordable option in this guide with a meaningful feature set.

Limitations: lower pricing tiers cap order volume and item count, which forces upgrades earlier than the price point suggests. The demand forecasting functionality is basic compared to that of Cin7 or NetSuite.

Ideal business size: SMBs and early-stage ecommerce brands with straightforward inventory needs and a Zoho ecosystem already in place.

3. Fishbowl: Best for Manufacturers and QuickBooks-Dependent Teams

Fishbowl is a specialised inventory management software designed for manufacturing businesses using QuickBooks. It offers unmatched integration with QuickBooks, eliminating reconciliation issues faced by other inventory management solutions. For those whose financial records rely on QuickBooks, Fishbowl provides a seamless experience.

Key features: Bill of Materials (BOM) and work order management for manufacturing, deep two-way QuickBooks sync, multi-location warehouse management, barcode scanning for shop floor and warehouse operations, and purchase order automation.

Pricing: approximately $349 per month on a SaaS model, or available as a one-time perpetual licence for businesses preferring to avoid recurring fees.

Limitations: a QuickBooks licence is effectively a prerequisite; the tool’s value proposition is substantially reduced without it. Demand forecasting capability is limited compared to AI-powered alternatives.

Ideal business size: small to mid-size manufacturers and product businesses with production operations that need BOM management alongside inventory tracking.

4. NetSuite: Best for Enterprise-Grade Operations and the Oracle Ecosystem

NetSuite stands out as the only true ERP in this comparison, ideal for enterprise-scale businesses with complex multi-entity, multi-currency, and multi-warehouse operations. Unlike standalone inventory management apps, NetSuite’s inventory system is integrated within a comprehensive financial and operational platform, allowing stock data to connect seamlessly with financial reporting, demand forecasting, procurement, and supply chain visibility.

Key features: AI-powered demand forecasting, real-time multi-location and multi-warehouse inventory, advanced financial consolidation across entities, built-in procurement and supplier management, and full supply chain visibility from PO to delivery.

Pricing: custom pricing, typically starting above $2,000 per month at mid-market scale. Implementation costs range from $10,000 to $100,000 or more depending on scope.

Limitations: the implementation cost and timeline make NetSuite inaccessible for most SMBs. The platform requires dedicated administrator resource post-launch. Total cost of ownership is significantly higher than any other option in this guide.

Ideal business size: enterprise businesses and fast-scaling mid-market companies with multi-entity operations, international presence, or complex supply chain requirements.

5. inFlow: Best for Lean Teams and Cost-Conscious Operations

inFlow is an excellent inventory tracking app for small teams seeking reliable, straightforward inventory management without unnecessary features. Its user-friendly interface stands out in its category, and it integrates seamlessly with QuickBooks and Xero for essential accounting connectivity. Ideal for lean operations managing a simple product catalog from one or two locations, inFlow provides the necessary tools without the complexity of larger platforms.

Key features: clean, user-friendly interface with low onboarding overhead, barcode scanning with mobile app, multi-location support, native QuickBooks and Xero integration, and purchase order management with supplier tracking.

Pricing: starts at $89 to $189 per month, positioned between Zoho’s entry price and the mid-market platforms.

Limitations: no demand forecasting capability. No Bill of Materials support, which rules it out for any manufacturing use case.

Ideal business size: small businesses, lean operations, and teams that prioritise ease of use and a clean interface over advanced analytics or manufacturing functionality.

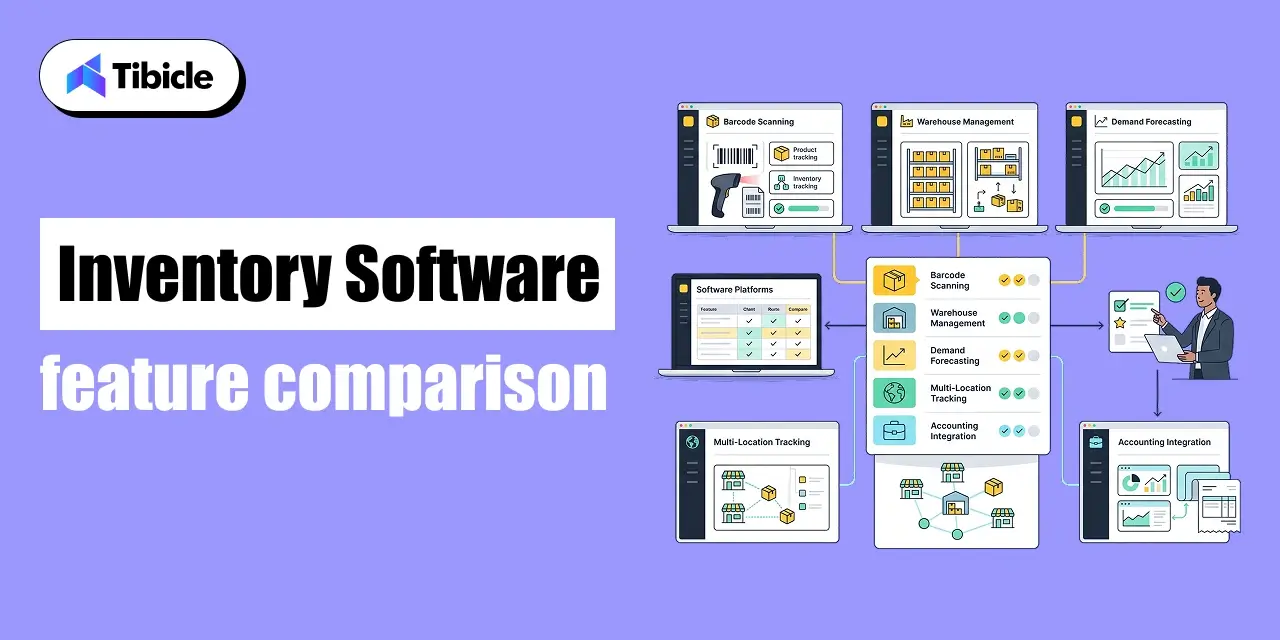
Feature-by-Feature Comparison Table

The table below maps all five inventory management apps across the features that matter most to purchase decisions. Use it alongside the individual app profiles above to identify which tool aligns with your specific operational requirements.

Inventory software feature comparison

Inventory software

The table below maps all five inventory management apps across the features that matter most to purchase decisions. Use it alongside the individual app profiles above to identify which tool aligns with your specific operational requirements.

FeatureCin7Zoho InventoryFishbowlNetSuiteinFlow
Multi-Location Support
Barcode/QR Scanning
Demand ForecastingAdd-onBasicLimitedAI-poweredNo
Manufacturing (BOM)NoNo
Native Accounting IntegrationLimitedZoho BooksQuickBooksBuilt-inQuickBooks/Xero
Starting Price/mo~$349$39~$349 (one-time license available)Custom$110
Best ForMulti-channel retailGrowing SMBsManufacturersEnterpriseSmall teams

Note: Feature availability and pricing are based on published data as of 2026. Verify current pricing tiers with each vendor before committing, as subscription structures update regularly.

Which Inventory Management Apps Fits Your Business Model?

Feature parity at the surface level masks significant differences in use-case fit. The table below maps each app to the business model it serves best, based on the operational requirements that define each model.

Business TypeRecommended App(s)Key RequirementsSelection Note
Retail / eCommerceCin7, Zoho InventoryMulti-channel sync, real-time inventory, barcode scanningCin7 for multi-channel complexity; Zoho for early-stage cost control
ManufacturingFishbowl, NetSuiteBill of Materials (BOM), work order management, production trackingFishbowl for QuickBooks-dependent teams; NetSuite for full ERP scope
Wholesale / B2BCin7, NetSuiteBulk order logic, tiered pricing, multi-warehouse managementNetSuite for enterprise scale; Cin7 for mid-market efficiency
Small Business / Lean TeamsinFlow, Zoho InventorySimple interface, affordable pricing, core stock trackinginFlow for straightforward ops; Zoho for growing multi-channel sellers

Pricing Breakdown and Hidden Costs

AppBase PriceTypical Onboarding CostKey Hidden CostsBest Model Fit
Cin7~$349/mo$1,000–$3,000Channel add-ons, per-user feesMid-market retail
Zoho Inventory$39/mo$500–$1,500Order and item caps on lower tiersSMBs, startups
Fishbowl~$349/mo or one-time license$1,000–$4,000QuickBooks licence requiredManufacturers
NetSuiteCustom (typically $2,000+/mo)$10,000–$100,000+Module fees, user licencesEnterprise
inFlow$189/mo$500–$1,000Limited forecasting, no BOMLean teams

Subscription vs. One-Time Licence Models

Four of the five apps in this guide use SaaS subscription models: Cin7, Zoho Inventory, NetSuite, and inFlow. Fishbowl offers both a monthly SaaS option and a one-time perpetual license. Perpetual licenses can be cost-effective for businesses with stable inventory needs, while SaaS is ideal for those wanting regular updates and cloud access.

A common hidden cost in SaaS models is tier-based feature gating. Entry-level subscriptions on Zoho and Cin7 limit order volumes, item counts, and user seats, leading to quicker upgrades than expected. Choose your subscription tier based on an 18 to 24 month growth trajectory rather than current volume.

Implementation and Migration Costs

NetSuite implementations can range from $10,000 to $100,000 or more, depending on modules and customizations. Mid-tier tools like Cin7 and Fishbowl typically cost between $1,000 and $5,000 for onboarding, while Zoho and inFlow are more accessible at $500 to $1,500 for standard setups.

It’s important to consider additional costs that are often overlooked, including data migration, staff training (hands-on sessions for warehouse teams), and custom integration development, which can add 20 to 40 percent to the overall implementation cost.

When Free Becomes Expensive

Both Zoho Inventory and inFlow have low introductory pricing that makes them seem more affordable than Cin7 or Fishbowl initially. However, as your business grows, you’ll encounter limitations: Zoho’s $39 tier restricts users, order volume, and warehouse locations, while inFlow’s $189 tier limits user seats and reporting features. If you’re likely growing, you’ll hit these caps within 12 to 18 months and face increased upgrade costs. Always assess costs based on your projected volume in 24 months, not just your current levels.

ROI and Business Impact of Inventory Management Apps

ROI and Business

Measurable Gains From Automated Inventory

The ROI for inventory management software is backed by documented performance data across various industries. In 2025, RFID-enabled merchants improved inventory accuracy by 15 percentage points, reducing fulfillment latency to under two hours, which positively impacted customer satisfaction. Overstocking can increase storage costs by 20-30%, but automated demand forecasting and reorder automation help mitigate this.

Key operational gains post-implementation include: reduced manual labor hours through barcode scanning, fewer emergency reorders due to proactive automation, lower inventory write-offs thanks to better demand forecasting, and faster order fulfillment with real-time stock visibility that minimizes errors.

Calculating Payback Period

The payback period formula for any inventory management app investment is straightforward: annual cost of the app divided by annual savings from reduced stockouts plus labour savings plus carrying cost reduction. For most mid-market businesses, this calculation produces a payback period of 4 to 8 months.

The KPIs to track once the system is live are inventory turnover ratio (how quickly stock is sold and replaced), stockout rate (the percentage of demand that goes unfulfilled due to zero stock), and order accuracy percentage (the proportion of orders fulfilled without error). These three metrics together form the operational scorecard that confirms whether the investment is delivering its projected return.

Vendor Lock-In and Data Portability

Proprietary data formats and limited export options in inventory management software can raise switching costs if the tool underperforms or the business outgrows it. Before signing a contract, ensure that stock data, transaction history, and supplier records can be exported in standard formats (at least CSV) and that the process is documented for user access.

The risk of vendor lock-in is highest with NetSuite due to high implementation and data migration costs, making switching difficult. In contrast, Zoho and inFlow have lower implementation costs, resulting in more manageable switching expenses. Consider this alongside feature fit and pricing during your selection process.

Vendor Selection Checklist for Decision-Makers

Use this checklist when evaluating any inventory management app or custom inventory management system before committing to a purchase or build decision:

  • Does the app support your current SKU volume and your projected volume at 24-month scale?
  • Can it integrate natively with your existing ERP, accounting platform, and ecommerce stack without custom middleware?
  • What is the total 3-year cost including subscription fees, implementation, training, and add-on modules?
  • Does the vendor offer SLA-backed uptime guarantees with defined compensation for downtime events?
  • Is data exportable in standard formats (CSV and API access) without requiring vendor assistance
  • Does the platform support your industry-specific compliance requirements (food expiry tracking, serial number traceability, lot management)?
  • What is the vendor’s documented track record with businesses at your size and operational complexity?
  • Is a free trial or sandbox environment available before committing to a paid subscription?

Why Tibicle Is a Strong Choice for Custom Inventory Management Apps Development

Off-the-shelf inventory management apps solve 80 % of inventory management requirements effectively. The remaining 20% of businesses with unique workflows, industry-specific compliance requirements, or operational complexity that standard tools cannot accommodate need a custom-built inventory management system designed around their exact processes, not adapted to fit the constraints of a generic platform.

Tibicle builds custom inventory management software for mid-market businesses that have outgrown spreadsheets and generic tools but do not need or cannot justify the cost of a full NetSuite ERP implementation. Core capabilities include multi-warehouse real-time inventory sync, role-based access control for warehouse, procurement, and management functions, custom reporting dashboards built around the KPIs that matter to your operations, and API integration with any existing ERP, accounting, or ecommerce system in your stack.

The engagement model starts with a structured discovery phase that maps your current inventory workflows, identifies the specific failure points costing revenue, and produces a build scope tied directly to measurable operational outcomes. Pricing is milestone-based with transparent phase-wise breakdowns, no lump-sum quotes, and no scope ambiguity. Post-launch support is provided under a defined SLA.

Cross-industry experience across retail, manufacturing, logistics, and wholesale means the team builds with commercial context, not just technical capability. If the five apps in this guide do not fit your operational requirements, a custom inventory management app built by Tibicle might. Talk to Tibicle’s team to scope an inventory management solution that matches your exact workflow.

Conclusion

The right inventory management app for your business is determined by three variables: your current and projected operational scale, the business model you are running, and the systems your new platform needs to integrate with. There is no single best answer but there is a right answer for each business context, and this guide has laid out the data to find it.

Zoho Inventory provides the most accessible entry point for SMBs and growing ecommerce brands thanks to its affordable pricing and strong multi-channel capabilities. Mid-market retailers operating across multiple sales channels will find Cin7 to be the most balanced solution for inventory visibility and operational control. Businesses that rely heavily on QuickBooks and require manufacturing functionality should consider Fishbowl. NetSuite remains the benchmark for enterprise organisations needing a complete ERP ecosystem with advanced inventory management. Meanwhile, inFlow is an excellent fit for lean teams seeking a straightforward, cost-effective solution without the complexity of larger platforms.

Use the feature comparison table and vendor checklist in this guide as your decision tools. If none of the five apps fits your operational requirements precisely, a custom inventory management system built around your specific workflows is the alternative worth evaluating. Schedule a free consultation with Tibicle to discuss a custom inventory management app built for your business needs.

Frequently Asked Questions

What is the best inventory management app for small businesses in 2026?
Zoho Inventory and inFlow are strong options for small teams. Zoho starts at $39/month with multi-channel support, while inFlow offers a clean interface with  QuickBooks/Xero integration from $110/month.

How much does an inventory management app cost?
Pricing ranges from $39/month (Zoho Inventory) to custom enterprise pricing (NetSuite). Factor in implementation, training, and add-on fees for an accurate 3-year cost estimate.

Can an inventory management app integrate with QuickBooks?
Yes. Fishbowl offers the deepest QuickBooks integration among standalone apps. Zoho Inventory and inFlow also support QuickBooks and Xero syncing.

What ROI can I expect from an inventory management app?
Mid-market businesses typically see a 4–8 month payback period through reduced stockouts, lower carrying costs, and fewer manual labor hours.

When should a business consider custom inventory management software instead of off-the-shelf apps?
When your workflows require industry-specific compliance, multi-system integrations that existing apps don’t support, or unique reporting and automation that standard tools can’t deliver.

eCommerce App Development Cost in 2026: Full Guide

Introduction

eCommerce app development cost is one of the most important considerations for brands planning a mobile commerce strategy in 2026. Global mobile commerce is projected to account for 59–62% of all eCommerce sales by 2027, making mobile apps a revenue-critical investment for online retailers.

ecommerce app development cost

Yet most decision-makers approach it without a clear financial framework. eCommerce app development cost ranges from $25,000 to $250,000 or more, depending on scope, and the gap between those numbers is not arbitrary. It reflects choices around features, platform, team model, and business model that directly determine ROI.

The problem with most cost guides is that they publish a price range without connecting it to business outcomes. The document takes a different approach, breaking down the costs of developing eCommerce apps by app type, complexity, features, platform, and team location. It then correlates each cost variable with measurable returns. Whether you are a founder evaluating your first mobile commerce investment or a CTO benchmarking vendor quotes, this guide gives you the data to make a budget-backed decision.

It will cover actual pricing tiers, feature-level cost drivers, platform trade-offs, ROI benchmarks, and a vendor evaluation checklist to help you move from budget confusion to building confidence.

What is eCommerce App Development?

eCommerce app development is the process of designing, building, and deploying a mobile or web application that enables businesses to sell products or services digitally. Unlike a standard website, a dedicated app offers persistent sessions, push notifications, biometric checkout, and native device integrations that consistently outperform mobile web on conversion and retention metrics.

Understanding what you will pay begins with understanding which type of app you are building, because each model carries a different scope and budget profile.

Types of eCommerce Apps and Their Business Models

ecommerce app development cost

B2C (Business-to-Consumer): Brands sell directly to individual shoppers. Cost is driven by UI depth, personalisation engines, and third-party payment integrations.

B2B (Business to Business): Companies sell to other businesses at scale. Higher complexity due to bulk ordering logic, tiered pricing, and account management workflows.

C2C (Consumer to Consumer): Peer-to-peer marketplaces where users buy and sell. Requires seller onboarding, escrow logic, and dispute resolution systems.

D2C (Direct to Consumer): Brands bypass retailers and sell directly. Subscription billing, loyalty programs, and retention flows are the primary cost drivers.

Marketplace: Multi-vendor platforms where multiple sellers list products. The most complex model requires split payments, seller dashboards, and commission tracking.

Subscription: Recurring billing apps with membership gating and dunning flows add 20 to 30 % to the base build cost.

How Much Does eCommerce App Development Cost in 2026?

The cost to build an eCommerce app in 2026 varies significantly based on complexity, team location, and platform choice. There is no universal number, but there are reliable tiers that correlate with feature scope and business stage.

Businesses recoup eCommerce app development cost within 6 to 18 months on average, with an ROI of up to 10x compared to mobile web. That return profile makes the investment defensible even at the higher end of the pricing spectrum, provided the build is scoped correctly.

Cost by App Complexity Tier

TierFeatures IncludedEstimated CostTimeline
Basic / MVPCatalog, cart, payments, user accounts$25,000–$60,0002–4 months
Mid-TierAI recommendations, loyalty, analytics, multi-payment$60,000–$150,0004–6 months
Enterprise / AdvancedCustom ERP, multi-currency, AR, marketplace logic$150,000–$300,000+6–10 months

Key Factors That Influence eCommerce App Development Cost

Understanding what drives the overall cost is more useful than any single number. The following variables account for the majority of budget variance across projects.

Feature Complexity and Scope

Feature selection is the single largest cost driver in your overall mobile commerce budget. Below is a feature-wise cost breakdown based on current market rates:

FeatureEstimated Cost Range
Payment Gateway Integration$3,000–$15,000
AI Personalisation Engine$10,000–$30,000
AR Try-On / Visualisation$15,000–$40,000
Admin Dashboard$5,000–$20,000
Push Notification System$2,000–$8,000

AR visualisation is the fastest-rising cost driver in 2026. Brands in fashion and furniture are investing in it because it measurably reduces return rates and lifts average order value. Despite its premium price tag, the ROI case is well-documented.

Platform Choice: Native vs. Cross-Platform

Platform decision is the second major lever on the eCommerce mobile app development cost. Building separate native apps for iOS and Android adds 40 to 60 % to the total cost. Cross-platform frameworks such as Flutter and React Native enable a single codebase to power both platforms, reducing build time and maintenance overhead without a significant performance trade-off in most retail use cases.

For most B2C and D2C brands, cross-platform ecommerce app development is the financially rational choice.

Development Team Location and Model

RegionHourly Rate
US / Canada$100–$200/hr
Western Europe$80–$150/hr
Eastern Europe$40–$80/hr
South Asia$20–$50/hr

The team model also shapes total cost. In-house teams offer control but require full employment overhead. Agencies deliver structured delivery with higher rates. Freelancers reduce cost but introduce coordination and accountability risk. For mid-tier builds, a specialist ecommerce agency with a nearshore or South Asian delivery model offers the best balance of cost and quality.

Backend Infrastructure and Third-Party Integrations

Enterprise ecommerce apps require integrations across ERP systems, CRM platforms, payment gateways, and cloud hosting environments. Each integration adds scoping and development hours. App store fees take 30% of in-app revenue; cloud hosting and scaling add $1,000 or more per month, depending on traffic; and annual maintenance costs 15 to 20% of the original build cost. In aggregate, these post-launch costs inflate the total investment by approximately 25% over the first year.

eCommerce App Development Cost by Business Model

Online store app pricing differs significantly by business model. Each model introduces distinct technical requirements that shift the cost envelope.

B2C App Pricing

B2C eCommerce apps typically cost between $30,000 and $120,000. Cost is primarily driven by UI depth, personalisation layers, and third-party integrations such as loyalty platforms, review systems, and dynamic pricing engines. High-volume B2C apps with complex catalogue management and recommendation logic trend toward the upper end of this range.

B2B and Marketplace App Pricing

B2B and marketplace apps carry a higher eCommerce app development cost, ranging from $80,000 to $250,000 or more. Multi-vendor dashboards, split payment logic, seller onboarding workflows, and tiered access controls each add significant scope. Marketplace logic alone can add $40,000 to $80,000 to a mid-tier build.

Subscription and D2C App Pricing

Recurring billing logic, dunning automation, membership gating, and cohort-based analytics add 20 to 30 % to the development budget for subscription and D2C models. These apps also tend to require deeper CRM integrations to support lifecycle marketing workflows.

Native vs. Cross-Platform vs. PWA: Cost and Performance Compared

ecommerce app development cost

Technology architecture is one of the highest-leverage decisions in managing your total development investment. The following comparison covers the three primary build approaches:

ParameterNative (iOS + Android)Cross-Platform (Flutter/React Native)PWA
Build Cost$80K–$250K+$40K–$150K$15K–$50K
Time to Market6–10 months3–6 months2–4 months
PerformanceHighestNear-nativeLimited
Maintenance CostHigh (two codebases)Moderate (single codebase)Low
Best ForEnterprise, high-volume retailMost B2C/D2C brandsEarly validation

Cross-platform frameworks now cover more than 90% of standard eCommerce use cases without a meaningful performance gap for most retail applications. Flutter and React Native ecommerce builds have become the default recommendation for brands that want near-native performance at a 40 to 60 % lower cost than separate native builds.

The decision framework for senior leadership is straightforward: match platform choice to revenue stage. PWA for early validation, cross-platform for growth-stage B2C and D2C, native only when scale and performance demands justify the premium.

How to Reduce eCommerce App Development Cost Without Compromising Quality

Reduce eCommerce

Reducing eCommerce app development cost is not about cutting corners. It is about sequencing investment to match validated demand. The following strategies consistently deliver better outcomes at lower upfront spend.

Start With an MVP

Validate five core user flows before building thirty features. Those five flows are: search, product detail, cart, checkout, and account management. An MVP ecommerce app in the $18,000 to $30,000 range that drives real conversions is more strategically valuable than a $90,000 feature-complete build that has not been tested against actual user behaviour. This approach reduces upfront ecommerce app development cost by 40 to 60%.

Prioritise Features by Revenue Impact

Payments and cart functionality drive approximately 80 % of direct revenue from an eCommerce app. Add AI personalisation, AR features, and loyalty programs only after you have validated demand and have the user volume to measure their impact. Premature feature investment is one of the most common causes of cost overrun.

Use Pre-Built SDKs and APIs

Payment integrations via Stripe, Braintree, or PayPal eliminate the cost of building a custom payment engine. Similarly, pre-built SDKs for push notifications, analytics, and review systems reduce development time significantly. This approach can cut feature development cost by 20 to 35% across a mid-tier build.

Offshore Strategically

India-based development teams deliver savings of up to 60 % compared to US and Canada rates. For mid-tier eCommerce app development scope, quality trade-offs are minimal when working with an established agency. Notably, hourly developer rates dropped 9 to 16% globally in 2025 to 2026 as AI-assisted development tools compressed delivery timelines, improving the cost per deliverable across all regions

ROI of Investing in an eCommerce App: What the Data Shows

ROI of Investing

eCommerce app development cost is only half the equation. The other half is quantified return. The data consistently shows that branded mobile apps outperform mobile web on every revenue metric that matters.

Revenue Uplift and Conversion Gains

App conversion rates average 4.5 % compared to 1.5 % on mobile web, a 3x advantage that compounds with scale. App users spend three times more per session and return to the store twice as often. AI-powered ecommerce apps generate 20 to 30 % more revenue than mobile websites. These are not marginal differences. They fundamentally change the return profile of the investment.

Measuring ROI Across Three Horizons

“The central question for leadership teams is whether these investments produce measurable commercial returns.” 

Short-term (0 to 90 days): Track install rate, activation rate, and checkout conversion rate versus mobile web. These metrics establish the baseline.

Mid-term (90 days to 12 months): Monitor monthly active users, average order value (app users have 140% higher AOV than mobile web), and push-notification recovery rate for abandoned carts.

Long-term (12 months and beyond): Measure customer lifetime value per app user, repeat purchase frequency, and net promoter score. App users consistently show higher LTV than any other acquisition channel.

Case-Level Proof Points

Starbucks reported a 30 % increase in customer retention and a 22% lift in mobile orders following its app investment. Sephora saw a 25 % increase in in-app purchases after deploying AI-powered recommendations. These benchmarks are instructive: the ROI from this investment scales with retention-first feature design, not with feature volume.

Mini Case Study: How a Mid-Market Fashion Retailer Recovered Its Build Cost in 8 Months

The Retailer: A mid-market fashion brand generating $6 million in annual ecommerce revenue. Mobile traffic accounted for 68 % of total sessions, but the mobile conversion rate sat at just 1.4 % – against a desktop conversion rate of 3.8 %.

The Problem: The brand was haemorrhaging revenue at two points. First, mobile checkout abandonment was costing an estimated $180,000 annually; customers were browsing on mobile and switching to desktop to buy. Second, a 34 % product return rate driven by sizing uncertainty was compressing margins faster than new customer acquisition could compensate.

The Implementation: The brand invested $72,000 in a cross-platform Flutter app scoped around four features directly tied to the two problems above: one-tap checkout with Apple Pay and Google Pay, an AI personalisation engine serving dynamic product feeds, AR-based virtual try-on for their top 200 SKUs, and behaviour-triggered push notifications for cart abandonment recovery. The build ran from discovery to launch in 14 weeks.

The Results: 12 Months Post-Launch

  • Mobile conversion rate lifted from 1.4 % to 3.6 %-  a 157 %improvement
  • Return rate on AR-enabled products fell from 34 % to 19 %
  • Average order value increased by 28 % through AI-powered cross-sell recommendations
  • Abandoned cart push notifications recovered $94,000 in attributed revenue in year one
  • Full development cost recovered within 8 months of launch

The Lesson: The investment paid back not because of how many features were built, but because each feature was matched to a specific, measurable revenue problem. That alignment came from a structured discovery phase before a single line of code was written, which is the variable that separates ecommerce app investments that pay back from those that do not.

Common Risks and Challenges in eCommerce App Development

Understanding the risks is as important as understanding what you will pay to build. The following categories account for the majority of project failures and cost overruns.

Scope Creep and Budget Overruns

Scope creep is the most common cause of 25 % or greater cost inflation in eCommerce app projects. Every unplanned feature added mid-build extends timelines and disrupts delivery rhythm. Mitigation requires milestone-based contracts with defined deliverables and a change-impact review process for any scope addition. Agile delivery with fixed sprint scope is more reliable than open-ended time-and-materials arrangements.

Post-Launch Hidden Costs

Most project estimates do not account for what happens after launch. Annual maintenance averages 15 to 20 % of the original build cost. Apple and Google app store fees take 30% of in-app revenue. Cloud infrastructure scales with traffic, adding $1,000 or more per month at meaningful volume. Budget planning should account for the year-two total cost of ownership, not just the build cost.

Poor Vendor Selection

Quotes below $5,000 to $10,000 for custom eCommerce app development almost always mean template-heavy builds with limited scalability, no discovery phase, and minimal post-launch support. The cost of rebuilding a poorly scoped app typically exceeds the cost of building it correctly the first time.

Security and Compliance Gaps

PCI DSS compliance is required for any app processing card payments. GDPR applies to any app serving EU users. Building compliance into the architecture from the start adds cost but protects against regulatory penalties and reputational risk that would far exceed the investment. Do not treat compliance as an optional scope.

Vendor Selection Checklist: How to Choose the Right eCommerce App Development Partner

Selecting the right development partner is as consequential as any feature or platform decision. The following framework directly affects the quality and value you will receive from your investment.

10-Point Evaluation Framework

  1. Proven eCommerce portfolio, not just generic mobile app development experience.
  2. The discovery and product strategy phase is included in the engagement, not treated as optional.
  3. Transparent cost breakdown by project phase, not a single undifferentiated lump sum.
  4. Cross-platform expertise in Flutter or React Native eCommerce development.
  5. Post-launch maintenance and support with a defined SLA.
  6. Scalability architecture that anticipates growth beyond MVP scope.
  7. Integration capability across ERP, CRM, and payment gateway systems.
  8. Clear communication cadence and structured project management tooling.
  9. Client references with documented ROI data from comparable eCommerce builds.
  10. IP ownership and contract terms that clearly assign code ownership to the client.

Need a partner who meets every criterion on this list? Tibicle’s eCommerce development team can scope your project with a transparent phase-wise cost breakdown.

Why Tibicle Is a Strong Choice for eCommerce App Development

Tibicle’s approach to eCommerce app development is built around the same evaluation framework described above. The team specialises in Flutter and React Native ecommerce builds for mid-market B2C and D2C brands that need scalable mobile commerce apps without enterprise-level budgets and timelines.

The engagement model starts with a structured discovery phase before any code is written. That product strategy step aligns build scope to revenue goals, which is the primary mechanism for controlling budget and reducing scope creep before it starts.

Pricing is delivered in transparent phase-wise breakdowns. Clients see exactly what each phase costs, what it delivers, and how it connects to the next. Post-launch support is provided under a defined SLA, not treated as a bonus service.

For brands evaluating mobile commerce investment with a team that can demonstrate measurable ROI from previous builds, Tibicle offers a practical and commercially transparent option within the vendor landscape.

Talk to Tibicle’s ecommerce team to get a detailed cost estimate and project roadmap for your app.

Conclusion

eCommerce app development cost in 2026 is shaped by four variables: complexity tier, platform choice, feature scope, and development team model. A basic MVP eCommerce app starts at $25,000. An enterprise-grade platform can exceed $300,000. The right investment decision is not about picking a number from a range. It is about matching scope to your current revenue stage and measuring return across short, mid, and long-term horizons.

Apps outperform mobile web on every measurable commerce metric. The ROI case is well-established. The remaining question is not whether to invest, but how to scope the investment correctly.

Frequently Asked Questions

How much does it cost to build a basic eCommerce app in 2026?
A basic eCommerce app with catalogue, cart, payments, and user accounts costs between $25,000 and $60,000. The timeline is typically 2 to 4 months with a cross-platform framework like Flutter or React Native. This is the recommended starting point for most first-time mobile commerce investments.

What is the difference in cost between native and cross-platform ecommerce apps?
Native apps built separately for iOS and Android cost 40 to 60 % more than cross-platform builds. For most B2C and D2C brands, cross-platform development covers more than 90 % of the required functionality at a significantly lower total investment.

What hidden costs should I plan for after launching an eCommerce app?
Annual maintenance runs 15 to 20% of the initial build cost. App store fees take 30% of in-app revenue. Cloud hosting and scaling add $1,000 or more per month, depending on traffic volume. Build these figures into your year-two total cost of ownership calculation.

How long does it take to see ROI from an eCommerce app?
Most businesses recoup their eCommerce app development cost within 6 to 18 months. Apps with strong retention features, such as push notifications and loyalty programs, deliver ROI up to 10x higher than mobile web over a 24-month window.

Should I build an MVP first or a full-featured eCommerce app?
Start with an MVP eCommerce app. Validate five core user flows: search, product detail, cart, checkout, and account management. Build advanced features like AI recommendations or AR visualisation only after you have real conversion data. This approach reduces upfront ecommerce app development cost by 40 to 60%.

How do I choose the right eCommerce app development company?
Evaluate vendors based on eCommerce-specific portfolio work, transparent phase-wise pricing, post-launch support SLA, cross-platform expertise, and client references that include measurable ROI data. Avoid any vendor quoting under $10,000 for a custom eCommerce build. That price point cannot accommodate proper discovery, architecture, testing, or support.

Frontend Development for Beginners: The 2026 Learning Roadmap That Actually Works

Introduction

JavaScript is used by 66% of professional developers, React holds 44.7% adoption, and TypeScript has reached 44%, according to the Stack Overflow Developer Survey 2025. Frontend development is, by usage data, the most common entry point into a software career.

frontend development

The problem is not a shortage of learning resources. The problem is tutorial hell: the experience of completing 40 hours of video content and still not being able to build a working app without the instructor’s code in front of you. Most beginners burn three to six months learning the wrong things in the wrong order.

This frontend development guide is built around one principle: the order you learn things matters more than the resources you use. It lays out the exact sequence for 2026, phase by phase, with data on timelines and the specific mistakes that derail beginners at each stage.

What Is Frontend Development in 2026?

Frontend development is the practice of building the interfaces that users see and interact with on websites and web applications. It covers everything between the data your backend produces and the experience your user has: layout, interactivity, performance, and accessibility.

In 2026, frontend development has expanded well beyond static HTML pages. The U.S. Bureau of Labor Statistics projects 7% job growth for web developers through 2034, with roughly 14,500 annual job openings. Employers now expect responsive design, component-based architecture, Core Web Vitals optimization, and TypeScript proficiency alongside traditional HTML, CSS, and JavaScript fluency.

The React Compiler, which shipped as stable in late 2024, automates performance optimizations like memoization that once required manual effort, changing how beginners learn React patterns. AI coding assistants are reshaping how juniors learn: 84% of developers say they use or plan to use AI tools in their workflow, per the 2025 Stack Overflow Survey. Learning frontend development today means learning alongside AI tooling, not instead of it.

The Frontend Development Learning Roadmap: Phase by Phase

frontend development

Most beginners who fail do so between Phase 1 and Phase 3. They rush toward React before their CSS and JavaScript fundamentals are solid enough to understand what React is doing. The timeline below assumes 2-3 hours of practice daily. At that pace, most learners reach job-readiness in 8-10 months.

Phase 1: HTML and Semantic Structure (Weeks 1-3)

HTML is the skeleton of every web page. Learning it is faster than most beginners expect, but most beginners learn it wrong: they memorize tags without understanding semantic structure.

Semantic HTML uses elements that communicate meaning to browsers and assistive technologies. A screen reader navigating a page built with proper header, nav, main, article, and footer elements can provide a usable experience. The same page built entirely with div elements cannot. Employers in 2026 evaluate semantic HTML during frontend development interviews because it signals an understanding of accessibility and how browsers parse documents.

By the end of Phase 1, you should be able to build a multi-section HTML page using appropriate semantic elements, link between pages, and embed images and forms without referencing documentation for every tag.

Phase 2: CSS, Flexbox, Grid, and Responsive Design (Weeks 4-7)

CSS is where most frontend development beginners slow down or quit. The reason is not complexity. It is that CSS taught in isolation from real layouts produces skills that do not transfer to real projects.

The learning sequence that works: start with the box model, then CSS selectors, then Flexbox, then CSS Grid. Add responsive design with media queries after you are comfortable with Flexbox layouts. Do not add Tailwind CSS until you can build a layout from scratch without it. Tailwind is a utility library that accelerates work you already know how to do. Beginners who reach for Tailwind before understanding the box model write styles they cannot debug.

Core Web Vitals, specifically Cumulative Layout Shift (CLS), are directly affected by how well you understand CSS layout. Pages with CLS above 0.1 are penalized in Google rankings. Learning CSS well is not just a user experience investment; it is an SEO investment.

Phase 3: JavaScript Fundamentals and DOM Manipulation (Weeks 8-14)

JavaScript is where frontend development becomes interactive. This phase is the longest because JavaScript has the steepest conceptual curve of the three foundational technologies.

The concepts that matter most for a working frontend developer: variables and data types, functions and scope, arrays and objects, DOM manipulation and event listeners, asynchronous JavaScript with promises and async/await, and the fetch API for making HTTP requests. That is the complete list. Everything else is either framework-specific or an advanced pattern that emerges from these fundamentals.

Common mistake: skipping DOM manipulation to jump straight to React. React is a JavaScript library that abstracts the DOM. Developers who skip direct DOM work do not understand why React exists or what problem it solves. That gap surfaces in every technical interview.

By the end of Phase 3, you should be able to build a working to-do application, a weather app using a public API, and a form with client-side validation, all in vanilla JavaScript without a framework.

Phase 4: React and TypeScript (Weeks 15-24)

React is the first frontend framework worth learning in 2026 for four reasons: 44.7% adoption among professional developers, the largest ecosystem of component libraries and tooling, the most job postings, and the most learning resources with the highest average quality.

Start with functional components and hooks: useState, useEffect, useContext. Add React Router for client-side navigation. Add a state management solution (Zustand is simpler than Redux for most use cases in 2026). Then add TypeScript. TypeScript has reached 44% developer adoption not because it is required but because it catches an entire class of errors before they reach production.

Vite has replaced Create React App as the standard development tooling for new React projects in 2026. If a tutorial still uses Create React App, it is out of date. Next.js is the production-grade framework layered on top of React for server-side rendering and static generation. Learn React before Next.js. Knowing the tool that Next.js builds on top of makes Next.js significantly easier to learn.

Common Mistakes Beginners Make in Frontend Development

Common Mistakes

These four mistakes account for the majority of stalled frontend development learners in 2026:

  1. Reaching for Tailwind CSS before understanding Flexbox. Tailwind accelerates what you already know. Applied before CSS fundamentals are solid, it produces styles you cannot debug because you do not understand what they are doing.
  2. Copying Vite or Webpack configurations without reading them. Build tool configuration contains decisions about how your frontend development project compiles, optimizes, and deploys. Developers who do not understand their config cannot diagnose build failures.
  3. Not using Git from day one. Version control is not a tool you add later. Every project you build during the learning phase should be committed to GitHub. Employers look at GitHub profiles during frontend development hiring. A profile with 40 weeks of consistent commits tells a story no resume can.
  4. Building without measuring. Chrome DevTools, Lighthouse, and Core Web Vitals are part of the frontend development toolkit. Every project you ship should be audited for performance before you add it to a portfolio.

Essential Frontend Development Tools in 2026

Essential Frontend

The tool stack for a working frontend developer in 2026 is shorter than most tutorials suggest. Master these five before adding anything else:

  • VS Code: The dominant code editor for frontend development. Install the Prettier, ESLint, and GitLens extensions as your first three additions.
  • Chrome DevTools: Your debugging environment. Learn the Elements panel for HTML and CSS inspection, the Console for JavaScript debugging, the Network tab for API calls, and Lighthouse for performance audits.
  • Git and GitHub: Version control and portfolio hosting. If you do not have a GitHub account, create one today.
  • Figma: Frontend developers who can read and extract values from Figma design files are significantly easier to hire. Most companies design in Figma. You do not need to be a designer. You need to understand how to translate a design file into CSS.
  • Storybook: Component documentation and isolated development. Used by professional frontend teams to develop and test UI components independently from the application.

How AI Is Changing Frontend Development for Beginners

Changing Frontend

GitHub Copilot, Cursor, and Claude are now part of how many junior frontend developers write code. The 2025 Stack Overflow Survey found 84% of developers use or plan to use AI tools in their workflow.

For beginners, the risk is using AI to bypass the understanding phase. A beginner who uses Copilot to complete their Phase 3 projects without reading and understanding the generated code will arrive at Phase 4 with a gap in JavaScript fundamentals that slows every subsequent step. Use AI tools to check your work and understand alternatives, not to write the code for you during the learning phase.

The frontend development skill that AI has not replaced, and will not replace in the near term, is debugging. Debugging requires understanding what the code is supposed to do, reading error messages fluently, and forming a mental model of program state. Those skills only develop through practice. Write your own code during the learning phase. Use AI to learn from your mistakes after you have written them.

Why Tibicle Is the Right Partner for Frontend Development Projects

Learning frontend development is one path. Hiring a team that already has the stack mastered is another. For businesses that need production-grade frontend work delivered now, Tibicle’s frontend engineering capability covers React, Angular, Next.js, and Vite  the exact tooling this roadmap identifies as the 2026 standard.

Their senior Angular and React developers have shipped web applications across edtech, healthcare, e-commerce, and enterprise SaaS. Tibicle’s UI/UX team works directly with frontend engineers, which means the gap between Figma design file and production component  the gap that trips up most mid-level frontend developers — is handled inside a single team rather than across two separate vendors.

Clients working with Tibicle on frontend projects report consistent outcomes: high-quality designs delivered ahead of schedule, clear communication, and fast adaptation to feedback. One client noted that Tibicle’s delivered designs enabled a seamless transition directly into development without rework. That handoff quality reflects a team that understands both the design system and the component architecture it needs to produce.

Conclusion

Frontend development in 2026 has a clear learning path: HTML to CSS to JavaScript to React. The order matters, the timeline is predictable, and the tools are well-established. Beginners who follow this sequence and build real projects at each phase reach job-readiness in under a year.

For businesses that need frontend development expertise now rather than 8-10 months from now, Tibicle’s frontend engineering team delivers React, Angular, and Next.js applications across the full project lifecycle. Get in touch to discuss your project requirements and engagement options.

Frequently Asked Questions

What should a complete beginner learn first in frontend development?
Start with HTML, specifically semantic HTML. It takes two to three weeks to reach working proficiency. It is the fastest of the three foundational technologies to learn, and it makes the subsequent CSS and JavaScript phases significantly easier because you already understand how browsers structure documents.

Is React still worth learning in 2026?
Yes. React holds 44.7% adoption among professional developers per the Stack Overflow Developer Survey 2025, has the most job postings of any frontend framework, and the most mature ecosystem. Vue and Svelte are worth exploring after React proficiency, but React is the correct first framework for a frontend development beginner optimizing for employability.

How long does it take to learn frontend development?
At 2-3 hours of daily practice, most learners reach job-readiness in 8-10 months following the four-phase roadmap above. This assumes building real projects at each phase rather than only watching tutorials. The learners who take 18-24 months are almost always spending more time consuming content than building things.

Do I need to learn TypeScript as a frontend developer?
TypeScript is not required to get a frontend development job, but it significantly improves your candidacy. TypeScript has reached 44% developer adoption and is standard at most companies building production React applications. Learn it in Phase 4 after you are comfortable with JavaScript and React. Adding TypeScript before those fundamentals are solid adds friction without payoff.

What is the difference between frontend and full stack development?
Frontend development focuses on what users see and interact with: HTML, CSS, JavaScript, and frameworks like React. Full stack development adds backend skills: server-side languages, databases, APIs, and deployment infrastructure. Most frontend developer roles in 2026 expect some familiarity with APIs and version control, but dedicated full stack skills are a separate learning track that typically requires another 6-12 months of study after frontend proficiency is established.

Top 10 AI Tools for DevOps in 2026 (Ranked by Real Impact)

Introduction

90% of software professionals now use AI tools at work. That is the headline from Google’s 2025 DORA State of AI-Assisted Software Development report, which surveyed nearly 5,000 IT professionals. The harder truth sits in the same data: most teams using AI tools for DevOps are not seeing system-level improvement yet.

ai tools for devops

Here is what the DORA report found: a 25% increase in AI adoption correlated with a 1.5% decrease in throughput and a 7.2% decrease in stability for teams that lacked mature delivery foundations. AI tools for DevOps amplify what is already working. They do not fix broken pipelines.

This guide is not a vendor catalog. It ranks the top 10 AI tools for DevOps in 2026 by the specific pipeline problem they solve, the DORA metrics they move, and what you need in place before they will work.

Why AI Tools for DevOps Matter in 2026

ai tools for devops

The cost of inaction is now measurable at the board level. Teams with mature pipelines and AI tools in place report 62% improvement in deployment frequency and 48% reduction in change failure rates, per Global Growth Insights 2026 research.

The reason most organizations are investing in AI tools for DevOps is not innovation. It is operational survival. Alert fatigue is burning out senior engineers. Manual code review bottlenecks are throttling deployment frequency. Security scanning is lagging behind deployment velocity. AI tools for DevOps address each of these pressure points when applied to the right layer.

The Productivity Gap Between Teams Using and Not Using AI DevOps Tools

Developers using AI coding assistance complete tasks 55% faster, per GitHub Copilot research. But individual task speed is only one metric. Faros AI’s 2026 telemetry across 22,000 developers found that epics completed per developer were up 66.2%, meaning AI is now moving roadmaps, not just individual ticket counts.

The risk: the same data shows median time in PR review is up 441% and 31% more PRs are merging with no review at all. Faster code generation without equivalent investment in review automation creates a quality trap. The top AI tools for DevOps solve for both sides of this equation.

Top 10 AI Tools for DevOps in 2026

1. GitHub Copilot: AI Code Generation and Security Autofix

GitHub Copilot is the most widely deployed AI tool in the DevOps stack in 2026. It operates inside the IDE, suggesting code based on the context already open. Beyond code generation, Copilot’s security autofix feature identifies vulnerabilities at the point of code creation and proposes fixes inline before the code ever reaches a pipeline.

Best for: teams where the primary bottleneck is code generation speed and where developers are spending significant time on repetitive scaffolding. The 55% task completion improvement applies most consistently to mid-level engineers on familiar codebases.

2. Harness: AI-Powered Deployment Automation

Harness applies machine learning across the CI/CD pipeline to identify failure patterns, predict rollback risks, and automate deployment verification. Its AI engine correlates deployment events with monitoring signals in real time, which is why teams using Harness report 30 to 50% faster deployment frequency after adoption.

Best for: engineering organizations running multiple microservices across cloud environments where manual deployment verification is a consistent bottleneck.

3. Dynatrace: Davis AI for Full-Stack Observability

Dynatrace’s Davis AI engine automates root cause analysis across the full stack. When an incident fires, Davis identifies the causal chain within seconds rather than requiring an SRE to manually correlate logs, traces, and metrics. This is the core value proposition for teams where MTTR (now called Failed Deployment Recovery Time in DORA’s updated framework) is the primary metric they need to move.

Best for: organizations running complex distributed systems where alert correlation is manual today and incident bridge calls routinely run 90 minutes or more before root cause is identified.

4. Datadog: Watchdog AI for Anomaly Detection

Datadog Watchdog continuously scans infrastructure and application metrics for anomalies without requiring manual threshold configuration. It surfaces unusual patterns before they become user-facing incidents, reducing alert fatigue by eliminating the noise of static threshold alerts.

Best for: teams that have instrumented their stack but are drowning in alerts. Watchdog’s value is proportional to the quality and coverage of your existing instrumentation.

5. Snyk: DevSecOps AI for Vulnerability Scanning

Snyk integrates security scanning directly into the developer workflow, catching vulnerabilities in code, open-source dependencies, containers, and infrastructure-as-code before they reach production. Its AI prioritizes findings by exploitability, which reduces the security backlog that blocks deployment pipelines in regulated environments.

Best for: organizations where security review is a deployment bottleneck or where the change failure rate is elevated by security issues discovered late in the cycle.

6. Amazon Q Developer: AI Assistant for AWS Workflows

Amazon Q Developer provides AI assistance across the AWS development lifecycle, from code generation in the IDE to infrastructure recommendations in the AWS console. For teams heavily invested in AWS, it reduces the context-switching cost of navigating between development tools and cloud management.

Best for: AWS-native teams whose developers spend significant time context-switching between the IDE and cloud configuration.

7. Spacelift: AI-Driven Infrastructure as Code Pipeline Management

Spacelift adds intelligence to IaC workflows across Terraform, Pulumi, and CloudFormation. Its AI engine detects drift, recommends policy enforcement, and automates approval workflows for infrastructure changes. In 2026, 60% of organizations using AI in development deliver projects faster and with fewer defects, per Spacelift’s own DevOps statistics research.

Best for: platform engineering teams managing multi-cloud infrastructure where IaC pipeline governance is manual and inconsistent.

8. KaneAI (TestMu): GenAI-Native Testing Agent

KaneAI is a generative AI-native testing agent that writes, maintains, and executes tests from natural language descriptions. It reduces the manual test authoring bottleneck that slows deployment frequency in teams with large regression suites.

Best for: engineering teams where test maintenance is consuming more than 20% of developer time and where the regression suite has become a deployment gate rather than a quality signal.

9. Metoro: AI SRE for Kubernetes Incident Response

Metoro acts as an AI-powered site reliability engineer for Kubernetes environments. It monitors cluster health, auto-diagnoses degradations, and walks engineers through remediation steps in plain language. For teams without dedicated SREs, Metoro provides incident response capability that would otherwise require senior talent.

Best for: teams running production workloads on Kubernetes without a full SRE function or where on-call rotation is causing burnout due to the complexity of manual incident triage.

10. LinearB: AI DORA Metrics and Delivery Intelligence

LinearB connects engineering activity data to business outcomes through DORA metrics, cycle time analysis, and delivery intelligence. Its AI layer surfaces where work stalls, which teams are at capacity, and where process changes would have the highest impact on deployment frequency and lead time.

Best for: engineering leaders who need data to justify investment in DevOps improvements and who want to close the gap between individual productivity and system-level delivery performance.

AI DevOps Tools Compared by Use Case

ai tools for devops

ToolPrimary CategoryKey DORA MetricBest For
GitHub CopilotCode GenerationLead Time for ChangesFaster coding, security autofix
HarnessCI/CD AutomationDeployment FrequencyPipeline ML, rollback prediction
Dynatrace Davis AIObservabilityFailed Deployment RecoveryRoot cause analysis automation
Datadog WatchdogMonitoringChange Failure RateAnomaly detection, alert reduction
SnykDevSecOpsChange Failure RateShift-left security scanning
Amazon Q DeveloperCloud DevLead Time for ChangesAWS-native workflow assistance
SpaceliftIaC ManagementDeployment FrequencyInfrastructure pipeline governance
KaneAITestingChange Failure RateAI-native test generation
MetoroIncident ResponseFailed Deployment RecoveryKubernetes SRE automation
LinearBDelivery IntelligenceAll 4 DORA MetricsMetrics, bottleneck analysis

What to Do Before Buying Any AI DevOps Tool

ai tools for devops

DORA’s 2024 research is unambiguous: only 16.2% of teams deploy on demand, and 9.4% achieve sub-one-hour lead time. AI tools for DevOps will not move those numbers without foundational practices already in place.

Before adding AI tooling to your stack, confirm three things are working: your team tracks DORA metrics today and knows your baseline, your continuous integration pipeline catches failures before they reach production, and your on-call process has clear escalation paths that engineers actually follow.

Without those three foundations, AI tools for DevOps accelerate dysfunction as reliably as they accelerate high performance.

Why Tibicle Is the Right Engineering Partner for AI DevOps Implementation

Knowing which AI tools for DevOps to buy is the easier problem. Integrating them into a pipeline that actually improves DORA metrics is where most teams stall. Tibicle’s DevOps and AI/ML integration practice is built specifically for this gap.

Their team has hands-on experience with CI/CD pipeline design, cloud infrastructure, and AI integration across AWS, Azure, and Google Cloud. They work with startups scaling their first production systems and enterprises dealing with the multi-cloud complexity that kills deployment frequency. The sprint-based delivery model Tibicle runs weekly reviews, clear escalation paths, documented handoffs is the same operational discipline that DORA research identifies as a prerequisite for AI tooling to work.

One client on Clutch reported a 60% reduction in manual ticket creation within one month of Tibicle delivering an AI-powered application. That outcome AI tooling driving measurable operational improvement inside a defined timeline is what the DORA data says most teams are not getting. Tibicle’s background in building custom AI workflows, combined with their DevOps implementation experience, positions them to help teams clear the foundational work that makes AI tools for DevOps worth adopting.

Tibicle’s rates start at $25–$49/hour, which matters for organizations evaluating whether to build internal DevOps AI capability or bring in an external team to implement and configure the tooling before handing it off.

Conclusion

AI tools for DevOps amplify what is already working. The 10 tools ranked in this guide each address a specific pipeline problem  and each requires the right foundational practices to deliver on its metrics. Getting from the current state to a pipeline where AI tooling is generating real DORA improvement takes engineering investment, not just a software subscription.

If your team needs help implementing AI DevOps tools or building the CI/CD and cloud infrastructure foundation they require, Tibicle’s engineering team is available for dedicated engagements and team augmentation. Reach out to get a technical assessment of where your pipeline is today and what it needs to get to the next level.

Frequently Asked Questions

What are AI tools for DevOps?
AI tools for DevOps are systems that apply machine learning and generative AI at specific points in the software delivery lifecycle to reduce manual effort, catch failure patterns earlier, and surface actionable insights from delivery data. They cover code generation, CI/CD pipeline optimization, observability, security scanning, and incident response automation.

Does AI replace DevOps engineers?
No. DORA’s data is clear: AI tools for DevOps improve individual productivity but do not eliminate the need for human judgment, especially in incident response and architecture decisions. What AI does replace is repetitive manual work like threshold-based alerting, standard code scaffolding, and routine test maintenance.

Which AI tool is best for CI/CD pipeline optimization?
Harness is the strongest option for teams whose primary bottleneck is deployment frequency and rollback risk. For teams where code review speed is the constraint, GitHub Copilot paired with LinearB’s delivery intelligence provides the most complete picture of where the pipeline is actually stalling.

How does Dynatrace Davis AI work?
Davis AI continuously models normal behavior across an organization’s full stack using a topological dependency map. When a degradation occurs, it traverses the dependency graph to identify the root cause rather than presenting raw alerts for an engineer to correlate manually. It produces a ranked list of probable root causes with supporting evidence.

What is AIOps and how does it differ from traditional monitoring?
AIOps is the application of AI to IT operations, specifically observability, event correlation, and incident response. Traditional monitoring requires engineers to configure static thresholds and manually correlate alerts across tools when something breaks. AIOps platforms like Dynatrace and Datadog automate that correlation, learn what normal looks like without manual configuration, and surface the probable root cause before the on-call engineer joins the incident bridge.

Top IoT Development Companies in India 2026

Introduction

India’s industrial IoT market is projected to reach $30.35 billion by 2034, growing at a CAGR of 12.90%. The global IoT market is projected to reach $1.3 trillion in 2026, and Indian vendors are competing for a major share of that opportunity. Yet the real problem for buyers isn’t finding a list. It’s that most lists of IoT development companies in India are recycled without evaluation criteria, vague on technical depth, and light on the kind of detail that informs a C-level vendor decision.

IoT development companies in India

This guide ranks, compares, and stress-tests the top vendors so decision-makers can short-list faster. It breaks down what separates serious IoT development companies from those that can only build dashboards.

What IoT Development Companies in India Actually Do

IoT development companies in India

Beyond App Development The Full Stack Explained

Most buyers arrive at vendor conversations thinking “IoT” means a mobile app that talks to a device. The reality is considerably more layered. A genuine full-stack IoT vendor operates across three distinct layers: the hardware and firmware layer, the software application layer, and the cloud orchestration layer. Conflating any of these with the others leads to misaligned expectations, budget overruns, and failed deployments.

What a full-stack IoT engagement actually covers:

  • Device connectivity and firmware writing the low-level code that runs on the hardware itself, managing protocols, power efficiency, and sensor interfacing
  • Cloud infrastructure deploying and managing cloud platforms like AWS IoT Core or Azure IoT Hub, including ingestion pipelines, device registries, and security configurations
  • Real-time analytics pipelines stream data processing that turns raw sensor output into actionable signals with sub-second latency
  • Device lifecycle and OTA updates pushing firmware updates to deployed hardware at scale, without physical access, a capability many vendors simply don’t have
  • ERP and CRM system integration connecting IoT data to existing enterprise systems, so operational insights translate into business action

What Separates a Serious IoT Vendor from a Dashboard Builder

The dashboard builder problem is pervasive. Many software companies have packaged their web development capabilities under an “IoT” label and can build a competent frontend visualization. What they cannot do is the hard, foundational work that determines whether a deployment actually works at scale.

Before onboarding any vendor, ask these questions directly:

  • Do they handle edge computing, or only cloud-side logic? Edge-capable vendors can process data locally on the device, reducing latency and cloud costs significantly.
  • Can they support the MQTT protocol natively? MQTT is the industry-standard lightweight messaging protocol for IoT vendors who can’t answer this fluently are typically app-only.
  • Do they have post-deployment firmware update capability? Without OTA update architecture built into the project from the start, every hardware fix requires a field visit.

The answers will immediately stratify your vendor list.

Top IoT Development Companies in India in 2026

Each company below is evaluated on stack depth, industry vertical coverage, and delivery track record, not marketing copy.

Tata Consultancy Services (TCS) Enterprise IoT at Scale

Specialization: End-to-end IoT platforms for Fortune 500 enterprises, with deep investment in connected device management and IIoT platform development. TCS brings certified partnerships with AWS, Microsoft Azure, and Google Cloud IoT to every engagement.

Best for: Large enterprises in manufacturing, utilities, and smart city solutions requiring multi-device, multi-network ecosystems with full compliance documentation.

Key strength: Breadth of vertical coverage and the engineering bench depth to support long-horizon deployments. Their IoT labs in Pune and Chennai have dedicated embedded systems teams, not just cloud engineers.

Infosys AIoT and Predictive Analytics Focus

Specialization: IoT integrated with AI and ML, with a particular emphasis on predictive maintenance and real-time analytics for industrial operations.

Best for: Enterprises running analytics-heavy use cases where the IoT layer feeds AI models for operational intelligence, not just monitoring, but forecasting and autonomous decision-making.

Key strength: Infosys Engineering Services has produced documented outcomes in manufacturing throughput improvement through sensor-driven analytics pipelines. Their edge computing capability is mature and production-tested.

Wipro Industrial IoT and Connected Manufacturing

Specialization: Industrial IoT platforms with a strong focus on manufacturing and logistics verticals. Wipro’s HOLMES platform integrates IoT data with cognitive automation.

Best for: Manufacturing operations seeking to connect legacy OT (operational technology) environments with modern IT infrastructure, a notoriously complex integration challenge.

Key strength: Deep experience bridging the OT/IT gap, including protocol translation and firmware development for equipment that predates modern connectivity standards.

HCLTech Connected Product Engineering

Specialization: Consumer IoT and connected product engineering, with proven capability in firmware development and UX integration from a single vendor.

Best for: Product companies building smart hardware connected appliances, wearables, and consumer electronics where the end-user experience is as important as the device performance.

Key strength: HCLTech’s IoT Works practice combines hardware engineering with UX design, reducing the vendor sprawl that typically plagues connected product development.

L&T Technology Services (LTTS)  Deep Embedded Systems Expertise

Specialization: Embedded systems and firmware for industrial and automotive IoT applications. LTTS brings genuine hardware-layer engineering that most software-first vendors lack.

Best for: Industrial IoT companies in energy, automotive, and utilities where firmware reliability and safety compliance are non-negotiable requirements.

Key strength: Unlike most Indian IT vendors, LTTS started from an engineering rather than software services background. Their embedded systems practice is among the deepest in the country.

Persistent Systems  Mid-Market IoT with Cloud-Native Architecture

Specialization: Cloud-native IoT development with a focus on mid-market enterprises that need enterprise-grade architecture without enterprise-scale budgets.

Best for: Growing companies in healthcare, retail, and logistics seeking IoT solutions providers in India with modern DevOps practices and cloud integration depth.

Key strength: Persistent’s product engineering DNA means they build for scale from day one, not as an afterthought. Their MQTT protocol and edge computing implementations are production-hardened.

Happiest Minds Security-First IoT Development

Specialization: IoT software development services with an explicit focus on security architecture a differentiator that matters increasingly as connected devices proliferate.

Best for: Regulated industries (healthcare, fintech, utilities) where device security, compliance, and audit readiness are tied to procurement requirements.

Key strength: Zero Trust architecture implementation and device authentication frameworks are core to their delivery model, not optional add-ons.

Tibicle LLP Cost-Efficient, Fast-to-Market IoT Development

Specialization: Full-stack IoT development services with a delivery model calibrated for speed and cost efficiency. Tibicle handles the firmware-to-cloud stack without the overhead structure of larger SI firms.

Best for: Mid-market enterprises and product startups that need IoT app development company India capabilities without enterprise-tier pricing or timelines.

Key strength: Tibicle’s differentiator is time-to-market compression. By keeping hardware, firmware, and cloud integration within a single delivery team, they eliminate the handoff delays that inflate timelines when these are split across vendors. Their pricing transparency across development, cloud infrastructure, and maintenance is uncommon in the market. See how Tibicle approaches IoT project scoping 

Cyient  Precision Engineering and Industrial IoT

Specialization: Industrial IoT and digital transformation for precision engineering verticals aerospace, defense, and industrial automation.

Best for: Organizations in regulated industrial sectors where engineering documentation, compliance, and safety validation are built into the delivery requirement.

Key strength: Strong background in embedded systems development for mission-critical applications, with certifications relevant to aerospace and defense procurement.

GAVS Technologies Predictive Maintenance and IIoT Platforms

Specialization: Industrial IoT platforms focused on predictive maintenance, asset performance management, and real-time production monitoring.

Best for: Manufacturing and energy companies looking to reduce unplanned downtime through sensor-driven predictive analytics.

Key strength: Their Zero Incident Framework (ZIF) for IT operations extends naturally into IIoT monitoring, giving operations teams a unified view of IT and OT environments.

Comparison Table IoT Development Companies in India 2026

CompanyCore StrengthIndustry VerticalDev ModelPricing Tier
TCSEnterprise IoT, multi-cloudManufacturing, Smart CitiesOffshore/HybridHigh
InfosysAIoT, predictive analyticsHealthcare, Logistics, ManufacturingHybridHigh
WiproIndustrial IoT, OT/IT integrationManufacturing, LogisticsOffshore/HybridHigh
HCLTechConnected product engineeringConsumer IoT, AutomotiveHybridHigh
L&T Technology ServicesEmbedded systems, firmwareIndustrial, Automotive, EnergyOffshoreMid–High
Persistent SystemsCloud-native IoT, DevOpsHealthcare, Retail, LogisticsOffshore/HybridMid
Happiest MindsSecurity-first IoTHealthcare, Fintech, UtilitiesHybridMid
Tibicle LLPFull-stack, fast time-to-marketManufacturing, Product Startups, LogisticsOffshoreLow–Mid
CyientPrecision engineering, embeddedAerospace, Defense, IndustrialOffshoreMid–High
GAVS TechnologiesPredictive maintenance, IIoTManufacturing, EnergyOffshoreMid

IoT Development Pricing in India: What to Budget in 2026

IoT development companies in India

What IoT Development Companies in India Charge: Hourly Rates vs. Global Markets

India-based IoT development companies offer significant cost arbitrage at the application and cloud layers. Senior IoT engineers in India typically bill at $40–$80 per hour, compared to $150–$250 per hour in the United States and Western Europe. That’s a 60–70% cost difference on the software and cloud layers.

The gap narrows at the firmware and embedded systems layer, where niche expertise commands a premium regardless of geography. Buyers should not assume the full India rate applies to specialized hardware engineering work.

Project-Level Pricing Benchmarks

Use these figures as order-of-magnitude guides, not fixed quotes. Every engagement varies based on integration complexity, security requirements, and device count:

  • Basic IoT application (BLE + single device): $20,000–$50,000
  • Smart home or Wi-Fi connected platform: $50,000–$90,000
  • Industrial IoT platform (fleet management, manufacturing): $120,000+
  • Enterprise IoT ecosystem (multi-network, AI integration, ERP integration): $500,000+
  • Ongoing cloud infrastructure costs for mid-size deployments: $2,000–$10,000 per month

Hidden Costs Buyers Consistently Miss

The upfront development quote is rarely the full cost of ownership. Three categories of cost are routinely underscoped:

Firmware maintenance runs at 10–15% of hardware investment annually. Every new device variant, regulatory change, or security patch requires firmware work.

Integration testing with legacy systems adds 20–30% to development timelines when connecting to existing ERP, SCADA, or CRM environments. This is almost always underestimated in initial scoping.

Compliance requirements  GDPR, HIPAA, and ISO 27001 add scope and budget that is non-negotiable in healthcare and fintech deployments. Vendors who don’t flag this in the initial proposal are leaving cost surprises for later.

A Forrester study found that companies underestimate IoT project costs by 40–60%. Factor that into your budget ceiling, not just your initial estimate.

Not sure which pricing tier fits your use case? Talk to Tibicle LLP for a scoping assessment, no sales call, no commitment.

ROI and Business Impact of Partnering with IoT Development Companies in India

Where IoT Development Companies in India Deliver Measurable ROI

The business case for IoT investment is well-documented at the operational level. Decision-makers building internal ROI cases can reference these benchmarks:

  • Predictive maintenance: Up to 45% reduction in unplanned downtime in manufacturing and utilities deployments
  • Real-time production monitoring: 30% throughput improvement documented in manufacturing IoT implementations
  • Fleet and logistics IoT: Consistent reductions in fuel costs and route inefficiency, with payback periods typically in the 12–24 month range

How to Build the Business Case Internally

Structure the ROI case across three buckets to align with how CFOs and board members evaluate capital investments:

Cost avoidance reduces downtime, fewer manual interventions, and lower field service costs. This is the most quantifiable bucket and often the fastest to demonstrate.

Revenue enablement, faster product releases driven by real-time operational data, new data-driven services built on top of IoT infrastructure, improved customer SLAs through predictive service.

Risk reduction, security posture improvement, compliance and audit readiness, and reduced liability from equipment failures or data breaches.

Typical IIoT deployments show payback periods of 12–36 months, with larger enterprise ecosystems toward the longer end of that range.

Build vs. Buy vs. Outsource A CFO-Level View

The build-in-house path is tempting for technology-forward organizations. The data argues against it. In-house IoT builds average 18–24 months to market, according to Particle research. The average enterprise IoT project spans 23+ vendors according to PTC data, creating coordination overhead that frequently kills momentum.

Outsourcing to a specialized IoT solutions provider compresses both the timeline and the vendor sprawl. The key is choosing a vendor with genuine full-stack capability hardware through the cloud rather than stitching together point solutions.

Risks and Challenges When Hiring IoT Development Companies in India

Technical Risks

Technical Risks Every Buyer Should Probe with IoT Development Companies in India

Vendors who skip firmware update architecture leave buyers with a critical operational gap. If OTA updates aren’t designed into the system from day one, every firmware change becomes a field service event.

Cloud lock-in from proprietary platforms creates long-term leverage for the vendor and cost exposure for the buyer. Insist on portability across cloud platforms as a contractual requirement.

Protocol-level competency gaps are widespread. Not every team that calls itself an IoT company understands MQTT, LoRaWAN, cellular versus BLE trade-offs, or the conditions under which each protocol fails. Probe this directly in vendor conversations.

Vendor Management Risks

Offshore IoT teams without dedicated project managers who understand both hardware and software create integration failures at the boundary between the two. The hardware-software handoff is where most IoT projects derail. It requires a project manager who can hold both sides accountable.

Integration testing is consistently underscoped. When done properly, it consumes roughly 30% of total project timelines. Vendors who quote less are either cutting corners or don’t know what they don’t know.

Security Risks

Zero Trust architecture is the 2026 standard for IoT deployments. Any vendor not implementing it by default is a liability, not just a risk. Every connected device is a potential attack surface.

Ask vendors specifically about device authentication mechanisms, data encryption in transit and at rest, and how they handle device revocation when hardware is compromised or decommissioned. Vague answers are disqualifying.

Vendor Selection Checklist for Choosing IoT Development Companies in India

Before signing a contract with any IoT development company in India, verify each of the following:

  • Full-stack capability confirmed the vendor handles hardware, firmware, cloud, and analytics, not just application development
  • Industry vertical experience matches your use case. Healthcare, manufacturing, and logistics are different disciplines with different compliance requirements
  • Security architecture is Zero Trust by default, not a bolt-on after initial development
  • OTA firmware update capability is built into the delivery model, not quoted as an optional scope
  • Cloud platform is portable, not locked into one vendor’s proprietary stack
  • The integration testing timeline is explicitly budgeted and not collapsed into development estimates
  • Post-deployment support SLA is documented with clear escalation paths and response commitments
  • Compliance certifications relevant to your industry, ISO 27001, HIPAA, and GDPR, are either held or explicitly scoped into the project
  • Pricing model is transparent across development, cloud infrastructure, and ongoing maintenance phases, not just the build phase

Vendors who push back on any of these items during due diligence are telling you something important.

Why Tibicle LLP Belongs on Your Shortlist for IoT Development

Technical Risks

Tibicle LLP occupies a specific and underserved position in the Indian IoT vendor landscape: full-stack delivery capability at mid-market pricing, without the overhead and minimums that come with the large SIs.

In the comparison table above, Tibicle sits at the Low–Mid pricing tier with full-stack capability, a combination most vendors can’t deliver. The typical trade-off is that full-stack vendors charge High-tier rates, while Low–Mid-tier vendors are app-only. Tibicle’s model avoids that trade-off through a leaner delivery structure and a team that covers firmware through the cloud without subcontracting the harder layers.

Against the checklist above: Tibicle builds OTA update architecture into projects from day one, implements Zero Trust security posture as a default rather than an optional scope item, and prices transparently across all three phases development, cloud, and maintenance. For enterprises and product companies in manufacturing and logistics where time-to-market compression matters, their delivery model is specifically calibrated for that outcome. See how Tibicle approaches IoT project scoping. 

Conclusion

India’s IoT development ecosystem in 2026 is deeper than most buyers realize. The gap between vendors is significant, but it lives at the firmware and integration layer, not the app layer. Any reasonably competent software shop can build a dashboard. Far fewer can handle embedded systems, OTA firmware updates, protocol-level connectivity, and enterprise system integration from a single delivery team.

Use the pricing benchmarks, risk checklist, and comparison table in this guide to short-list vendors aligned to your vertical and budget. The wrong vendor costs 40–60% more and 12+ months of additional timeline, based on how consistently these projects are underestimated.

Tibicle LLP offers a structured IoT scoping session to connect with their team to map your project scope and get a ballpark estimate within 72 hours.

Frequently Asked Questions

How much does IoT development cost in India in 2026?
Basic IoT apps start at $20,000. Industrial-grade platforms range from $120,000 to $500,000 or more. Indian IoT developers charge $40–$80 per hour compared to $150–$250 per hour in the US, a 60–70% cost advantage on the application and cloud layers.

What should I look for in an IoT development companies in India?
Confirm full-stack capability across hardware, firmware, cloud, and analytics. Verify Zero Trust security architecture, OTA firmware update support, and an integration testing budget that reflects the actual complexity of connecting to your existing systems. App-only vendors are not full IoT partners, regardless of how they market themselves.

How long does an IoT project take to complete in India?
Simple IoT apps typically take 2–3 months. Industrial IoT platforms run 6–9 months. Enterprise ecosystems that include AI integration and ERP connectivity typically run 12–18 months or longer, depending on the complexity of legacy system integration.

What is the difference between consumer IoT and industrial IoT development?
Consumer IoT prioritizes user experience and seamless device connectivity. Industrial IoT IIoT requires redundancy, safety compliance, integration with existing manufacturing or logistics infrastructure, and often involves legacy equipment that predates modern connectivity standards. The cost gap between a consumer IoT project and an IIoT platform is typically $100,000 or more.

How do I calculate ROI on an IoT project?
Use three buckets: cost avoidance (downtime reduction, fewer manual processes), revenue enablement (new data products, faster delivery), and risk reduction (security, compliance). IIoT deployments typically show payback periods of 12–36 months. Start with the cost avoidance bucket, it’s the most quantifiable and the fastest to demonstrate.

Why do IoT projects in India cost less than in the US or Europe?
Developer rates are 60–70% lower in India at the application and cloud layers. The cost difference narrows considerably for specialized firmware and embedded systems work, where niche expertise commands a premium regardless of geography. Buyers should budget India rates for software and cloud, but not assume those rates extend fully to hardware-layer engineering.

Top 10 FinTech App Development Companies in 2026

Introduction

The global fintech market is climbing fast, from $228.24 billion in 2024 to a projected $397.24 billion by 2029, and with over 7.16 billion smartphone users active in 2026 and 54% of mobile banking users logging in daily, the margin for a broken experience is essentially zero. One security gap, one failed transaction, and user trust evaporates overnight, which is exactly why choosing the right fintech app development companies is one of the most critical decisions you will make.

Fintech app development company

Yet most executives still shortlist fintech app development companies based on UI demos and portfolio decks, not compliance depth, architectural durability, or production track records. That is a costly mistake. In a regulated industry where a single security gap can trigger regulatory penalties and permanently damage user trust, vendor selection is a risk management decision as much as it is a product decision.

This guide ranks the top 10 fintech app development companies in 2026 across six criteria that actually determine build quality, regulatory fitness, and long-term ROI. Whether you are building a digital wallet MVP, a neobank app, or an enterprise lending platform, this guide is designed to help decision-makers move beyond surface-level comparisons.

What Makes a FinTech App Development Company Worth Hiring in 2026

The Six Criteria That Separate Infrastructure Engineers From App Studios

Fintech app development company

Not every software agency that claims fintech expertise is equipped to build in regulated environments. The gap between a mobile app studio and a true fintech mobile app development partner becomes visible the moment compliance review begins. Here are the six criteria that actually matter when evaluating a fintech app development company.

Regulated domain experience is the baseline. A vendor who has shipped in payments, lending, neobanking, or wealthtech understands the operational reality of building under regulatory constraints, not just the technical side of it.

KYC/AML integration depth separates vendors who have read the documentation from those who have shipped it in production. Ask specifically which providers they have integrated Sumsub, Onfido, Jumio, and in which markets.

Compliance framework knowledge is non-negotiable. PCI DSS certification, GDPR, RBI guidelines, and PSD2 are not optional checkboxes  they define the architecture. A vendor unfamiliar with these frameworks will expose your business to legal risk post-launch.

Production launch track record matters more than portfolio volume. A company with fifty case studies and three actual production launches in regulated verticals is a weaker choice than one with fifteen verified, live products.

Client retention rate is an underused signal. High retention tells you that the vendor’s engineering holds up after delivery, and that clients are not scrambling to find replacements six months after launch.

Scalability architecture, including multi-rail payment support (SWIFT, SEPA, UPI, A2A) and fault-tolerant backends, determines whether your product can grow without a full rebuild.

Why “Mobile-First” Vendors Often Fall Short for Enterprise FinTech

The fintech app development market is flooded with frontend-heavy agencies that have rebranded themselves as financial technology specialists. These vendors build attractive interfaces but struggle when the architecture needs to support ledger design, audit trails, real-time transaction logic, and regulatory reporting.

Mobile-first vendors without regtech solutions experience create fragile products that frequently fail compliance review. The cost of rebuilding a product that passed design approval but failed a PCI DSS audit is far higher than the cost of choosing the right vendor upfront. For enterprise-scale builds, this is not a hypothetical risk, it is a documented pattern.

Custom fintech software development requires a different engineering culture than standard mobile development. If your vendor cannot explain their approach to fault tolerance, data residency, or open banking platform integration, that is a red flag that should end the conversation.

Top 10 FinTech Mobile App Development Companies in 2026

1. DashDevs

Founded: 2016 | Team Size: 200+ | HQ: Kyiv, Ukraine (with global delivery)

Core Fintech Verticals: Payments, Crypto, Neobanking, Digital Wallets

Best Fit For: Growth-stage fintech businesses seeking end-to-end financial app development services

DashDevs has built a strong reputation specifically in the fintech mobile app development space, with deep experience across neobank app development, crypto infrastructure, and payment-integrated products. Their team brings genuine compliance depth, not borrowed credentials, which is reflected in their client retention numbers.

Standout Differentiator: Specialized exclusively in fintech, meaning every engineer on their team has worked within regulated environments. Their KYC/AML compliance integration experience spans multiple jurisdictions, which is critical for products targeting cross-border user bases.

Honest Consideration: Their minimum engagement starts around $50K, which may be above the threshold for very early pre-revenue startups still validating product-market fit.

2. Zoolatech

Founded: 2017 | Team Size: 300+ | HQ: Kyiv, Ukraine

Core Fintech Verticals: Banking, Fraud Detection, Capital Markets

Best Fit For: Mid-enterprise companies building sophisticated financial infrastructure

Zoolatech has grown into a credible financial app development services provider with notable strength in fraud detection systems and capital markets platforms. Their team has demonstrated ability to work within complex compliance environments, including GDPR and PSD2 frameworks, making them a strong consideration for European market builds.

Standout Differentiator: Strong emphasis on data security architecture and real-time fraud logic, two areas where many fintech app development companies fall significantly short.

Honest Consideration: Their engagement model is better suited to mid-enterprise clients. Startups looking for lean MVP delivery may find their process more structured than necessary at early stages.

3. DataArt

Founded: 1997 | Team Size: 1,200+ | HQ: New York, USA (global delivery centers)

Core Fintech Verticals: Insurance, Legacy Modernization, Capital Markets, Wealth Management

Best Fit For: Enterprise organizations modernizing legacy financial systems or building large-scale regulated platforms

DataArt is one of the most experienced names in custom fintech software development, with nearly three decades of work in regulated financial environments. Their scale allows them to staff complex, multi-year enterprise programs that smaller fintech app development companies simply cannot support.

Standout Differentiator: Depth in legacy modernization. DataArt understands how to integrate new digital banking infrastructure with aging core systems, a challenge that most mobile-first vendors are completely unprepared for.

Honest Consideration: Their minimum engagement floor is $100K+, and their delivery model is optimized for enterprise clients. Startups and SMBs will likely find a better fit and cost efficiency elsewhere.

4. Netguru

Founded: 2008 | Team Size: 700+ | HQ: Poznań, Poland

Core Fintech Verticals: Digital Banking, Insurance, Payments

Best Fit For: Mid-market companies seeking a blend of design maturity and financial app development services

Netguru has established itself as one of the stronger European fintech mobile app development companies, with a product design culture that complements solid engineering. They have shipped verified products for regulated financial clients and bring meaningful experience with GDPR and PSD2 compliance.

Standout Differentiator: Strong product design capability combined with technical delivery is useful for teams that need both UX quality and compliance-aware engineering from a single vendor.

Honest Consideration: Compliance depth is medium-high rather than best-in-class. For highly regulated verticals like crypto infrastructure or cross-border payment gateway API builds, more specialized vendors may be a stronger fit.

5. 10Pearls

Founded: 2004 | Team Size: 1,000+ | HQ: Washington D.C., USA

Core Fintech Verticals: AI-driven fintech, Machine Learning, Custom Fintech Software Development

Best Fit For: Enterprise companies integrating AI and ML into financial products

10Pearls brings over two decades of technology delivery experience to the fintech app development space, with a growing emphasis on AI and machine learning integration within financial platforms. Their compliance depth is high, and their team size allows them to resource large, complex builds.

Standout Differentiator: Strong capability in AI-powered financial services fraud detection, predictive analytics, and personalization layers built on top of regulated fintech infrastructure.

Honest Consideration: Their enterprise focus and minimum engagements around $50K+ mean they are not positioned for small MVP builds. Best suited for organizations with defined product specs and dedicated product owners.

6. Itexus

Founded: 2013 | Team Size: 200+ | HQ: Minsk, Belarus (with US presence)

Core Fintech Verticals: Lending, Banking, Payments

Best Fit For: Startups and mid-market companies building lending or banking products

Itexus has built a consistent track record in lending platform development and mobile banking app development, with a client base that spans early-stage startups through to growing mid-market fintechs. Their rate structure is accessible without sacrificing compliance awareness.

Standout Differentiator: Solid experience in lending infrastructure, loan origination, underwriting workflows, and borrower-facing mobile experiences, an area where many general fintech app development companies lack depth.

Honest Consideration: Compliance depth is medium-high. For highly complex regulatory environments, particularly those involving multi-jurisdictional KYC/AML compliance integration, additional compliance consulting may be needed alongside their engineering work.

7. ClarionTech

Founded: 2000 | Team Size: 400+ | HQ: India

Core Fintech Verticals: Managed Development, Fintech Staff Augmentation, Custom Financial Software

Best Fit For: SMBs seeking cost-efficient fintech development capacity with staff augmentation flexibility

ClarionTech offers a broad range of financial app development services with a model well-suited to SMBs that need flexible team structures rather than fixed-price project delivery. Their two-decade track record gives them process maturity that many newer agencies lack.

Standout Differentiator: Staff augmentation model allows clients to embed ClarionTech engineers directly into internal teams useful for companies building internal fintech capability without full in-house hiring.

Honest Consideration: Compliance depth is medium compared to more specialized fintech mobile app development companies on this list. Not the first choice for highly regulated builds requiring deep PCI DSS certification or regtech solutions experience.

8. Brainhub

Founded: 2015 | Team Size: 50+ | HQ: Gliwice, Poland

Core Fintech Verticals: Regtech, EU Fintech, Compliance-Driven Products

Best Fit For: EU-focused fintech businesses where PSD2, GDPR, and open banking platform compliance are central to the build

Brainhub is a smaller but technically focused fintech app development company with genuine strength in European regulatory compliance. Their size means they work selectively, but clients who fit their model benefit from direct engineering access and high compliance alignment.

Standout Differentiator: Best-in-class EU compliance depth for their size. PSD2 and GDPR are not treated as secondary concerns they are built into the architecture from day one. Strong fit for open banking platform development.

Honest Consideration: Team size of 50+ means they are not suited for large-scale enterprise programs requiring significant parallel workstreams. Best engaged for focused, well-scoped builds.

9. HQSoftware

Team Size: Undisclosed | HQ: Estonia (with global delivery)

Core Fintech Verticals: Banking, Insurance

Best Fit For: Startups and early-stage companies exploring financial app development services

HQSoftware offers financial app development services with a reasonable entry point for startups, covering banking and insurance product development. Their Estonia base gives them proximity to EU regulatory thinking, which is useful for teams targeting European markets.

Standout Differentiator: Accessible minimum engagement around $30K, making them a viable option for early-stage startups that need regulated product delivery without enterprise-scale pricing.

Honest Consideration: Compliance depth is medium. Public information on their fintech-specific production launches is limited, which makes independent verification of their track record more difficult than with other vendors on this list.

10. Tibicle LLP

Core Fintech Verticals: Custom Fintech Software Development, Mobile Banking, Digital Wallets, Payment-Integrated Apps

Best Fit For: Startups and growth-stage businesses in Indian and Southeast Asian markets, building compliance-aware fintech products

Tibicle LLP rounds out this list as a custom fintech software development partner specifically positioned for businesses that need compliance-aware engineering without enterprise-level minimum engagements. Their focus on Indian and Southeast Asian markets brings practical knowledge of RBI guidelines and UPI-integrated payment architecture, regulatory and technical contexts that many Western vendors handle poorly.

Standout Differentiator: Tibicle combines custom fintech software development with product-stage consulting from day one. Rather than waiting for a post-MVP review to surface architectural problems, their team embeds compliance and scalability thinking at the scoping stage, reducing costly rework in later phases. For digital wallet development, lending frontends, and payment gateway API integration, this matters significantly.

Honest Consideration: Tibicle is best suited to startups and SMBs, not large-scale enterprise programs. Enterprises requiring global multi-jurisdictional delivery at scale will find better fit with DataArt or 10Pearls.

Side-by-Side Comparison: Top FinTech App Development Companies

CompanyFoundedTeam SizeCore VerticalsCompliance DepthMin. EngagementBest Fit
DashDevs2016200+Payments, Crypto, NeobankHigh$50K+Growth-stage
Zoolatech2017300+Banking, Fraud,High$50K+Mid-enterprise
DataArt19971,200+Insurance, Legacy ModernizationVery High$100K+Enterprise
Netguru2008700+Digital Banking, InsuranceMedium-High$40K+Mid-market
10Pearls20041,000+AI, ML, Custom FintechHigh$50K+Enterprise
Itexus2013200+Lending, Banking, PaymentsMedium-High$30K+Startup-Mid
ClarionTech2000400+Managed Dev, Fintech Staff AugMedium$25K+SMB
Brainhub201550+Regtech, EU FintechHigh (EU)$40K+EU-focused
HQSoftware2001100+Banking, InsuranceMedium$30K+Startup
Tibicle LLP202150+Custom Fintech, MobileMedium$30K+Startup-SMB

How to use this table: Start by filtering on compliance depth relative to your product’s regulatory requirements. Then filter by minimum engagement relative to your current build stage and budget. A vendor with very high compliance depth at a $100K+ minimum is the wrong choice for a $60K MVP  and a vendor with a medium compliance rating is the wrong choice for a licensed neobank application.

Evaluating a shortlist? Get a structured vendor scorecard built for your specific fintech use case. Talk to Tibicle’s fintech team 

How Much Does FinTech App Development Actually Cost in 2026?

Actually Cost

Cost Tiers by Build Stage

One of the most persistent problems in fintech app development planning is budgeting without understanding what the money actually covers. Here is a realistic breakdown by build stage.

Regulated MVP: $50K–$120K | Timeline: 2–4 months. This covers core product functionality with essential compliance integrations, KYC/AML, basic audit trails, and payment gateway API connectivity. Anything below $50K in a regulated fintech context should be approached with significant skepticism.

Mid-Scale Platform (Payments, Lending): $80K–$250K | Timeline: 4–8 months. At this tier, you are building multi-rail payment support, more sophisticated lending logic, and stronger backend infrastructure for transaction volume.

Enterprise Platform: $250K–$1M+ | Timeline: 9–18 months. This covers full embedded finance infrastructure, extensive compliance architecture, multi-jurisdictional regulatory alignment, and the engineering depth required for a licensed financial institution.

What Executives Get Wrong About FinTech Development Budgets

The most common budgeting mistake is treating the development quote as the total cost. It is not.

KYC/AML compliance integration and security architecture alone can consume up to 40% of your total development spend before a single UI screen is built. Post-launch maintenance adds $30K–$100K+ annually, covering API fees, compliance audits, and infrastructure costs. Compliance updates triggered by changes to GDPR, PCI DSS certification requirements, or local regulatory frameworks can increase annual budget by 10–20% in any given year.

SOC 2 certification alone ranges from $10K to $100K depending on scope and auditor. A vendor quote significantly below market rates, particularly for regulated mobile banking app development, almost always means security hardening, QA depth, and operations tooling were excluded from scope.

Offshore vs. Nearshore vs. In-House: Where the Numbers Land

The ROI case for outsourcing fintech mobile app development to qualified offshore or nearshore teams is strong when the vendor selection is done correctly. Outsourcing saves 40–60% compared to full in-house builds when accounting for full employment costs, not just salary.

A senior developer hired in-house in the US costs $160K–$220K per year in salary alone, before benefits, equipment, and management overhead. By comparison, senior fintech engineers in Eastern Europe and India range from $25–$49 per hour based on Clutch 2026 benchmarks, representing material savings at equivalent technical quality when the vendor has genuine regulated domain experience.

ROI and Business Impact of Choosing the Right FinTech App Development Partner

Where ROI Is Realized and Where It Is Lost

The right fintech app development company does not just deliver a product on time ,it determines how quickly you reach regulatory approval, how cleanly you integrate with banking partners, and how long your architecture holds before needing a rebuild.

Wrong vendor choices lead to rework costs, delayed regulatory approval cycles, and failed bank partnerships. These are not soft risks they have hard cost implications that frequently exceed the original development budget. Choosing a vendor without documented regtech solutions experience is the single highest-risk decision in a fintech build.

The right vendor, by contrast, accelerates time-to-market by 2–3x through composable APIs and pre-certified compliance modules integrations with Plaid, Stripe, Fireblocks, and similar platforms that do not need to be built from scratch. Case data indicates that apps built using pre-certified compliance modules reduce regulatory onboarding time by 40–60%, which has a direct impact on the revenue timeline.

Given that 72% of digital wallet users transact daily, every week of delay in reaching the market carries a measurable revenue impact. The cost of slow vendor selection compounds quickly in a daily-use financial product.

The Hidden Cost of a Failed Launch

A security breach in a fintech application does not just carry immediate regulatory penalties, it causes trust destruction that is extraordinarily difficult and expensive to reverse in financial services. In a market where deepfake fraud grew 1,100% in the United States in early 2025, biometric liveness detection is no longer optional for any product handling identity verification. Vendors without this embedded in their KYC/AML compliance integration practice are building products that are already behind the threat landscape.

Scope creep driven by poor vendor scoping practices inflates total project cost by 10–30% on average. This is not a project management problem  it is a vendor qualification problem. Companies with genuine custom fintech software development experience scope more accurately because they have built similar products before.

Risks and Challenges of Hiring a FinTech App Development Company

Risks and Challenges

Hiring the wrong fintech app development company carries risks that extend well beyond a delayed launch date. Understanding these risks before signing a contract is essential for any decision-maker evaluating financial app development services.

Shallow compliance experience is the most common and most costly risk. Vendors who treat PCI DSS certification, KYC/AML compliance integration, and GDPR as compliance checkboxes rather than architectural inputs will increase your time-to-launch and your legal exposure post-launch.

Regulatory drift is a risk that most executives underestimate. Compliance is not a one-time project deliverable, it is an ongoing operational requirement. Vendors who do not provide post-launch compliance support leave clients exposed to framework updates they are not equipped to address.

Vendor lock-in through proprietary stacks that cannot integrate with standard payment rails or open banking platforms is a structural problem that becomes catastrophic at scale. Ask every vendor explicitly whether their architecture supports standard API integrations or requires proprietary middleware.

QA scope underestimation in regulated products is extremely common. Every architectural change in a fintech product requires regression testing against compliance requirements, not just functional testing. Vendors who do not price this correctly will either cut corners or return to you with budget overruns.

Communication gaps in offshore engagements particularly around compliance review cycles can delay regulatory decisions by weeks. Evaluate every fintech mobile app development partner on their communication model, not just their technical portfolio.

Vendor Selection Checklist: What to Ask Before Signing a Contract

Use this checklist before moving any fintech app development company to the final shortlist stage.

  • Does the vendor have documented production launches in your specific fintech vertical, such as payments, lending, or neobanking?
  • Can they demonstrate KYC/AML compliance integration with named providers such as Sumsub, Onfido, or Jumio?
  • What compliance frameworks do their engineers actively work with PCI DSS, GDPR, RBI guidelines, and PSD2?
  • Do they support multi-rail payment architecture, including SWIFT, SEPA, A2A, and UPI?
  • What is their verified client retention rate?
  • How do they manage scope changes mid-development without disrupting compliance timelines?
  • Do they provide post-launch support covering audit trails, regulatory reporting, and compliance updates?
  • What is their minimum engagement size, and how does it align with your current build stage and budget?

No vendor should advance past this checklist without satisfactory, verifiable answers. Compliance depth and production track record are the two filters that eliminate the most risk per question.

Why Tibicle LLP Is Worth Considering for Custom FinTech App Development

Fintech app development company

Tibicle LLP is positioned for startups and growth-stage fintech businesses that need custom, compliance-aware fintech mobile app development without the minimum engagement floors that enterprise-oriented vendors require.

If the checklist above leads you to prioritize mobile-first architecture, lean delivery cycles, and direct access to engineering decision-makers rather than layered account management and project coordination overhead Tibicle is worth a direct conversation.

Their strongest use-case fit is in digital wallet development MVPs, lending frontends, and payment gateway API-integrated applications for Indian and Southeast Asian markets. The regulatory environment in these markets, including RBI guidelines, UPI infrastructure, and local data residency requirements, requires specific operational knowledge that vendors without regional delivery experience lack.

The differentiator that matters most for early-stage clients is Tibicle’s approach to product-stage consulting at the scoping phase. Most fintech app development companies begin architecture review after the contract is signed. Tibicle embeds compliance and scalability thinking at the point of scoping, which reduces the post-MVP rework that inflates total cost of ownership for startups in their first regulated product build.

Building a fintech MVP or evaluating your first mobile banking app development project? Tibicle’s team can scope your project in a 30-minute call. Book a free consultation.

Conclusion

The decision framework for selecting a fintech app development company in 2026 comes down to three filters applied in sequence: compliance depth first, production track record second, and cost tier alignment with your build stage third.

Portfolio volume, office locations, and design awards are not proxies for engineering durability in regulated environments. What determines your regulatory approval speed, security posture, and long-term scalability ceiling is the architectural and compliance culture of the team building your product, not the visual quality of their case study page.

The top 10 fintech mobile app development companies profiled in this guide represent the strongest options currently operating across different market segments, geographies, and budget tiers. Use the comparison table to filter by compliance depth and minimum engagement. Use the checklist to qualify your shortlist. And weight client retention and verified production launches more heavily than any other signal.

If you are evaluating fintech mobile app development partners for a 2026 build, Tibicle’s team can help you score your shortlist against what actually matters. Start here

Frequently Asked Questions

What should I look for in a fintech app development company?
Prioritize compliance expertise across PCI DSS, KYC/AML compliance integration, GDPR, and relevant local frameworks. Verify production launches specifically in your fintech vertical, not general software development experience. Evaluate client retention rate as a proxy for post-launch engineering quality, and confirm multi-rail payment support capability before shortlisting any vendor.

How much does it cost to build a fintech app in 2026?
Costs range from $50K for a regulated MVP to $300K or more for enterprise-scale platforms. KYC/AML and security architecture alone account for up to 40% of the total build budget. Post-launch maintenance, compliance audits, and framework update costs add $30K–$100K+ annually and should be factored into total cost of ownership from day one.

How long does fintech mobile app development take?
Regulated MVPs take 2–4 months. Mid-scale financial apps covering payments or lending run 4–8 months. Enterprise platforms typically require 9–18 months, with timelines driven primarily by regulatory approval cycles rather than development velocity.

Is outsourcing fintech development safe?
Yes, when the vendor has documented compliance experience and a verifiable production track record in your vertical. Outsourcing qualified fintech mobile app development to experienced teams in Eastern Europe or India saves 40–60% compared to full in-house builds, without compromising on compliance or engineering quality when vendor selection is done correctly.

What is the biggest risk of choosing the wrong fintech development partner?
Regulatory non-compliance, failed bank partnerships, and post-launch security vulnerabilities. These risks carry legal penalties, remediation costs that can exceed the original development budget, and long-term reputational damage in a trust-dependent industry. The cost of wrong vendor selection in fintech is rarely recoverable in the short term.

How do I evaluate a fintech app development company’s compliance depth?
Ask them to name the KYC/AML providers they have integrated in production, Sumsub, Onfido, Jumio, and the markets in which they operate. Ask specifically which regulatory frameworks their engineers have actively worked under: PCI DSS certification, GDPR, RBI guidelines, PSD2. Request case studies from verified, live regulated product launches, not conceptual work or internal tools.

How to Hire Dedicated Developers in India

Introduction

India has emerged as a global hub for software development, making it a top destination to Hire Dedicated Developers India. According to GitHub’s Octoverse 2026 report, India added over 5 million developers to the global talent pool and is projected to reach 57.5 million by 2030.

Hire Dedicated Developers India

At the same time, the Indian IT outsourcing industry is projected to reach $12.72 billion in 2026, reflecting strong and consistent global demand.

Hiring developers in India can be 60 to 70% cheaper compared to the US and Europe without compromising on quality. Cities like Bangalore, New Delhi, and Mumbai rank among the top startup ecosystems globally. Additionally, the IT outsourcing market in India is expected to grow at an annual rate of 12.42% between 2023 and 2027.

Why Businesses Hire Dedicated Developers in India in 2026

Hire Dedicated Developers India

Businesses continue to hire developers in India due to cost efficiency and access to a large, skilled talent pool across modern technologies.

The Cost Difference Is Still Significant

The cost advantage remains one of the biggest reasons companies choose to Hire Dedicated Developers in India:

  • Junior developers: $15 to $25 per hour
  • Mid-level developers: $30 to $50 per hour
  • Senior developers: $60 to $80 per hour

In comparison, US developers start at $100 per hour. Monthly retainers in India typically range from $1,500 to $6,000.

Depth of Talent Across Modern Tech Stacks

India offers a strong supply of developers skilled in React, Node.js, Flutter, Python, AI/ML, and cloud technologies.

Time zone flexibility allows businesses to run near 24/7 development cycles, which is another reason companies prefer hiring developers in India.

Hiring Models to Hire Dedicated Developers in India

Hire Dedicated Developers India

Choosing the right engagement model is essential when hiring developers in India, as it directly impacts flexibility and cost.

Dedicated Team Model

In this model, developers work exclusively on your project. It is best suited for long-term product development and ensures better collaboration and predictable billing.

Staff Augmentation vs Project-Based Engagement

  • Staff augmentation: Add developers to your existing team
  • Project-based model: Fixed scope with defined timelines

A hybrid approach combining both models can reduce total project costs by up to 25%.

Step-by-Step Process to Hire Dedicated Developers in India

Step-by-Step Process image

Start With a Clear Project Scope

Before hiring developers in India, define:

  • Features
  • Tech stack
  • Integrations
  • Timeline

A clear scope reduces confusion and avoids costly rework.

Where to Find Dedicated Developers in India

  • Freelance platforms: Upwork, Toptal, Freelancer
  • B2B platforms: Clutch, GoodFirms
  • Developer communities: GitHub, Stack Overflow

Businesses can also partner with companies like Tibicle to hire developers in India with faster onboarding, pre-vetted developers, and reliable technical screening.

How to Screen and Evaluate Candidates

  • Conduct coding tests
  • Review portfolios
  • Check tools like Slack, Jira, GitHub
  • Ensure time zone overlap

A structured evaluation process helps you successfully Hire Dedicated Developers India.

Real Costs to Hire Dedicated Developers in India in 2026

LevelHourly RateMonthly (Full-Time)
Junior$15 to $25$1,500 to $2,500
Mid-Level$30 to $50$2,500 to $4,000
Senior$60 to $80$4,000 to $6,000

Costs Businesses Often Overlook

When hiring developers in India, consider

  • Legal contracts and IP agreements
  • Collaboration tools and licenses
  • Onboarding time
  • Rising developer salaries

Mistakes to Avoid When Hiring Developers in India

Mistakes to Avoid

Avoid these common mistakes when you Hire Dedicated Developers India:

  • Choosing developers based only on low cost
  • Skipping contracts and legal agreements
  • Not defining milestone-based payments
  • Relying on freelancers for core products
  • Poor communication setup
  • Skipping trial tasks

Avoiding these ensures smoother collaboration and better results.

Conclusion

India offers a powerful combination of cost efficiency, scalability, and technical expertise, making it ideal to hire developers in India in 2026.

However, success depends on more than just cost. Businesses must:

  • Define clear requirements
  • Evaluate developers properly
  • Choose the right hiring model
  • Ensure strong contracts

Start by shortlisting agencies or posting a well-defined project to build your development team.

FAQs

How much does it cost to Hire Dedicated Developers in India?
The cost to hire dedicated developers in India ranges from $15 to $80 per hour. Monthly costs typically fall between $1,500 and $6,000, depending on experience and technology.

What is the best platform to Hire Dedicated Developers in India?
Clutch and GoodFirms are popular platforms for finding development agencies, while Upwork and Toptal are ideal for hiring freelance developers

How long does it take to onboard developers?
Hiring through agencies usually takes 2 to 6 weeks, whereas freelance developers can often be onboarded within a few days to one week

What tech stacks are Indian developers strongest in?
Indian developers are highly skilled in technologies like React, Node.js, Python, Flutter, AI/ML, and cloud platforms such as AWS and Azure.

Is the dedicated team model better than project-based hiring?
Yes, the dedicated team model is better for long-term projects as it provides more control, flexibility, scalability, and consistent collaboration.