
Best Restaurant Analytics Software to Grow Revenue in 2026

Jul 30, 2026

Read in 7 Minutes
Table of Contents
- What This Guide Covers
- Introduction
- What Does Restaurant Analytics Software Actually Do?
- The 5 Core Capabilities That Separate High-ROI Platforms from Dashboard Vendors
- The 5 Best Restaurant Analytics Software Platforms in 2026
- Side-by-Side Comparison: Restaurant Analytics Software in 2026
- Pricing Reality Check: What Restaurant Analytics Software Actually Costs at Scale
- ROI Benchmarks: What Operators Are Actually Getting Back
- Risks and Challenges Before You Commit to a Platform
- Vendor Selection Checklist: 9 Questions to Ask Before You Sign
- Why Tibicle LLP Is Worth Evaluating for Analytics-Adjacent Development
- Conclusion
- Frequently Asked Questions
What This Guide Covers
Who this is for:
Restaurant owners, multi-location restaurant groups, hospitality operators, finance leaders, and operations managers generating $2M+ in annual revenue who are actively evaluating restaurant analytics software to improve profitability, reduce food and labor costs, and gain real-time visibility into business performance across one or multiple locations.
Search intent:
Commercial investigation and vendor comparison. This guide is designed for restaurant operators who already understand the value of business analytics and are comparing restaurant analytics software platforms before investing. The focus is on evaluating pricing, integration capabilities, AI-powered insights, implementation complexity, total cost of ownership, and measurable ROI rather than on learning what analytics software is.
What you will walk away with:
A comprehensive comparison of the five best restaurant analytics software platforms in 2026, including their strengths, limitations, pricing models, POS integration capabilities, AI features, ROI benchmarks, implementation risks, hidden costs, and a practical nine-point vendor evaluation checklist. By the end of this guide, you’ll have a clear framework for selecting the platform that best aligns with your restaurant’s revenue stage, operational complexity, and long-term growth strategy.
Introduction
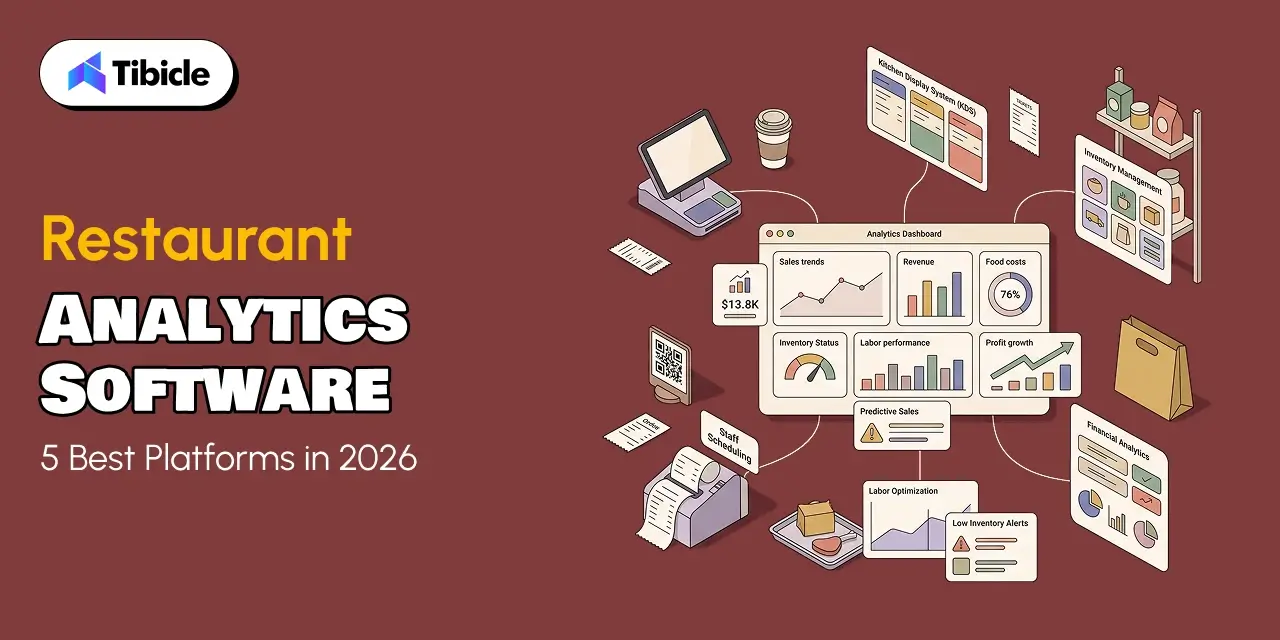
Restaurant analytics software exists because restaurant operators are running one of the lowest-margin businesses in any industry, with some of the highest operational complexity. Net margins sit at 3 to 5% industry-wide. Operators lose an estimated 4 to 8% of revenue annually to undetected food cost variances, poor labor allocation, and untapped sales data. That gap is not a kitchen problem. It is a visibility problem, and platforms that surface the right data at the right time are what close it.
This is not a software directory. It is a decision guide for operators at the $2M+ revenue stage who need to evaluate which platform will deliver measurable, auditable ROI and which will collect a monthly fee for dashboards nobody opens.
What follows is a structured breakdown of the five platforms that hold up under scrutiny in 2026, tested against pricing, integration depth, and real operator outcomes.
What Does Restaurant Analytics Software Actually Do?
The Core Function
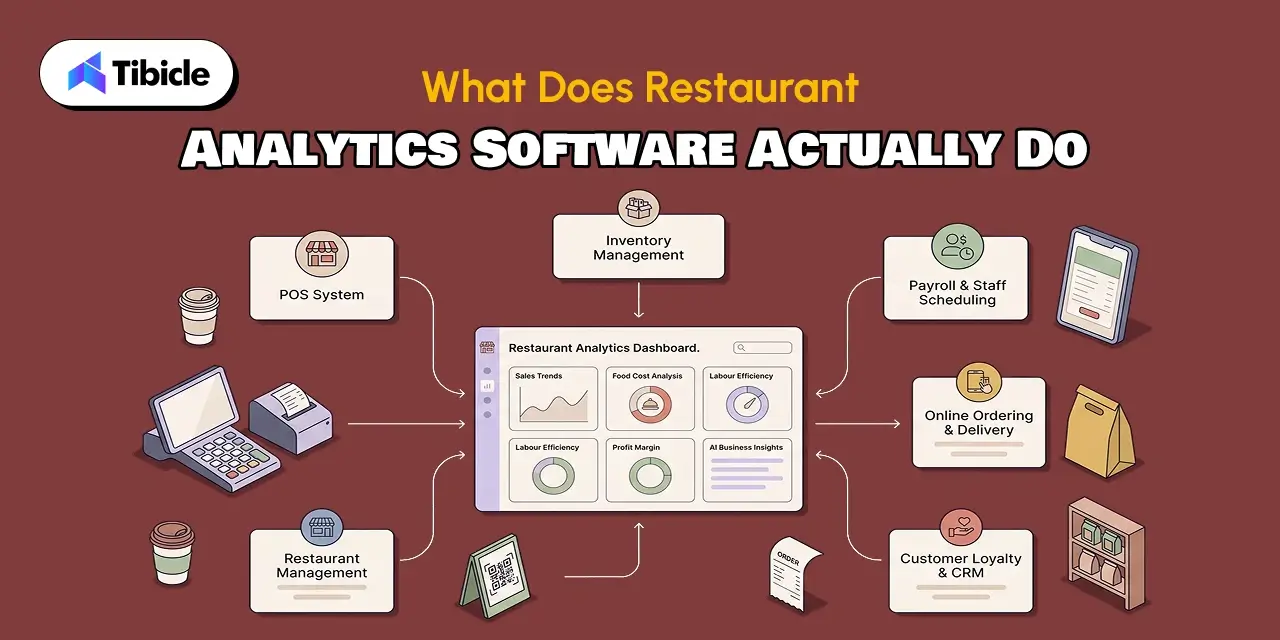
At its base, restaurant data analytics software aggregates POS, payroll, inventory, delivery, and loyalty data into a unified operational layer. Raw transaction volume becomes actionable signals: food cost variance by item, labor efficiency by shift, menu margin by cover. The distinction that matters most at the evaluation stage is between restaurant reporting software, which surfaces historical summaries, and restaurant business intelligence, which generates predictive, real-time alerts that give operators time to respond before the cost hits the P&L. Most operators shopping in this category need the latter and are often sold the former.
What It Cannot Do Alone
Analytics software does not replace operational discipline. A platform that surfaces a food cost variance alert produces zero ROI if no one has a protocol for acting on it. It also cannot compensate for fragmented POS ecosystems without clean integration; dirty source data produces misleading signals, which produce worse decisions than no data at all. The decision trigger is straightforward: if you are managing two or more locations and still reconciling data in spreadsheets, you have already crossed the threshold where analytics software pays for itself.
The 5 Core Capabilities That Separate High-ROI Platforms from Dashboard Vendors
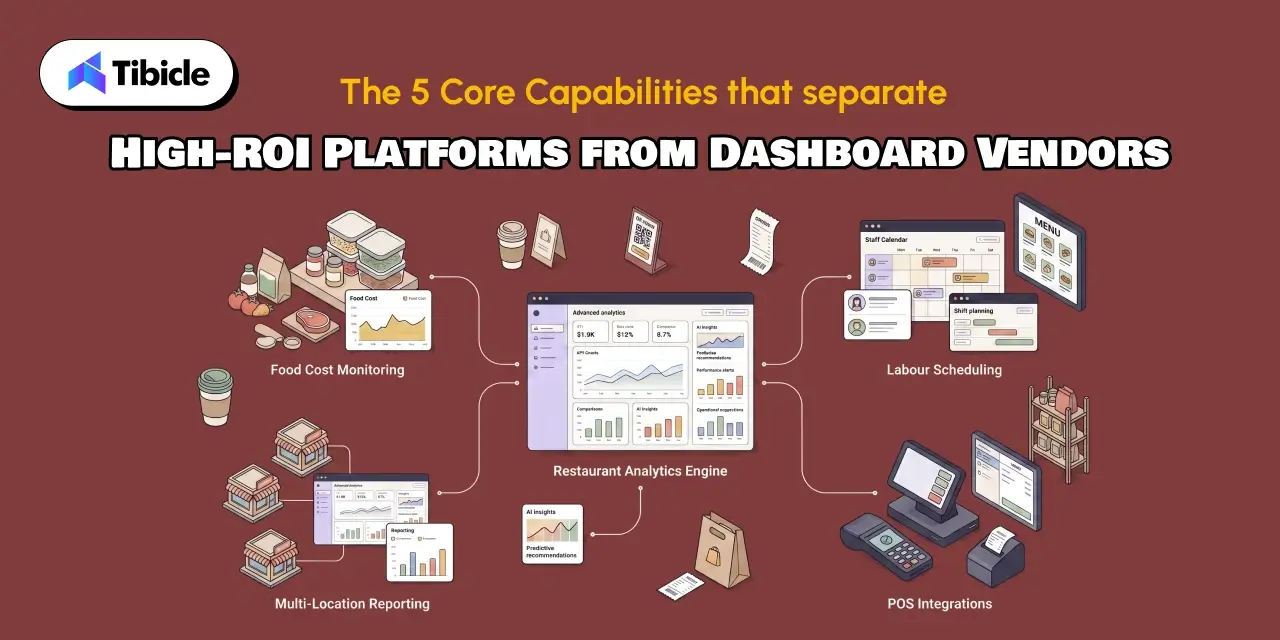
Before comparing platforms, operators need a clear evaluation framework. These five capabilities determine whether a platform moves the P&L or just adds visual complexity to data that was already available.
Real-Time Food Cost Tracking vs. Weekly Reconciliation
Platforms that surface food cost analytics daily versus monthly are not offering the same product. When food cost variance is caught within 24 hours, an operator can adjust purchasing, portioning, or waste protocols before the loss compounds. When it surfaces in a weekly reconciliation, the damage is already absorbed. A steakhouse that implemented real-time variance tracking cut discarded ribeye from 15 pounds per week to zero, saving $15,600 annually. The timing of the alert is as important as the accuracy of the data.
Labor Scheduling Intelligence
Labor cost optimization tied to cover counts and forecast demand, not historical averages, is the capability that separates scheduling tools from scheduling intelligence. The KPI that reveals whether a platform is delivering this: scheduled labor percentage versus actual labor percentage per shift. A platform that can’t show that gap in real time isn’t solving the problem.
Menu Engineering Data
Menu performance scoring by margin, volume, and attachment rate gives operators the item-level data needed to make pricing and placement decisions that compound over time. The critical distinction: what sells and what is profitable are rarely the same items. Platforms that show only sales volume leave operators optimizing for popularity instead of margin.
Multi-Location Consolidation
Multi-location restaurant management requires financial roll-up across units with location-level drill-down, not an average across the group that hides unit-level variance. Single-dashboard visibility is consistently the primary driver of analytics software adoption above three locations. Operators who have managed five-plus units with separate reporting systems understand exactly what that consolidation is worth.
POS and Third-Party Integration Depth
POS integration compatibility across Toast, Square, Clover, Lightspeed, and Revel, combined with delivery platform connections to DoorDash, Uber Eats, and direct ordering APIs, determines whether the platform can actually see your full revenue picture. A platform with strong analytics but weak integration produces a partial view, which produces partial decisions.
The 5 Best Restaurant Analytics Software Platforms in 2026
Each platform below is profiled on best-fit operator type, standout capability, key limitation, and pricing tier. The goal is a direct decision input, not a feature inventory.
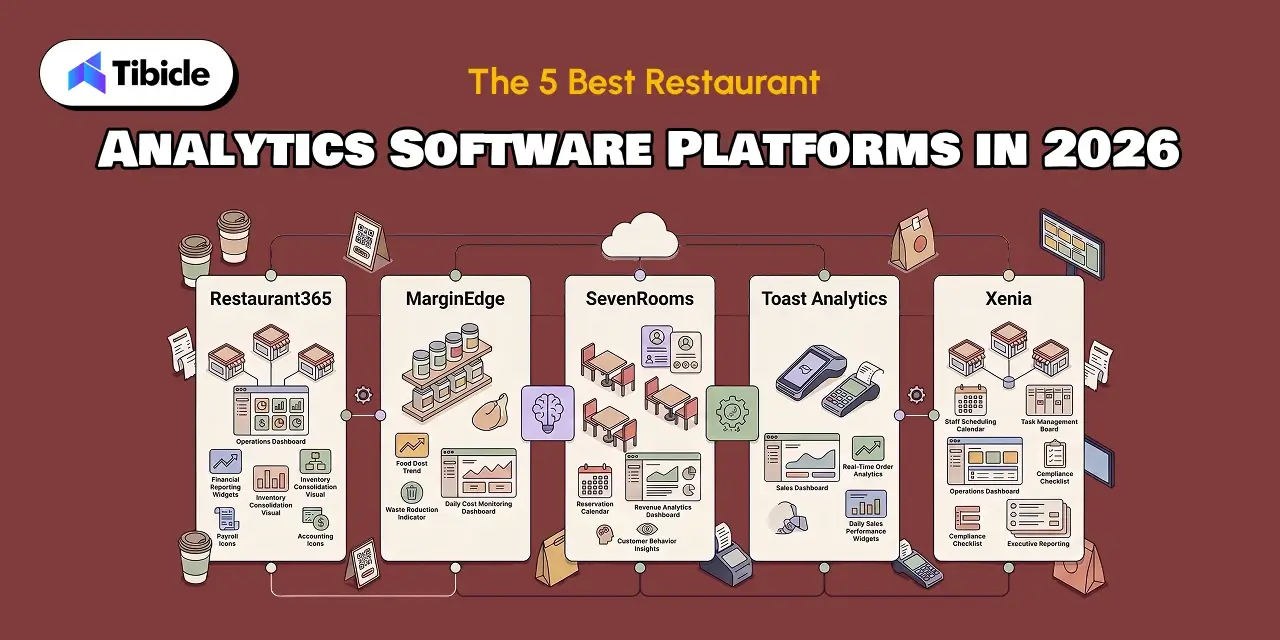
1. Restaurant365: Best for Multi-Unit Back-Office Consolidation
What it is: Restaurant365 is an ERP-grade platform that combines accounting, inventory, scheduling, and analytics into a single system. For groups running five or more locations on separate tools, the consolidation alone justifies evaluation.
Standout capability: A real-time dashboard for P&L by location eliminates the QuickBooks workarounds that most multi-unit operators are running by the time they reach this stage. Daily visibility into food cost and labor by unit means variance is caught in the period it happens, not at month-end close.
Key limitation: Single-location restaurants should look elsewhere. The multi-unit financial consolidation capabilities that define Restaurant365’s value proposition don’t apply at that scale, and the pricing reflects an infrastructure built for complexity that a single-unit operator doesn’t have.
Pricing: Approximately $469 per month per location at the small business tier. Enterprise pricing is custom.
Best-fit operator: Multi-location groups with $5M+ in revenue that need consolidated financial control across units.
2. MarginEdge: Best for Daily Food Cost Visibility
What it is: MarginEdge is an invoice automation and food cost analytics platform that produces daily P&L output by pulling live invoice data directly into recipe costing.
Standout capability: Invoice and AP automation via photo capture, with recipe costing that updates automatically as invoice prices change. Automated invoice processing tools like
MarginEdge helps operators identify 8 to 15% more cost-saving opportunities than manual invoice entry. That’s not a feature comparison; it’s a margin recovery figure that compounds monthly.
Key limitation: MarginEdge is a food cost and invoice tool, not a full operational analytics platform. Operators needing labor analytics, multi-platform consolidation, or demand forecasting will need to pair it with another tool.
Pricing: Flat monthly fee of approximately $330 per location. No long-term contracts.
Best-fit operator: Independent restaurants and small groups of one to five locations where food cost is the primary margin leak.
3. SevenRooms: Best for Guest Analytics and Revenue-Per-Cover Optimization
What it is: SevenRooms is a reservation and guest data platform with marketing performance analytics built around the guest relationship, not the transaction.
Standout capability: Reservation-level guest behavior insights, visit frequency, spend per cover, dietary preferences, and behavioral profiling enable table mix optimization and personalized upsell targeting. For operators where repeat guest value is the core revenue model, this data layer is the competitive advantage that generic POS reporting doesn’t surface.
Key limitation: Users have noted concerns around high fees and customer service responsiveness. Evaluate contractual support terms carefully before committing to an annual contract.
Pricing: Custom. Requires a direct sales conversation.
Best-fit operator: Fine dining and upscale casual with strong reservation volume and a direct loyalty strategy.
4. Toast Analytics (Native): Best for Single-Location Operators Already on Toast POS
What it is: Toast Analytics is the built-in reporting layer within the Toast POS ecosystem. No additional platform, no additional login, no incremental cost for existing subscribers.
Standout capability: Intuitive interface with faster transaction processing, labor tracking, and sales reporting. For single and small-to-medium restaurants that need integrated POS with analytics, the friction of a separate platform doesn’t generate enough additional value to justify the cost.
Key limitation: Toast Analytics is limited to the Toast data ecosystem. There is no third-party consolidation and no demand forecasting beyond what Toast’s own algorithms generate. Operators with non-Toast POS systems or multi-platform delivery data cannot use this effectively.
Pricing: Included in the Toast POS plan. No incremental analytics spend.
Best-fit operator: Single-location operators under $2M revenue who want actionable data without platform overhead.
5. Xenia: Best for Multi-Location Operations Execution with Analytics
What it is: Xenia is an operations management platform with built-in analytics, task management, compliance auditing, and AI-powered dashboards. It’s the only platform in this comparison that connects analytics directly to field-level execution accountability.
Standout capability: Conversational dashboards, photo analysis, smart summaries, and operational task management are all built in, unlike analytics-only tools that require a separate execution platform to act on what the data shows. Xenia connects the insight to the action inside the same system.
Key limitation: The analytics depth for financial metrics like recipe costing and invoice variance is thinner than MarginEdge or Restaurant365. Operators with complex food cost control requirements may need a dedicated food cost tool alongside it.
Pricing: Free up to 5 users. Quote-based pricing above that threshold.
Best-fit operator: Multi-location QSR and fast-casual operators needing analytics tied directly to field-level execution and compliance accountability.
Side-by-Side Comparison: Restaurant Analytics Software in 2026
Use this table to narrow the field before deeper evaluation. Pricing reflects publicly available 2026 data. Verify directly with vendors before building a year-one budget.
| Platform | Best For | Starting Price | POS Integration | AI Features | Contract |
| Restaurant365 | Multi-unit back-office (5+ locations) | ~$469/mo/location | Broad (Toast, Square, etc.) | Predictive P&L, labor forecasting | Annual |
| MarginEdge | Food cost control, 1-5 locations | ~$330/mo/location | 60+ POS systems | Recipe cost auto-update | Month-to-month |
| SevenRooms | Guest analytics, fine dining | Custom | Reservation + POS | Guest preference modeling | Annual |
| Toast Analytics | Single-location Toast users | Included in POS plan | Toast native only | Sales summaries, basic dashboards | POS-tied |
| Xenia | Multi-location ops + analytics | Free up to 5 users | POS + HRIS (Workday, ADP) | Conversational dashboards, audits | Flexible |
Note: Pricing reflects mid-market tiers. Enterprise pricing is custom across most categories.
Running more than two locations and still pulling reports manually? Contact Tibicle; we map your current data stack and identify which platform fits your revenue stage.
Pricing Reality Check: What Restaurant Analytics Software Actually Costs at Scale
Restaurant analytics is a $0 to $2,000 per month decision. Actual costs depend entirely on location count, revenue stage, and what the existing POS already covers.
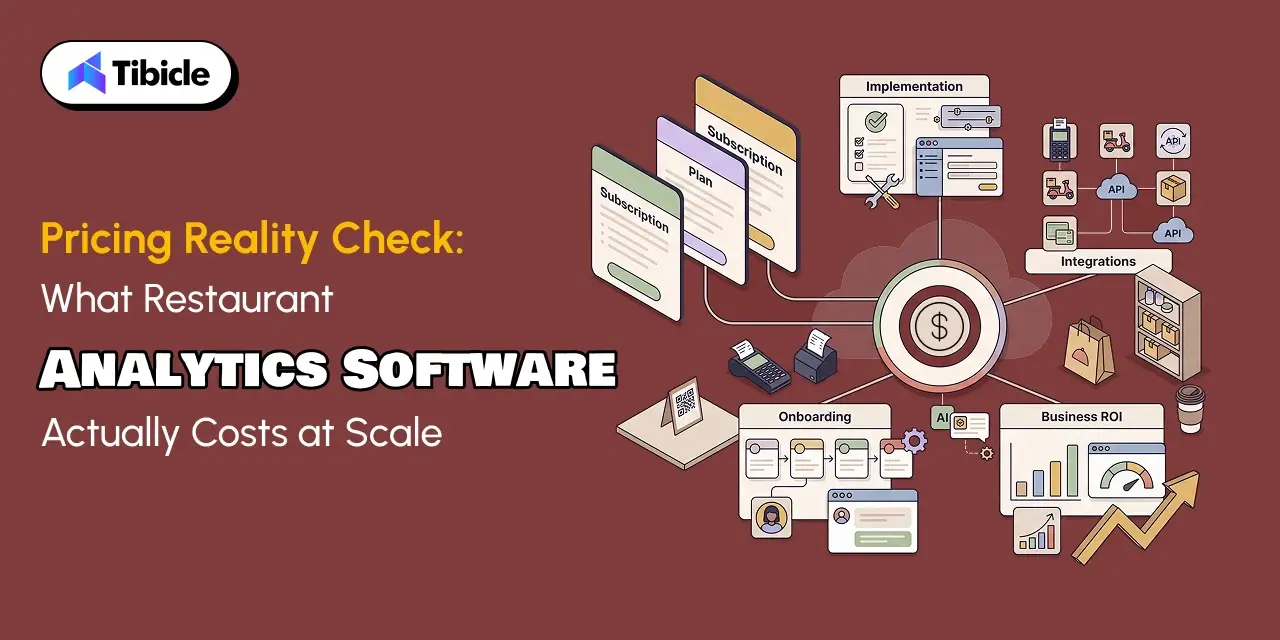
The Real Budget Range for restaurant analytics software in 2026
⦁ A restaurant operating a single location and generating less than $2M in annual revenue can often meet its analytics needs for $0 to $100 per month by using POS-native tools alongside structured spreadsheet reporting.
• As operations expand to two to five locations, the typical monthly investment increases to $300 to $600. At this stage, platforms such as MarginEdge and Xenia usually provide the right balance of functionality and cost.
• Enterprise-grade analytics become a worthwhile investment once a business manages five or more locations. Operators in this category should budget approximately $500 to $1,500 or more per month for solutions like Restaurant365 or comparable multi-platform systems.
Hidden Costs That Erode ROI in Restaurant Analytics Software
Implementation and data migration run 2 to 8 weeks of IT time, depending on platform complexity and the cleanliness of source data. Management training before go-live requires 2 to 4 hours of structured time, not optional, not self-serve documentation. Integration fees for non-native POS connections and customization costs for multi-location dashboard configuration are two budget lines that consistently appear after the contract is signed.
When the Cost Is Clearly Justified in restaurant analytics software
Workflow automation recovers 3 to 6 hours of manager time per week at operations that previously ran manual reporting. At GM-level compensation, $330 a month is break-even at one recovered labor hour per week. At two locations with two GMs, the payback is immediate. The cost question resolves quickly once it’s framed against the actual time it replaces.
ROI Benchmarks: What Operators Are Actually Getting Back
The following benchmarks reflect documented industry performance rather than vendor projections. Use them as directional inputs, not guarantees.
Food Cost Recovery
Restaurants using real-time analytics report 12 to 18% improvements in food cost control compared to operations relying on weekly manual tallies. Applied to a $1M annual food spend, a 12% improvement recovers $120,000, against an annual software spend of $4,000 to $18,000, depending on platform and location count. The inventory variance gap is where most operators find their fastest payback, typically within the first 60 to 90 days of go-live.
Labor Efficiency Gains
Predictive scheduling informed by demand forecasting reduces over-scheduling, the highest controllable cost for most table-service operators. Labor cost as a percentage of revenue typically runs 28 to 35%. Analytics-informed scheduling consistently targets 2- to 4-point reductions in that figure. At $3M in annual revenue, a 2% labor improvement recovers $60,000 in margin annually, roughly 15 times the cost of a mid-market analytics platform at that revenue stage.
Revenue Uplift Through Menu and Guest Data
Customer lifetime value modeling via platforms like SevenRooms enables targeted re-engagement campaigns that bring high-value guests back at a higher frequency. Menu engineering data drives item-level margin improvement without requiring menu price increases by repositioning high-margin items and removing low-margin volume drivers. Dunkin’ used analytics to streamline its menu by removing underperforming items, reducing operational complexity, and improving both service speed and profitability. The same approach applies to any multi-location group with sufficient transaction data to identify the signal in the noise.
Risks and Challenges Before You Commit to a Platform
Most platform evaluations focus on capability. These are the three failure modes that determine whether that capability actually produces ROI after the contract is signed.
Integration Failure: The Most Common ROI Killer
Platforms fail when source data is dirty: duplicate customer records, inconsistent POS item naming, unlinked delivery channel data. The due diligence step most operators skip is a data audit before contracting, not after onboarding, when fixing it requires unpicking a system that’s already live. Ask every vendor directly: what does your integration failure rate look like in the first 90 days of go-live?
Adoption Risk: When the Dashboard Gets Ignored
Restaurant reporting software without a management response protocol produces no ROI. The metric that reveals adoption failure is login frequency per manager per week. If that number isn’t tracked and reviewed, it typically drifts to zero within 60 days of implementation. Best practice: set a formal 30-60-90-day review cadence post-implementation to measure whether the priority metrics the platform was purchased to improve have actually moved.
Vendor Lock-In at the POS Layer
Toast-native analytics creates a data dependency. If the POS changes, the reporting layer has to be rebuilt from scratch. Platform-agnostic tools like MarginEdge and Restaurant365 carry a higher monthly cost but preserve operational flexibility at the cost of a POS switch. Three contract terms to scrutinize before signing: data portability clauses, minimum location commitments, and price escalation provisions on annual renewals.
Vendor Selection Checklist: 9 Questions to Ask Before You Sign
Before committing to any restaurant analytics software platform, require direct answers to these nine questions. Not from marketing materials, from the implementation team.
- Confirm integration capabilities: Does the platform connect natively to your current POS, or does it rely on third-party middleware?
- Verify data ownership: Can you export your complete dataset if you decide to switch vendors in the future?
- Implementation timeline: What is the realistic go-live window, and what is the vendor’s failure rate in the first 90 days?
- Understand pricing scalability: Is pricing based on locations, users, or a flat fee, and how does it change at 10, 20, or 50 locations?
- Differentiate AI from reporting: Does the solution provide predictive alerts or only historical reports and dashboards?
- Evaluate onboarding support: Will your team receive structured training with milestones, or is onboarding limited to self-service documentation?
- Examine the contract carefully: Are the terms month-to-month or annual, and what are the exit conditions and data portability rights?
- Assess consolidation capabilities: Can the software combine data from delivery apps, payroll systems, loyalty platforms, and your POS into one view?
- Reference operators: Can they provide references from groups at our revenue stage and location count?
Why Tibicle LLP Is Worth Evaluating for Analytics-Adjacent Development
Most operators don’t have a data strategy problem. They have a data activation problem. The restaurant reporting software works. The question is whether the insights are connected to operational decisions at the location level, or whether they sit in a dashboard that gets checked once a month during a management meeting.
Tibicle LLP specializes in custom software development for F&B and multi-location operators, building the middleware layer, POS connectors, and operational dashboards that off-the-shelf platforms don’t configure out of the box. For groups at the stage where standard platforms fall short of their specific integration or UI requirements, Tibicle’s development approach starts with your existing stack and builds toward the data layer you actually need.
Describe your stack and get a scoping call with Tibicle’s team.
Conclusion
Choosing the right restaurant analytics software isn’t about selecting the platform with the most features. Instead, prioritize a solution your management team actually uses every shift, integrates directly with your POS, and delivers alerts quickly enough to prevent costly issues.
Across different revenue stages, location counts, and operational priorities, the five platforms above remain the strongest options for operators in 2026. Use the comparison table and vendor checklist to narrow the field, then pressure-test the finalist with a live integration demo on your actual data, before signing.
Frequently Asked Questions
What is restaurant analytics software?
A dedicated platform that aggregates POS, inventory, labor, and guest data into unified dashboards and real-time alerts, replacing fragmented spreadsheet reporting with automated operational intelligence.
How much will restaurant analytics software cost in 2026?
Pricing ranges from $0 for POS-native tools like Toast Analytics to $2,000 or more per month for enterprise platforms. Mid-market operators typically budget $300 to $600 per location per month for standalone analytics tools.
Do I need restaurant analytics software if I already have a POS?
Most single-location operators do not. Native dashboards from Toast, Square, and Clover cover core metrics adequately. A separate analytics tool is justified when you have multiple locations to reconcile or need predictive forecasting that the POS cannot provide.
What is the fastest ROI from restaurant analytics software?
Food cost variance recovery. Real-time inventory tracking typically delivers measurable payback within the first 60 to 90 days of adoption for operators with meaningful monthly food spend.
How long does restaurant analytics software implementation take ?
Between same-day for POS-native tools and 4 to 8 weeks for full back-office platforms like Restaurant365. Budget 2 to 4 hours of structured manager training before go-live regardless of platform.
Schedule A Developer Interview And Get 15 Days Risk-Free Trial
Schedule a Call

Relevant Blog
Custom AI Chatbot Development Services

Diya Koradiya

GraphRAG Implementation Services

Arjun Shinojiya
Enterprise AI Automation Development Agency
Arjun Shinojiya
Written by
Recent Blogs
Custom AI Chatbot Development Services
What This Guide Covers Who this is for: CIOs, CTOs, AI leaders, operations executives, customer support teams, and enterprise technology decision-makers evaluating custom AI chatbot development services for internal knowledge access, customer support, helpdesk automation, or other business-critical use cases. It is particularly relevant for organisations with proprietary knowledge bases, sensitive data, complex access controls, […]
GraphRAG Implementation Services
Who this is for: Engineering leads and product owners at enterprise SaaS companies evaluating GraphRAG implementation services for a knowledge base or retrieval system that vector search alone is not answering well. Search intent: Commercial evaluation with a technical backbone. The reader has moved past “what is GraphRAG” and wants to know when a knowledge […]
Enterprise AI Automation Development Agency
Who this is for: Operations leads, CTOs, and process owners evaluating an enterprise AI automation development agency for a full business process rather than a single bolted-on bot. Search intent: Commercial evaluation with a technical backbone. The reader has moved past “what is workflow automation” and wants to know why point-solution RPA plateaus, what end-to-end […]
Got an Idea? Get FREE Consultation
In our world, there's no such thing as having too many clients

