
Restaurant Inventory Software Guide for SMBs (2026)

Jul 27, 2026

Read in 7 Minutes
Table of Contents
- What This Guide Covers
- Introduction
- What Restaurant Inventory Software Actually Does
- Core Capabilities That Drive Business Outcomes
- Where SMBs Use Restaurant Inventory Software: Real Operational Scenarios
- Restaurant Inventory Software Compared: Choosing the Right Tier
- What Restaurant Inventory Software Actually Costs and What Gets Hidden
- ROI and Business Impact: What Changes After Implementation
- Risks and Challenges SMBs Face When Implementing Inventory Software
- Vendor Selection Checklist for Restaurant Inventory Software: What to Ask Before Signing
- Top Restaurant Inventory Software Options for SMBs in 2026
- Why Tibicle LLP Is Worth Considering for Custom Restaurant Inventory Software
- Conclusion
- FAQs
What This Guide Covers
Who this is for: SMB restaurant owners, multi-unit operators, and finance-conscious GMs running food cost 3–5 points above target on spreadsheets or manual counts, who are evaluating whether a dedicated restaurant inventory software can close the gap between theoretical and actual food cost.
Search intent: Evaluation and decision — the reader isn’t asking what restaurant inventory software is. They’re deciding which pricing tier fits their operational scale, whether the ROI justifies the switch from spreadsheets, and which platform matches their POS and location count.
What you will walk away with: A breakdown of four core capabilities (real-time depletion, recipe costing, automated reordering, shrinkage detection) with the business outcome each one drives, a three-tier pricing comparison across six platforms with hidden first-year costs, ROI benchmarks tied to real food-spend numbers, a 12-point vendor selection checklist, and a clear framework for when off-the-shelf software fits versus when a custom build makes more sense.
Introduction
Most restaurants running food costs 3–5 points above target are not dealing with a kitchen problem. They are dealing with a tracking problem. Thirty to forty percent food waste, end-of-week surprise variances, and shrinkage that never shows up with a name attached, these are the outputs of broken inventory processes, not broken recipes. Restaurant inventory software is not a technology upgrade. It is a financial control layer that replaces the guesswork currently sitting between your food spend and your margin.
This guide is a decision-making resource for SMB restaurant owners, multi-unit operators, and finance-conscious GMs, not a software list.
Here is what the data, the platforms, and the real operators actually show.
What Restaurant Inventory Software Actually Does
Beyond Counting Stock
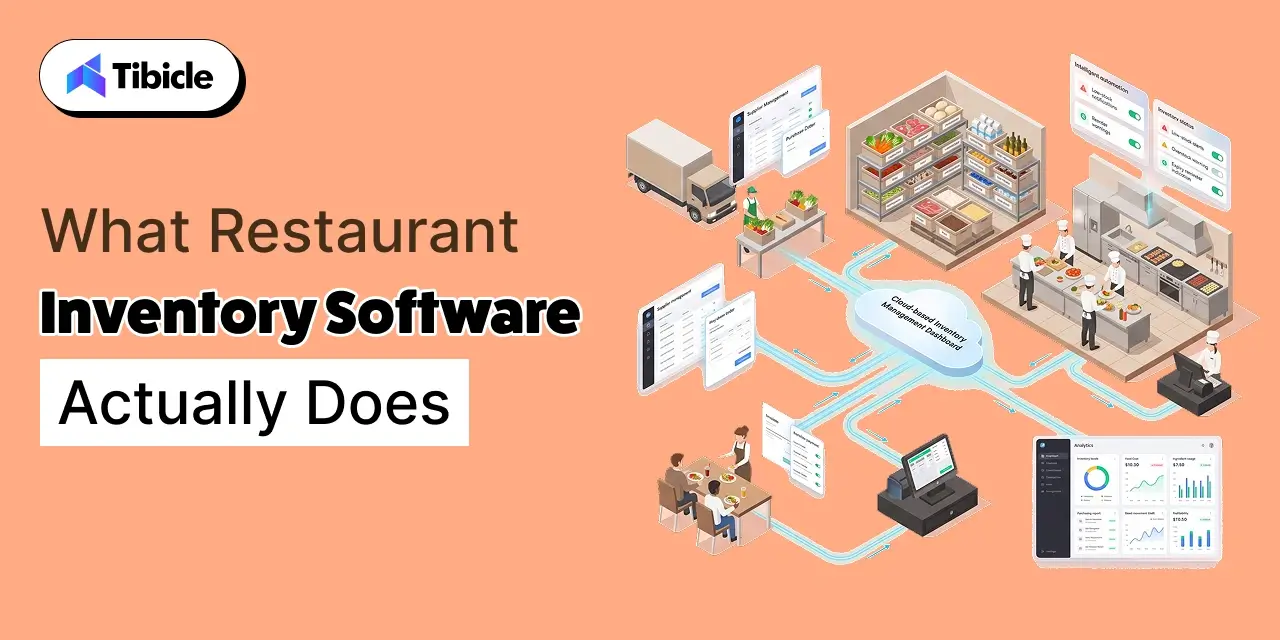
The four core functions that define this category: real-time stock tracking, recipe costing, automated reorder triggers, and POS integration. Each one addresses a specific failure mode in manual inventory management, and none of them are replicable in a spreadsheet at any meaningful operational speed.
Real-time tracking knows what is in the walk-in based on what has been sold and received, not based on when someone last counted. Recipe costing connects ingredient costs to menu items so margin is calculated at the dish level, not estimated at the month-end. Automated reorder triggers prevent the stock-out that happens when a manager forgets to place a Tuesday order. POS integration makes all of the above continuous rather than periodic.
What spreadsheets cannot catch: the slow variance that accumulates between counts. A spreadsheet shows you what you had and what you have. It cannot tell you what happened in between.
Why Manual Inventory Fails SMBs at Scale
Seventy-five percent of restaurants struggle to maintain profitability due to poor food cost management. The mechanism is not dramatic, it is incremental. Shrinkage control failures, human counting error, and food cost variance accumulate week over week, invisible until the P&L shows a margin that does not match the menu pricing. By then, the loss is already three weeks old.
Software functions as a financial control layer: it closes the gap between theoretical food cost and actual food cost by making variance visible in real time rather than in retrospect.
Core Capabilities That Drive Business Outcomes
Real-Time Stock Depletion via POS Integration
A perpetual inventory system auto-decrements ingredient counts with every POS sale. A burger sells, the bun, the patty, the portion of sauce all decrement simultaneously. No manual count required between transactions. The operational outcome is the elimination of end-of-week surprise variances: if the system shows 12 pounds of salmon on hand and the walk-in has 8, that 4-pound gap is a variance report, not a mystery discovered during prep.
This is the core distinction between inventory software and inventory counting. One tracks what you have. The other tracks what you should have and flags the difference.
Recipe Costing and Menu Profitability
Recipe costing maps ingredient costs to every menu item at the portion level. When a supplier raises the price of chicken thighs, every dish that uses chicken thighs updates its theoretical cost automatically. Menu engineering becomes a data exercise rather than an intuition exercise: which dishes carry the margin, which ones bleed it, and which ones sell well but contribute minimally to profit.
Food costs typically run 30–35% of revenue. The gap between theoretical food cost, what the recipe math says it should cost, and actual food cost is where margin recovery lives. Recipe costing closes that gap by making it visible at the item level, not just at the category level.
Automated Reordering and Par Level Management
Par level management sets the minimum stock threshold for each ingredient and triggers a purchase order automatically when that threshold is crossed. The distinction between platforms at this level: rule-based reordering fires when stock hits a set number. AI-driven demand forecasting in higher-tier tools adjusts par levels based on upcoming covers, seasonal patterns, and historical velocity, so the order placed on Monday reflects what Thursday actually needs, not what last Thursday used.
For SMBs with lean back-office teams, the operational value is not just automation. It is the elimination of the stock-out and over-order cycle that inflates both food cost and waste simultaneously.
Vendor Management and Invoice Processing
Platforms like MarketMan and BlueCart handle supplier catalogs, price comparison across vendors, and invoice processing in the same system that manages stock levels. The xtraCHEF model uses OCR-based invoice scanning, a photo of the invoice creates a digitized record that flows into food cost calculations without manual data entry.
For SMBs with one or two managers handling purchasing, accounts payable, and operations simultaneously, the time value of automated invoice processing is measurable in hours per week that currently go into data entry that produces no operational insight.
Shrinkage Detection and Theft Prevention
Shrinkage control is a financial function before it is a kitchen hygiene function. Seventy-five percent of restaurant inventory shrinkage in the US is attributed to employee theft, costing an estimated $20 billion annually. Variance reports the gap between what the perpetual system expects and what the physical count finds. This surfaces the problem at the location level and the item level without requiring surveillance.
A variance report that shows consistent shrinkage on high-value proteins at one location, on one shift, is actionable. A general sense that food cost is running high is not.
Where SMBs Use Restaurant Inventory Software: Real Operational Scenarios
Single-Location Independents
Owner-operated restaurant, one to two managers, no dedicated back-office. The primary need is food cost management software that takes under 30 minutes weekly to run and does not require a finance background to interpret. At this scale, recipe costing and weekly variance reporting are the features that move the margin. Supplier catalog management and multi-location reporting do not add complexity without adding return at one location.
The right tool for this profile keeps the weekly process simple: count, compare to system, review variance, adjust ordering. Anything that requires daily touchpoints or dedicated setup time will be abandoned within 60 days.
Multi-Location Groups (2–5 Sites)
Centralized purchasing, location-level variance reporting, and consolidated restaurant inventory tracking across two to five sites. This is where the cost of not having unified software becomes quantifiable: an average 8% food cost variance across 12 locations equals approximately $187,000 in annual loss. The same variance at three locations is still a five-figure problem that a centralized dashboard surfaces and a location manager reviewing a spreadsheet does not.
The operational shift at this scale is from tracking to comparison: which location is running variance, on which items, in which time window. That question requires multi-location consolidation that spreadsheets cannot provide without significant manual assembly.
High-Volume Fast Casual
Ingredient-level depletion speed, batch recipe costing, and labor-efficient counting are the defining requirements. An automated inventory system that reduces weekly count time by 50% or more frees the kitchen manager to run production rather than count it. At high volume, the depletion rate on key ingredients, proteins, dairy, and produce, moves fast enough that daily variance visibility is operationally useful, not just analytically interesting.
Restaurant Inventory Software Compared: Choosing the Right Tier
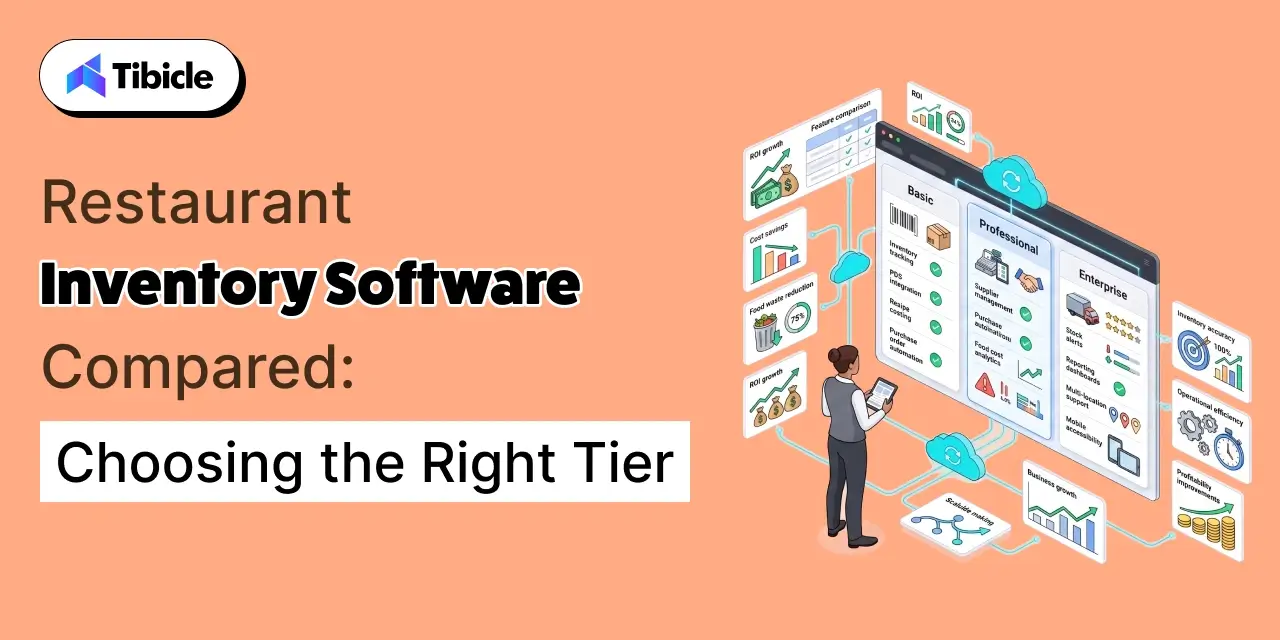
The three pricing tiers in this category reflect different operational realities. Matching the tier to actual complexity matters more than chasing the most features, an over-specified platform creates setup overhead that prevents the ROI it was purchased to deliver.
| Platform | Best For | Key Strength | POS Integration | Starting Price / Month | Onboarding Fee |
| MarketMan | Multi-unit SMBs | Full inventory management + vendor catalog | Toast, Square, Lightspeed, Clover | $239 | ~$500 |
| MarginEdge | Food cost visibility | Financial reporting + invoice synchronization | Toast, Aloha, Brink | $330 | Included |
| Restaurant365 | Restaurant groups with accounting needs | All-in-one inventory, payroll, and accounting | Most major POS systems | $469 | Separate (typically high) |
| xtraCHEF (Toast) | Toast-only operators | AI-powered invoice scanning | Toast native only | Included in some Toast plans | Minimal |
| BlueCart | Budget-conscious operators | Supplier ordering and procurement | Square (limited integrations) | $10 (Basic) | None |
Per-location fees apply on most platforms above $200/month. Always request the total first-year cost, not the monthly subscription alone.
What the Price Tiers Actually Tell You
Low tier ($10–$50/month): ordering workflow only, no recipe costing or variance reporting. Mid tier ($200–$400/month): full restaurant stock control for most independent and small-group operators. This is where the ROI case is clearest. Full systems ($400–$600+/month): justified when accounting consolidation and multi-unit financial reporting are active operational needs, not aspirational ones.
What Restaurant Inventory Software Actually Costs and What Gets Hidden
The Visible Cost vs. The Total First-Year Cost
The monthly subscription is the visible number. The total first-year cost includes per-location fees that compound at scale, onboarding (MarketMan runs approximately $500; Restaurant365 significantly higher), and internal setup time for recipe libraries and ingredient mapping. A platform with a $300/month headline can cost $6,000–$8,000 in year one when all components are included.
Frame this as a total cost of ownership question before the contract conversation, not after.
When the Cost Is Justified: A Simple ROI Benchmark
A restaurant doing $80,000 per month in food purchases, running food cost at 32% against a 29% target, loses $2,400 per month every month. A $300/month platform pays back in under two weeks of food cost improvement at that gap. Modern inventory tools improve margins by 2–10%, with up to 15% reduction in shrinkage. The ROI case does not require optimistic assumptions. It requires a baseline food cost number and a target.
When It Is Not Worth It Yet
If food purchases are under $40,000 per month and weekly count discipline has not been established, a $300/month platform will not fix the process problem. Start with BlueCart or a structured spreadsheet. Software accelerates good process. It does not create it. Operators who deploy inventory software before establishing count consistency get accurate reports on an inconsistent operation and conclude the software does not work.
ROI and Business Impact: What Changes After Implementation
Food Cost Reduction: The Primary Return
Operators who implement inventory software properly, completing recipe builds, running weekly counts, and reviewing variance against theoretical, typically see food cost drop 1–3 percentage points within the first few months. On a $1M annual food spend, a 2-point improvement equals $20,000 recovered. That number does not require a perfect implementation. It requires a consistent one.
Labor Efficiency on Inventory Tasks
Weekly inventory counts drop by 50–75% in time cost with a perpetual system active. For multi-location groups, this translates to 10–15 manager hours per week redirected to operations rather than counting. At a $25/hour manager labor rate, 12 hours per week is $15,600 annually in recovered management capacity before any food cost improvement is included in the return calculation.
Waste and Shrinkage Recovery
Every $1 in saved food creates additional revenue when the relationship between food cost and revenue is applied at the margin level. Shrinkage control through variance reporting reduces theft exposure and spoilage without surveillance through data accountability. A variance that must be explained is a variance that is less likely to recur.
Decision Speed for Ownership and Finance Teams
Real-time food cost data versus weekly spreadsheet reconciliation changes the timing of three decisions that compound in value: menu pricing adjustments, supplier negotiation timing, and promotional planning. An owner who knows food cost is running 2 points high in week two can act in week two, not in week six when the monthly report confirms it.
Risks and Challenges SMBs Face When Implementing Inventory Software
Recipe Library Setup: The Hidden Time Cost
Most platforms require 20–80 hours of setup to build ingredient libraries and map recipes before meaningful data flows. This is the most consistently underestimated implementation cost. Operators who skip or rush this step see no ROI, not because the platform does not work, but because the data it reports against is incomplete. Budget the setup time as part of the investment, not as a problem to solve after go-live.
POS Integration Depth Varies: Do Not Assume Compatibility
“Integrates with Toast” can mean full real-time depletion sync or a daily sales file import with a 24-hour data lag. The operational difference is significant: one enables real-time variance tracking, the other enables better-than-spreadsheet weekly reporting. Confirm native integration with your specific POS version before signing, not just the brand name. BlueCart has no POS integration at all.
Staff Adoption and Count Discipline
Inventory software fails when counts are not done consistently. The platform does not enforce the process, management does. Weekly count accountability requires a defined owner, a defined time window, and a defined review process for variance reports. None of that is built into the software. Build it into the operating cadence before go-live, not after the first month of missing data.
Switching Costs and Data Lock-In
Recipe libraries, historical variance data, and supplier catalogs built inside one platform do not export cleanly to another. This is a long-term vendor decision, not a monthly subscription. Evaluate data portability terms before signing, specifically: what exports are available, in what format, and what happens to historical data on account cancellation.
Vendor Selection Checklist for Restaurant Inventory Software: What to Ask Before Signing
Operational Fit
- Does it integrate natively with your exact POS version, not just the brand?
- Does it support multi-location reporting if expansion is planned within 18 months?
- Can it handle your ingredient count and recipe volume without tiered pricing increases?
Pricing Transparency
- What is the total first-year cost, including onboarding fees and per-location charges?
- Are per-location fees added on top of the base subscription at your current and projected location count?
- What happens to your data, recipe library, variance history, and supplier catalog, if you cancel?
Implementation Reality
- How long does recipe library setup take, and who is responsible for completing it?
- Is onboarding included in the subscription or charged separately?
- What does the support model look like after the initial onboarding window closes?
Growth Alignment
- Does the platform scale to accounting and payroll consolidation if the operation grows?
- Is AI-driven demand forecasting available now or on the product roadmap with a confirmed timeline?
- Are there commission fees on orders placed through the platform’s supplier network?
Top Restaurant Inventory Software Options for SMBs in 2026
MarketMan is the strongest fit for multi-unit SMBs that need full inventory management combined with vendor catalog control. Native integration with Toast, Square, Lightspeed, and Clover covers most POS environments. Best for operators who need recipe costing and vendor management in the same system.
MarginEdge fits operators where food cost visibility and financial reporting are the primary gaps. Invoice sync and daily P&L output make it the strongest choice for independents where the back-office is one person doing three jobs. Integration with Toast, Aloha, and Brink covers the major full-service POS environments.
Restaurant365 is the right evaluation for groups that need inventory, payroll, and accounting consolidated. The implementation investment is significant, onboarding fees are charged separately and setup timelines run long. Justified at five or more locations where the cost of fragmented systems exceeds the platform cost.
xtraCHEF by Toast is purpose-built for operators already in the Toast ecosystem. AI-powered invoice scanning eliminates manual AP entry. No independent utility outside Toast, if a POS change is possible within 24 months, this creates lock-in risk worth evaluating in advance.
BlueCart is the right starting point for budget-first operators under $40,000 per month in food spend who need supplier ordering structure before they need recipe costing. No POS integration and no variance reporting, position this as a process-building tool, not an inventory analytics platform.
Lightspeed Restaurant includes inventory management within its POS suite, making it a reasonable consideration for operators evaluating POS and inventory simultaneously who are not yet ready for a dedicated inventory platform.
Why Tibicle LLP Is Worth Considering for Custom Restaurant Inventory Software
When Off-the-Shelf Does Not Fit
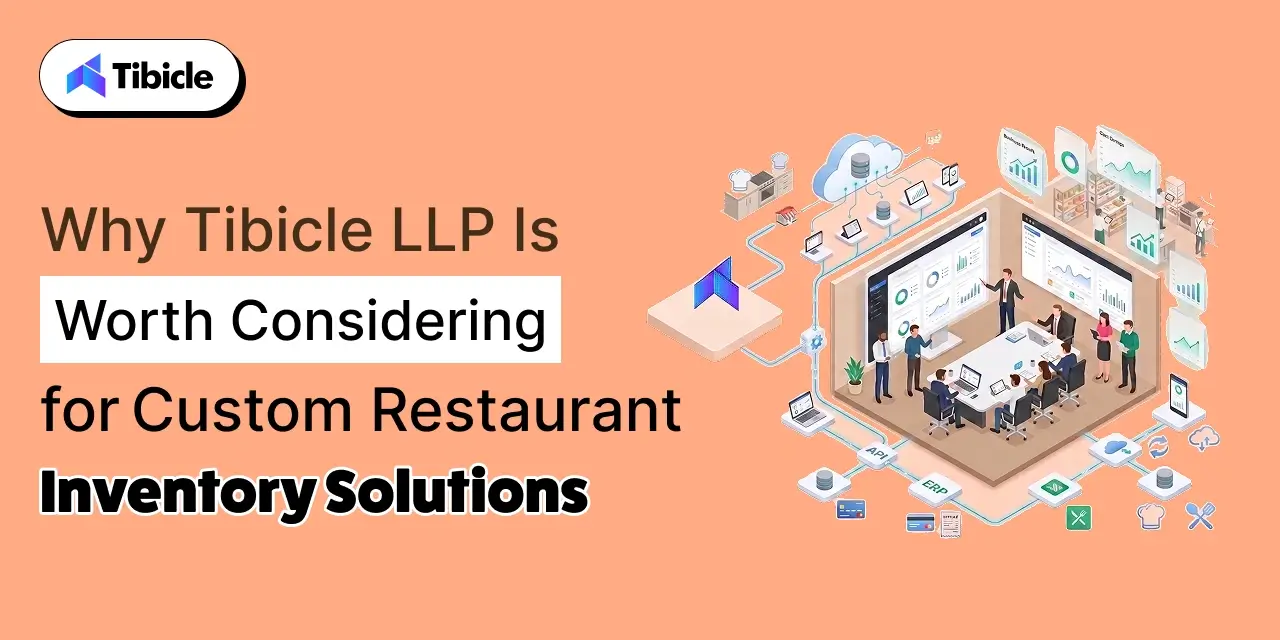
Non-standard POS environments, proprietary supplier systems, franchise-level reporting requirements, or the need to consolidate inventory with kitchen display, HR, and accounting in one codebase, these are the scenarios where off-the-shelf platforms reach their limit. Per-location and per-module fees that compound at five or more sites change the total cost of ownership math significantly. At that point, the recurring subscription cost versus a one-time build cost becomes a legitimate financial comparison, not an edge case.
What a Custom Build Gets You
Full data ownership with no per-location fees, purpose-built workflows that match actual operational process rather than a platform’s default configuration, and integrations with any supplier or POS API, not just the ones the platform has prioritized. Tibicle’s development work in this space starts from the existing stack and builds toward the data layer the operation actually needs, without vendor lock-in on either the inventory logic or the reporting layer.
Exploring a custom-built inventory system? Tibicle’s team can scope the build against your current stack, no vendor lock-in required.
Conclusion
Food cost is the most controllable cost line in a restaurant’s P&L. The right restaurant inventory software matched to operational scale and actual POS environment is not a technology expense. It is a margin recovery tool with a calculable payback period.
The ROI benchmark is straightforward: a 2-point food cost improvement at $80,000 per month in food spend covers a $300/month platform in under two weeks. The checklist above surfaces the integration, pricing, and implementation variables that determine whether that return materializes in 60 days or gets delayed by a setup problem nobody planned for.
Match the platform to the operation. Build the process before deploying the software. Review variance weekly. The rest follows.
Ready to tighten your inventory control? Whether you are evaluating a platform or building a custom system, Tibicle’s team works with SMB restaurant operations to get the fit right. Talk to us →
FAQs
What is the difference between perpetual and periodic restaurant inventory management?
A perpetual inventory system updates automatically with every POS sale, and stock levels reflect real-time depletion without manual counting between transactions. Periodic inventory requires manual counts at set intervals, leaving variance invisible in between. Most SMBs moving off spreadsheets should target perpetual tracking as the baseline, since it is the mechanism that makes real-time food cost visibility possible.
How much does restaurant inventory software cost for a small restaurant?
Mid-tier dedicated platforms like MarketMan and MarginEdge run $200–$400 per month, plus onboarding fees that can reach $500 or more. Budget-first operators can start with BlueCart at $10 per month for basic purchasing and restaurant stock control. Always calculate the total first-year cost, including setup, onboarding, and per-location fees, the monthly rate alone understates the real investment by 30–50% in year one.
Does restaurant inventory software integrate with my POS system?
Most major platforms, MarketMan, MarginEdge, Restaurant365, integrate with Toast, Square, Clover, Lightspeed, and Aloha. Integration depth varies significantly: confirm whether your specific POS version supports real-time depletion sync or a daily sales file import. The operational difference between those two integration types determines whether the platform enables real-time variance tracking or better-than-spreadsheet weekly reporting.
How long does it take to see ROI from inventory management software?
Operators who complete recipe setup, run weekly counts, and review variance reports consistently typically see food cost variance improvement within 60–90 days. At $80,000 per month in food spend, a 2-point food cost improvement covers a $300/month platform in under two weeks of savings. The implementation variable that determines this timeline is recipe library completeness, not the platform itself.
Can restaurant inventory software reduce food waste?
Yes. An automated inventory system aligned to demand forecasting and par level management cuts over-ordering by matching purchase volume to actual demand rather than habit. Industry data shows restaurants using food cost management software report up to 15–25% reduction in food waste and a 2–10% improvement in gross margins within the first year of consistent use. When per-location fees across five or more sites make a purpose-built system financially competitive, when major platforms do not support your POS, or when you need deep integration across inventory, kitchen display, HR, and accounting in one system, a custom build eliminates ongoing subscription costs and frees your business from another company’s product roadmap.
When should an SMB consider a custom-built inventory system instead of off-the-shelf software?
A custom build becomes the better choice when per-location fees across five or more sites make it financially competitive, if major platforms do not support your POS, or when you need deep integration across inventory, kitchen display, HR, and accounting in one system. It eliminates ongoing subscription costs and frees your business from another company’s product roadmap.
Schedule A Developer Interview And Get 15 Days Risk-Free Trial
Schedule a Call




Written by

Recent Blogs
Restaurant Inventory Software Guide for SMBs (2026)
What This Guide Covers Who this is for: SMB restaurant owners, multi-unit operators, and finance-conscious GMs running food cost 3–5 points above target on spreadsheets or manual counts, who are evaluating whether a dedicated restaurant inventory software can close the gap between theoretical and actual food cost. Search intent: Evaluation and decision — the reader […]
Online Ordering Systems for Restaurants: Top 5 in 2026
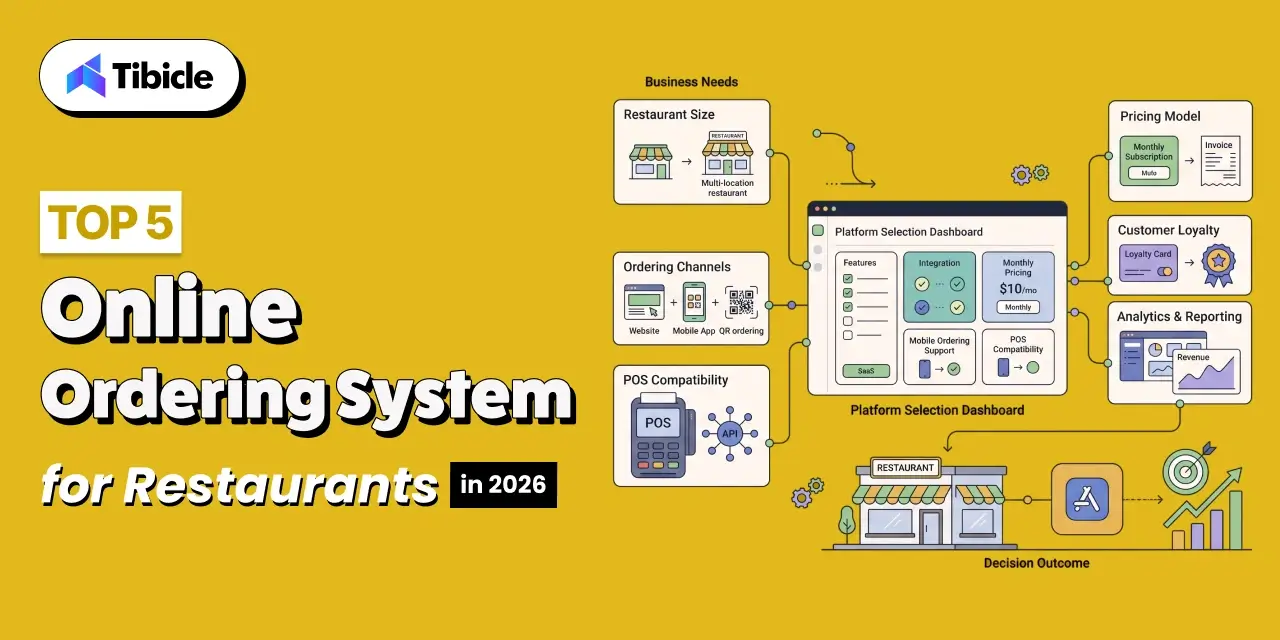
What This Guide Covers Who this is for: Independent restaurant owners, multi-location restaurant operators, cloud kitchen businesses, and F&B decision-makers who are evaluating online ordering systems to reduce third-party delivery commissions, improve profit margins, and choose the right platform for direct customer ordering in 2026. Search intent: Commercial investigation and platform comparison. The reader already […]
Custom POS Software Development: Process, Cost, and When It Makes Sense
Introduction Most businesses run on off-the-shelf point-of-sale software, and most should. But some eventually hit a wall. Their platform cannot model a workflow or support a critical integration. Licensing costs may also climb with every terminal. That wall is what drives interest in custom POS software development. The pressure is real; a Salesforce survey found […]
Got an Idea? Get FREE Consultation
In our world, there's no such thing as having too many clients

